Back to Journals » Patient Preference and Adherence » Volume 20
Comparing a Conceptual Framework and Factor Analysis to Achieve Survey Item Reduction in Predicting Medication Non-Persistence
Authors Umeaghadi CF, Taylor JG, Yao S, Blackburn DF ![]()
Received 22 November 2025
Accepted for publication 18 February 2026
Published 27 February 2026 Volume 2026:20 583612
DOI https://doi.org/10.2147/PPA.S583612
Checked for plagiarism Yes
Review by Single anonymous peer review
Peer reviewer comments 2
Editor who approved publication: Dr Johnny Chen
Chidimma F Umeaghadi,1 Jeff G Taylor,1 Shenzhen Yao,2 David F Blackburn1
1College of Pharmacy and Nutrition, University of Saskatchewan, Saskatoon, Saskatchewan, Canada; 2Public Health Surveillance Unit, Vancouver Coastal Health Authority, Vancouver, British Columbia, Canada
Correspondence: David F Blackburn, College of Pharmacy and Nutrition, University of Saskatchewan, 2A20-107 Wiggins Road, Saskatoon, Saskatchewan, S7N5E5, Canada, Tel +1306-966-2081, Email [email protected]
Abstract: Adherence surveys can be lengthy due to the high number of potential risk factors to be analyzed. As a result, researchers often reduce items into conceptual domains (eg, beliefs, economic factors) to overcome power constraints or focus testing on a specific theme. However, item reduction can also be guided by factor analysis (FA), a process that identifies domains without regard to conceptual frameworks. Although both approaches achieve the same objective, their outputs can be drastically different. It was unclear how the process used to create domains could impact downstream performance of an adherence prediction model. We compared two logistic regression models on the outcome of non-persistence from the same survey data; variables for the models were reduced using a conceptual approach or factor analysis (FA). Both approaches identified three domains from 51 survey items. While domains from the conceptual approach were based on the WHO framework, items contained in FA-guided domains crossed conceptual boundaries. Both models demonstrated good predictive performance with c-statistics of 0.84 (subjective model) and 0.82 (FA model) (p=0.060). The conceptual approach organizes data in a highly relevant structure that aligns with contemporary research and can more readily impact future practice. We found no evidence for a trade-off with respect to model prediction performance.
Keywords: factor analysis statistical, medication adherence, assessment of medication adherence, surveys and questionnaires, epidemiologic research design
Introduction
An immense body of research has uncovered numerous possible risk factors for medication non-adherence.1,2 Triangulating all these factors into a single prediction model is challenging. Researchers must account for complex domains such as beliefs,3 literacy,4 self-efficacy,5 socioeconomic status,6 and treatment satisfaction.7 Each of these domains often demands multiple survey questions for their valid measurement. As a result, adherence surveys can be lengthy8–11 and item reduction strategies are often employed to address power limitations or examine specific themes during analysis. Two main strategies have been used to guide item reduction: conceptual approaches or factor analysis. In conceptual approaches, items are categorized into pre-defined domains.12,13 Medication adherence domains are well recognized in the literature. The World Health Organization (WHO) has identified five dimensions of adherence (ie, Social/economic, Therapy-related, Patient-related, Condition-related, and Health system/health care team factors).1
Factor analysis (FA) is an alternative approach to categorizing survey items into domains.14 The key difference with FA (versus conceptual approach) is that it identifies domains exclusively from data correlations rather than pre-existing paradigms. Both conceptual approaches and FA can be used for the same purpose, yet they have the potential to produce vastly different groupings from the same set of survey items. To our knowledge, the extent to which domains identified with FA categorization align with pre-defined categories by the WHO is unknown for medication adherence surveys. Furthermore, if items are categorized differently with FA, it is unclear downstream prediction models are affected. From a single adherence survey dataset, we performed item reduction using both approaches (ie, conceptual approach vs FA) and compared logistic regression models from each approach on the outcome of non-persistence.
Materials and Methods
This study used a cross-sectional adherence questionnaire entitled Major Determinants of Non-adherence in Saskatchewan (MDNAS) developed by our research group.8,15 The paper questionnaire, consisting of 58 questions (51 adherence items), was mailed by post to new medication users across the province of Saskatchewan between September 16, 2019, and February 28, 2020. Details about the survey have been previously published.8,15 Almost 4,000 surveys were completed and returned; previous studies from the MDNAS survey have explored the interactions between side effects, expectations, and beliefs on the risk for self-reported non-persistence.8,15 We defined non-persistence as an answer of “no” to the question, “Are you still taking the new medicine prescribed to you?”.
For the conceptual approach, the research team organized items under domains from the World Health Organization (WHO) framework for adherence. Some WHO domains were subdivided to help identify coherent groups of items (eg, a subcategory of “beliefs” was created under “patient factors”). A Cronbach’s alpha threshold of 0.6 or higher was used to confirm domains.16,17 Items not categorized in a domain were retained and analyzed individually.
The second approach employed exploratory factor analysis (EFA) to group survey items based on their underlying relationships, independent of pre-existing frameworks.18 To verify the dataset’s suitability for EFA, we conducted the Kaiser–Meyer–Olkin (KMO) test and Bartlett’s test of sphericity, with the number of respondents (ie, 3,029) well above the rule of thumb power requirement (N>1000).19 We employed the Principal Factors method with squared multiple correlations (SMC) as prior communality estimates and applied varimax rotation to optimize the clarity of the factors extracted. This process allowed us to identify distinct domains by focusing on patterns of high correlations among items. Domains were considered significant and retained for further analysis if their eigenvalues exceeded 1.0.20 We further assessed the relevance of each item to its corresponding domain through factor loadings, prioritizing items that demonstrated strong and unique loadings (≥0.4).18 Next, a confirmatory factor analysis was conducted to validate the identified domains and assess the relationships between the latent factors and their observed variables. Model fit was assessed using various indices, including the Adjusted Goodness of Fit Index (AGFI), Comparative Fit Index (CFI), Standardized Root Mean Square Residual (SRMR), and Root Mean Square Error of Approximation (RMSEA). As above, items not categorized were retained for individual analysis in the subsequent prediction model.
Domains identified from each approach were pooled into a single score (ie, Likert scales were scored from 1 to 4 or 1 to 5 depending on the question). All the summary scores were highly skewed making it impossible to model the raw (ie, continuous) values. Thus, we converted each domain into a binary variable using either the 25% or 50% percentile as boundaries. We originally aimed to apply the 25th percentile threshold for all summary scores; however, some scores were so highly clustered in the top 50th percentile it was illogical to divide them. Next, all variables (ie, individual items and pooled) were tested individually against non-persistence and were retained in the final logistic regression model if they: a) demonstrated a significant association with non-persistence on univariable analysis (p-value < 0.05); and b) increased the predictive accuracy of the final model indicated by the Integrated Discrimination Improvement (IDI) value.21 Age and sex were forced in both models to ensure their potential impact was quantified. The c-statistic (ie, area under the receiver operator curve)22 was calculated for each model and compared using the “DeLong test”.23
Survey participants provided written, informed consent and the study received ethics approval from the Research Ethics Board of the University of Saskatchewan (BEH 14–120). The study complied with the Declaration of Helsinki.
Results
Baseline characteristics of MDNAS respondents have been previously reported.8,15 Half of respondents were female (49.5%), 55.7% were under 65 years old and most of the respondents were white (89.9%). Both approaches identified three domains from the 51 adherence items. Ten items were categorized by the conceptual approach, while 15 were categorized by the FA approach. Only five items were grouped by both approaches [Table 1].
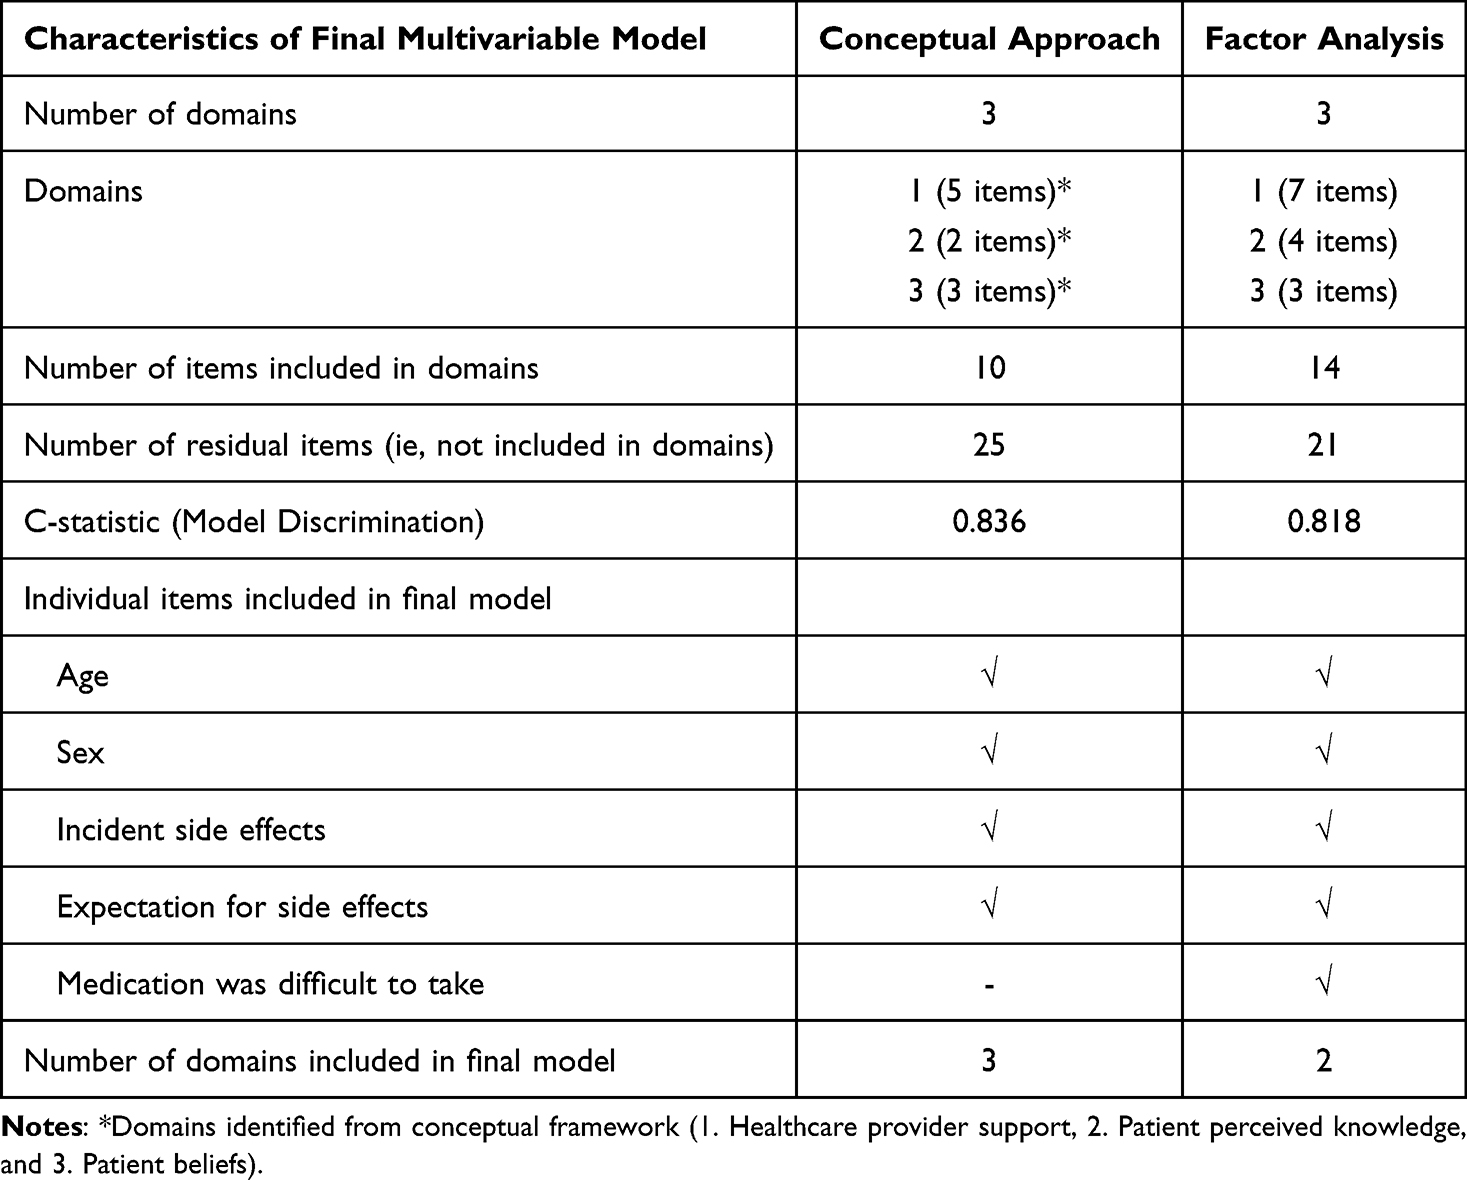 |
Table 1 Comparison of Two Models Predicting Non-Persistence Using Data Organized by a Conceptual Approach or Factor Analysis |
Domains created from the conceptual approach represented the following three themes: Healthcare Provider Support (HCPS), Patient Knowledge, and Patient Beliefs. Cronbach’s alpha scores were 0.80, 0.82, and 0.67, respectively. In contrast, one of the FA domains contained at least one item from all domains of the conceptual approach: two items representing “beliefs” (ie, “importance of medication for health” and “concern the medication will do more harm than good”), one item from “health care provider support” (ie, overall, you trust the doctor), and one item from knowledge (ie, you know what this medicine is used for). [Table 2] Model fit indices indicated good to moderate fit; the Adjusted Goodness of Fit Index (AGFI = 0.88), comparative fit index (CFI = 0.85), standardized root mean square residual (SRMR = 0.06), root mean square error of approximation (RMSEA = 0.09) and the chi-square statistic for the model was 2017.54 (df = 73, p < 0.0001). Cronbach’s alpha scores for the FA domains were 0.79, 0.66, and 0.53.
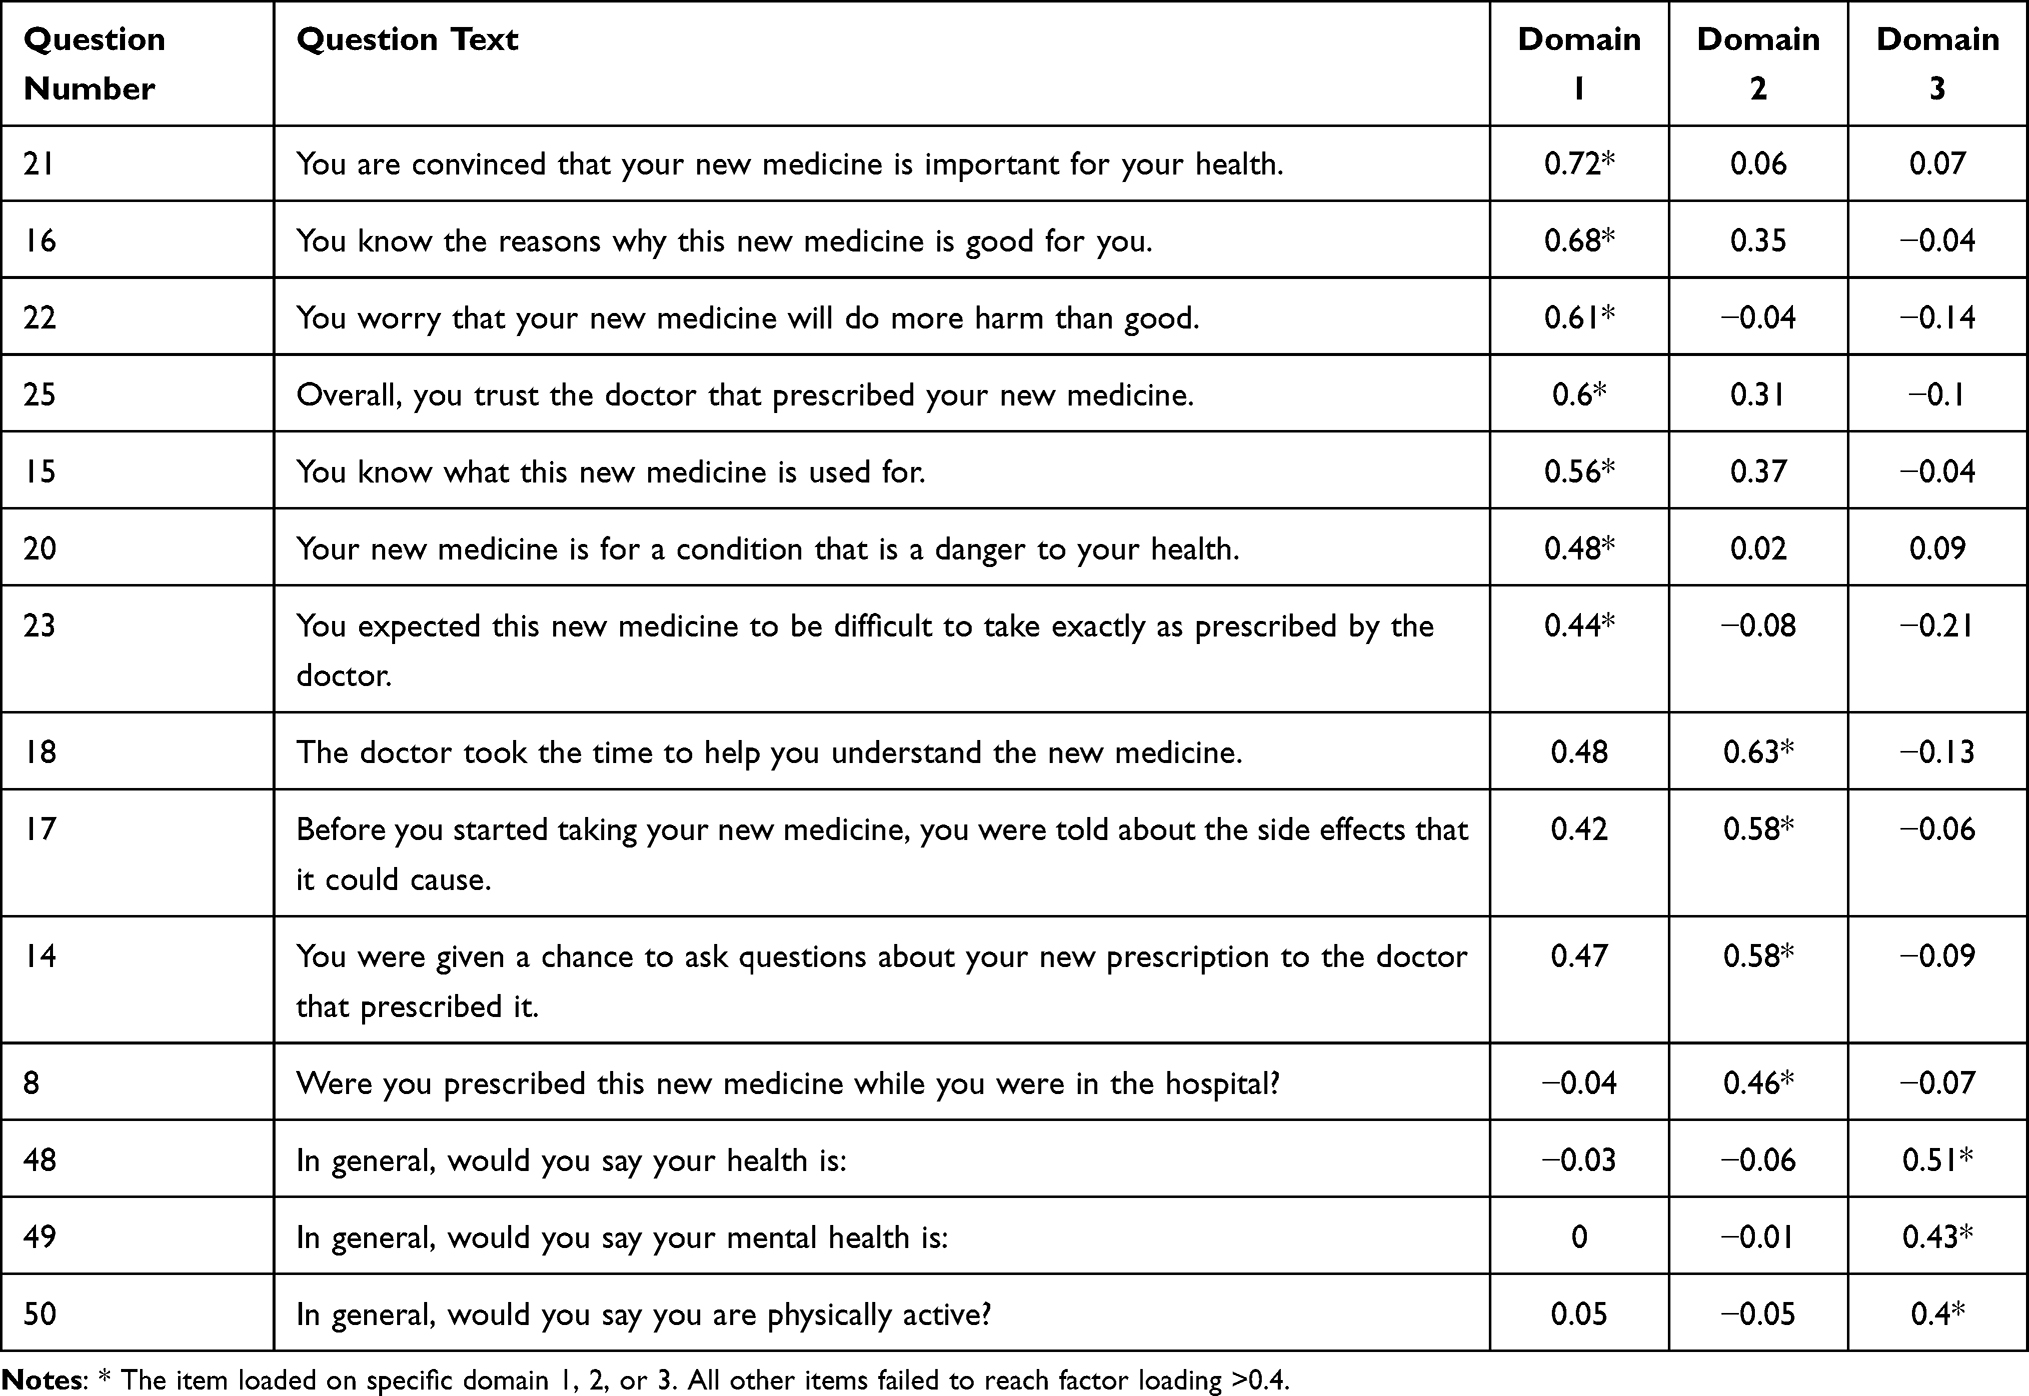 |
Table 2 Coefficient of Factor Loading, and Total Variance Explained in Principal Component Analysis |
All three domains from the conceptual approach met inclusion criteria for the final model whereas two (out of three) FA domains were included. Both approaches captured four of the same individual items: Age and sex (forced into both models), and two additional items: “Did you experience side effects from your new medicine?” and “You expected to get side effects from this new medicine before you started taking it”. Their associations with non-persistence were similar in both models, including a significant interaction between them. In addition, the FA model retained another item (You expected this new medicine to be difficult to take exactly as prescribed by the doctor’). However, this additional item was not associated with non-persistence after multivariable adjustment. Both models demonstrated good predictive performance with c-statistics of 0.84 (conceptual model) and 0.82 (FA model, p=0.060).
Discussion
We created two prediction models for non-persistence from the same survey dataset; one model contained covariates organized by a conceptual framework,1 while the other model contained covariates organized by FA.14 The conceptual approach categorized fewer items into domains, likely due to conceptual boundaries preventing some items from being tested together. However, more effective item reduction with FA is potentially counterproductive if the research goal is to produce a highly effective prediction model. In other words, more grouped variables mean fewer variables accounting for outcome variance. In addition, EFA produced groups of items (ie, domains) that did not align with our conceptual framework. This outcome was felt to be a critical limitation, given the widespread recognition of domains identified from previous medication adherence research.1
Surveys to assess risk factors for medication adherence continue to provide valuable knowledge to the field. Zhang and colleagues published a study examining risk factors for antihypertensive medication non-adherence among individuals living in Xinjiang, China.24 They identified 9 domains identified using EFA. Although the items contained in these domains crossed traditional categories of non-adherence determinants,1 the model explained a high percentage of variance and the risk factors identified corresponded to conventional knowledge. We conducted a very similar study in Saskatchewan, Canada. However, we followed a conceptual approach (rather than FA) to identify domains from our lengthy survey.15 The conceptual approach was critical for our study because we intended to test the construct of patient “beliefs” specifically; we could not “allow” EFA to mix other items within that domain. At the same time, we could not find any information to understand if the conceptual approach would negatively impact the performance of downstream modeling or the identification of individual risk factors. This preliminary study suggests model performance may not be negatively impacted. Also, the most powerful risk factors were identified by both approaches.
Several limitations of our study must be acknowledged. Replication of our study using other survey data would be needed to confirm if our observations are generalizable. Also, our prediction of non-persistence was based on a self-reported outcome; therefore, generalizability of the high discrimination remains to be proven with respect to real-world practice. Bias is inherent in self-reported survey data and poses challenges to accurately capturing participants’ true experiences and behaviors.25,26 Similarly, constructs such as beliefs and knowledge were measured using tools that lacked external validation. These limitations could impact the reliability, comparability, and generalizability of the findings. Also, our EFA procedure identified a domain with very low internal consistency (ie, Cronbach’s alpha of 0.53). It appears that conventional fit indices did not always produce domains with high internal consistency.27,28 Similarly, we allowed a domain with a Cronbach’s alpha <0.7 (ie, 0.67) using the conventional approach. Because the primary goal of this study was to compare methods rather than develop a validated tool, we chose to retain these domains to avoid losing potentially important information. It may be imperfect from a statistical standpoint but remains highly relevant to the outcome of non-persistence. Despite these limitations, both models produced c-statistic values above 0.8.
Conclusions
In the area of medication adherence, decades of research and clinical insights have helped to create theoretical paradigms such as the WHO framework.1,29,30 Organizing items within these pre-existing themes allows focused testing of hypotheses and can produce a strong prediction model. On the other hand, the FA process provides greater opportunity for item reduction, but that may limit prediction performance of downstream models.
Data Sharing Statement
The data underlying this study cannot be publicly shared due to confidentiality agreements with the Saskatchewan Ministry of Health and the terms outlined in participant consent.
Funding
The original survey study was funded from a peer reviewed research grant from the Canadian Institutes of Health Research (CIHR grant number 130343). CIHR had no role in the study design, collection, analysis, interpretation of data, writing of the report, or in the decision to submit the article for publication. In addition, all authors had full access to all data (including statistical reports and tables) in the study and can take responsibility for the integrity of the data and the accuracy of the data analysis. This study is based in part on de-identified data provided by the Saskatchewan Ministry of Health. The interpretation and conclusions contained herein do not necessarily represent those of the Government of Saskatchewan or the Saskatchewan Ministry of Health.
Disclosure
The authors report no conflicts of interest in this work.
References
1. World Health Organization. Adherence to Long-Term Therapies. Evidence for Action. Geneva: WHO; 2003.
2. Choudhry NK, Kronish IM, Vongpatanasin W, et al. Medication adherence and blood pressure control: a scientific statement from the American heart association. Hypertension. 2022;79(1):e1–6. doi:10.1161/HYP.0000000000000203
3. Horne R, Weinman J. Patients’ beliefs about prescribed medicines and their role in adherence to treatment in chronic physical illness. J Psychosomat Res. 1999;47(6):555–567. doi:10.1016/S0022-3999(99)00057-4
4. Martinson BC, Crain AL, Sherwood NE, Hayes MG, Pronk NP, O’Connor PJ. Population reach and recruitment bias in a maintenance RCT in physically active older adults. J Phys Activity Health. 2010;7(1):127–135. doi:10.1123/jpah.7.1.127
5. Ogedegbe G, Mancuso CA, Allegrante JP, Charlson ME. Development and evaluation of a medication adherence self-efficacy scale in hypertensive African-American patients. J Clin Epidemiol. 2003;56(6):520–529. doi:10.1016/S0895-4356(03)00053-2
6. Alsabbagh MW, Lix LM, Eurich D, Wilson TW, Blackburn DF. Multiple-domain versus single-domain measurements of socioeconomic status (SES) for predicting nonadherence to statin medications - An observational population-based cohort study. Medical Care. 2016;54(2):195–204. doi:10.1097/MLR.0000000000000468
7. Rejas J, Ruiz MA, Pardo A, Soto J. Minimally important difference of the treatment satisfaction with medicines questionnaire (SATMED-Q). BMC Med Res Methodol. 2011;11(1):142. doi:10.1186/1471-2288-11-142
8. Alefan Q, Yao S, Taylor JG, et al. Factors associated with early nonpersistence among patients experiencing side effects from a new medication. J Ame Pharmacis Assoc. 2022;62(3):717–726.e5. doi:10.1016/j.japh.2021.12.001
9. McGinnis B, Olson KL, Magid D, et al. Factors related to adherence to statin therapy. Research support, non-U.S. Gov’t. Ann Pharmacotherapy. 2007;41(11):1805–1811. doi:10.1345/aph.1K209
10. Hahn SR, Park J, Skinner EP, et al. Development of the ASK-20 adherence barrier survey. Research support, non-U.S. Gov’t validation studies. Curr Med Res Opin. 2008;24(7):2127–2138. doi:10.1185/03007990802174769
11. Simpson SH, Eurich DT, Majumdar SR, et al. A meta-analysis of the association between adherence to drug therapy and mortality. BMJ. 2006;333(7557):15. doi:10.1136/bmj.38875.675486.55
12. Lee SK, Kang B-Y, Kim H-G, Son Y-J. Predictors of medication adherence in elderly patients with chronic diseases using support vector machine models. Healthcare Informat Res. 2013;19(1):33–41. doi:10.4258/hir.2013.19.1.33
13. Al-Noumani H, Alharrasi M, Lazarus ER, Panchatcharam SM. Factors predicting medication adherence among Omani patients with chronic diseases through a multicenter cross-sectional study. Scientific Rep. 2023;13(1):7067. doi:10.1038/s41598-023-34393-4
14. Knekta E, Runyon C, Eddy S. One size doesn’t fit all: using factor analysis to gather validity evidence when using surveys in your research. CBE Life Sci Educ. 2019;18(1):rm1. doi:10.1187/cbe.18-04-0064
15. Blackburn DF, Yao S, Taylor JG, et al. Measuring the influence of side effect expectations, beliefs, and incident side effects on the risk for drug discontinuation among individuals starting new medications, a cross-sectional study. Patient Prefer Adher. 2024;18:979–989. doi:10.2147/PPA.S451012
16. Bland JM, Altman DG. Statistics notes: cronbach’s alpha: table 1. BMJ. 1997;314(7080):572. doi:10.1136/bmj.314.7080.572
17. Cronbach LJ. Coefficient alpha and the internal structure of tests. Psychometrika. 1951;16(3):297–334. doi:10.1007/BF02310555
18. Kyriazos TA. Applied psychometrics: sample size and sample power considerations in factor analysis (EFA, CFA) and SEM in general. Psychology. 2018;9(08):2207–2230. doi:10.4236/psych.2018.98126
19. Lorenzo-Seva U, Ferrando PJ. Determining sample size requirements in EFA solutions: a simple empirical proposal. Multivariate Behav Res. 2024;59(5):899–912. doi:10.1080/00273171.2024.2342324
20. Ismail K. Unravelling factor analysis. Evidence Based Mental Health. 2008;11(4):99–102. doi:10.1136/ebmh.11.4.99
21. Pencina MJ, D’Agostino RB, Steyerberg EW. Extensions of net reclassification improvement calculations to measure usefulness of new biomarkers. Stat Med. 2011;30(1):11–21. doi:10.1002/sim.4085
22. Pencina MJ, D’Agostino RB. Evaluating discrimination of risk prediction models. The C statistic. JAMA. 2015;314(10):1063–1064. doi:10.1001/jama.2015.11082
23. DeLong ER, DeLong DM, Clarke-Pearson DL. Comparing the areas under two or more correlated receiver operating characteristic curves: a nonparametric approach. Comment in: Acta Anaesthesiol Scand. 2016 Aug;60(7):1012-23. Biometrics. 1988;44(3):837–845. PMID: 27080141. doi:10.1111/aas.12728
24. Zhang Y, Li X, Mao L, et al. Factors affecting medication adherence in community-managed patients with hypertension based on the principal component analysis: evidence from Xinjiang, China. Patient Prefere Adher. 2018;12:803–812. doi:10.2147/PPA.S158662
25. Wu J-R, DeWalt DA, Baker DW, et al. A single-item self-report medication adherence question predicts hospitalisation and death in patients with heart failure. Journal of clinical nursing. 2014;23(17-18):2554-64. Based Nurs. 2015;18(4):123.
26. Nassar RI, Basheti IA, Saini B. Exploring validated self-reported instruments to assess adherence to medications used: a review comparing existing instruments. Patient Prefer Adher. 2022;16:503–513. doi:10.2147/PPA.S352161
27. Goretzko D, Siemund K, Sterner P. Evaluating model fit of measurement models in confirmatory factor analysis. Educ Psychologl Measure. 2024;84(1):123–144. doi:10.1177/00131644231163813
28. Cho EM, Kim EJ. Development and validation of the medication use competency scale for older adults. Res Gerontolog Nurs. 2025;18(3):154–164. doi:10.3928/19404921-20250320-01
29. McKay CD, Verhagen E, et al. Compliance’ versus ‘adherence’ in sport injury prevention: why definition matters. Br J Sports Med. 2016;50(7):382–383. doi:10.1136/bjsports-2015-095192
30. Horne R, Weinman J, Hankins M. The beliefs about medicines questionnaire: the development and evaluation of a new method for assessing the cognitive representation of medication. Psychology Health. 1999;14(1):1–24. doi:10.1080/08870449908407311
 © 2026 The Author(s). This work is published and licensed by Dove Medical Press Limited. The
full terms of this license are available at https://www.dovepress.com/terms
and incorporate the Creative Commons Attribution
- Non Commercial (unported, 4.0) License.
By accessing the work you hereby accept the Terms. Non-commercial uses of the work are permitted
without any further permission from Dove Medical Press Limited, provided the work is properly
attributed. For permission for commercial use of this work, please see paragraphs 4.2 and 5 of our Terms.
© 2026 The Author(s). This work is published and licensed by Dove Medical Press Limited. The
full terms of this license are available at https://www.dovepress.com/terms
and incorporate the Creative Commons Attribution
- Non Commercial (unported, 4.0) License.
By accessing the work you hereby accept the Terms. Non-commercial uses of the work are permitted
without any further permission from Dove Medical Press Limited, provided the work is properly
attributed. For permission for commercial use of this work, please see paragraphs 4.2 and 5 of our Terms.