Back to Journals » Clinical Interventions in Aging » Volume 15
Comparative Performance of Creatinine-Based GFR Estimation Equations in Exceptional Longevity: The Rugao Longevity and Ageing Study
Authors Wang M, Sun X, Ni L, Zhang M, Zhang J, Ye G, Jin L, Wang X, Chen J
Received 19 February 2020
Accepted for publication 4 April 2020
Published 26 May 2020 Volume 2020:15 Pages 733—742
DOI https://doi.org/10.2147/CIA.S250535
Checked for plagiarism Yes
Review by Single anonymous peer review
Peer reviewer comments 3
Editor who approved publication: Dr Zhi-Ying Wu
Mengjing Wang, 1, 2,* Xuehui Sun, 3,* Li Ni, 1 Minmin Zhang, 1 Jiaying Zhang, 4 Guoxin Ye, 1 Li Jin, 2, 3 Xiaofeng Wang, 2, 3 Jing Chen 1, 2
1Nephrology, Huashan Hospital, Fudan University, Shanghai, People’s Republic of China; 2National Clinical Research Center for Aging and Medicine, Huashan Hospital, Fudan University, Shanghai, People’s Republic of China; 3State Key Laboratory of Genetic Engineering and Ministry of Education Key Laboratory of Contemporary Anthropology, School of Life Sciences, Fudan University, Shanghai, People’s Republic of China; 4Nutrition, Huashan Hospital, Fudan University, Shanghai, People’s Republic of China
*These authors contributed equally to this work
Correspondence: Jing Chen; Xiaofeng Wang Email [email protected]; [email protected]
Purpose: Reduced kidney function has been associated with an increased risk for adverse outcomes. Accurate assessment of glomerular filtration rate (GFR) is key to diagnosis and management of kidney disfunction. Debate exists on the best GFR estimation equation for elderly people. This study aimed to compare the predictive validity and discriminative ability of four GFR equations in relation to 2-year and 6-year mortality in exceptional longevity (EL) (those over 95 years old with intact health) individuals and is an ideal model to address factors relating to life span and age-related diseases.
Patients and Methods: This study used 6 years’ data of 278 EL from the Rugao longevity cohort. Baseline GFR was estimated using four equations: Chronic Kidney Disease Epidemiology Collaboration (CKD-EPI) equation, Modification of Diet in Renal Disease Study (MDRD) equation, Berlin Initiative Study-1 (BIS) equation, and modified MDRD equation. Predictive validity was tested using Cox proportional hazards analysis. Overall improvement in reclassification based on estimated GFR (eGFR) was assessed applying net reclassification improvement (NRI).
Results: Mean age of participants was 97± 2 years with median follow-up of 2.6 years. Median (IQR) eGFR by CKD-EPI, MDRD, BIS, and modified MDRD equations were 73.9 (62.2– 77.6), 82.3 (67.4– 98.6), 56.4 (47.9– 63.9), and 101.5 (83.1– 121.6) mL/min per 1.73 m 2, respectively. Higher eGFREPI was associated with lower mortality after multivariate adjustment (for continuous eGFREPI, HRtwo-year 1.018, 95% CI 1.002– 1.033, P=0.023; HRsix-year 1.013, 95% CI 1.002– 1.025, P=0.022), while eGFR from other equations did not show any associations with mortality. NRI for two-year mortality was 0.14 and approximately significant, which may favor the CKD-EPI when compared to BIS equation (P=0.052).
Conclusion: The CKD-EPI equation showed more accurate estimation of kidney function in the elderly with respect to GFR distribution and predictability of mortality risk.
Keywords: glomerular filtration rate, kidney function, equation, exceptional longevity, mortality
Erratum for this paper has been published
Introduction
Over the past two decades, China’s population has been aging rapidly. The population aged over 80 years has reached 23 million.1 According to Centers for Disease Control and prevention (CDC) of the US, of those born in the year 2000, at least 15% of men and 20% of women are projected to reach the age of 90 years, presenting a major challenge for health care systems.2,3 Older adults suffer high rates of reduced kidney function which may occur as part of the normal ageing process or be related to comorbid disease.4,5 Glomerular filtration rate (GFR) is the best measure of kidney function. It is reported that 62.2% of those aged 80 and older had GFR < 60 mL/min/1.73 m2 in NHANES 1999–2002 surveys, and this prevalence of reduced GFR in the United States is still going to increase in future decades.6,7
Attention should be paid to GFR decrease in older individuals since reduced GFR has been associated with an increased risk for adverse outcomes including disability, cardiovascular disease (CVD), and mortality.8–12 Thus, accurate GFR assessment is key to the diagnosis and management of kidney disfunction. The real GFR can be directly measured by the clearance of exogenous filtration markers (eg, inulin and iohexol), however, due to inconvenience of this measurement, GFR is always estimated by a series of equations using serum creatinine which results in estimated GFR (eGFR). The eGFR in older patients is based on equations largely derived from young adults including Epidemiology Collaboration (CKD-EPI) equation and Modification of Diet in Renal Disease (MDRD) Study equation. There is a less frequently used Berlin Initiative Study (BIS) equation which was developed from older people, aged 70+ years.13–15 Until now, debate has continued with regards to which equation is superior in elderly individuals (mostly 70 to 85 years old) based on comparison with gold standard measurements or based on mortality prediction.16–19 The underlying reason for diverse results may be related to the population they used, either people admitted to hospital or the elderly in the community with different comorbidities.
Exceptional longevity refers to those who survive to an advanced old age (EL, 95 years old and over) with intact health or function. EL is an ideal model to address factors that are related to life span and age-related diseases and, therefore, targeted prevention and health promotion.20 Thus in this study, we aimed to screen the best GFR estimation equation for the elderly by comparing the predictive validity and discriminative ability of four commonly used and creatinine-based equations: the CKD-EPI equation, the MDRD study equation, the BIS equation, and the modified MDRD equation in relation to short-term (two-year) and long-term (six-year) mortality using data from a prospective cohort of community-dwelling EL people and to further investigate the distribution of GFR in these individuals with healthy aging.20,21
Materials and Methods
Study Population
We extracted, refined, and examined data from 278 long-lived individuals enrolled in the Rugao longevity cohort, a population-based prospective study conducted between December 2007 and February 2008 in Rugao city of Jiangsu Province in China. Individuals in this study were followed through April, 2014.20 Details regarding the cohort are provided elsewhere.20 Briefly, after strict four-step age verifications, 705 persons aged over 95 years (149 men and 556 women) including 102 centenarians, were identified in Rugao city. Of them, 463 (103 men and 360 women) participants were recruited, with a response rate of 65.7%. No significant difference in age and gender was found between non-responders and responders according to a previous study of Rugao longevity cohort.22 Of the 463 individuals, we excluded 177 individuals who had missing baseline data on serum creatinine; 7 individuals who were lost to follow-up, and 1 who was diagnosed with cancer during recruitment of the cohort (Supplementary Figure S1). Our final study population consisted of 278 EL individuals. This study was approved by the Human Ethnics Committee of the School of Life Sciences of Fudan University, Shanghai, China. The ID number of the approval was 278. Written informed consent was obtained from each participant or a member of his or her immediate family prior to participation.
Demographic, Clinical, and Laboratory Measures
A structured questionnaire was administered by trained field staff that delved into areas including demographic characteristics, histories of chronic disease (eg, cardiovascular disease, cerebrovascular disease, hypertension, chronic obstructive pulmonary disease, malignancy), functional status (measured by activities of daily living (ADL)), and medications. Physical examinations were also performed by the trained staff. All interviews were tape-recorded, and 5% of the recorded interviews were evaluated for interviewing quality.20
The Katz Index, which was based on six daily tasks: eating, dressing, bathing, indoor transferring, going to the toilet and cleaning oneself afterwards, was used to assess ADL in this study.23 Each task has the following three response alternatives: strongly independent, somewhat dependent, and strongly dependent, with a score of 1, 2, and 3 points, respectively. Lower scores indicated better functional status. Based on the total summed scores, a nominal variable with three categories of functional disability, “none” (total score=6), “moderate” (total score=7–9), “severe” (total score ≥ 10), was constructed.24
Fasting blood samples were drawn using uniform techniques for laboratory examination at recruitment for the study. All laboratory values were measured using Olympus AU5811 clinical chemistry analyzer (Tokyo, Japan) with standard laboratory techniques (performed by a technician in the biochemistry laboratory of Jiangsu Rugao Hospital of Traditional Chinese Medicine).
Outcome Assessment
Dates of death were obtained through the Bureau of Civil Affairs of Rugao. Survival time (in months) was calculated from February 2008 to the date of death or of censoring on April 2014. The Bureau of Civil Affairs in Rugao is responsible for providing pensions for persons aged 80 years or over every month. The penalty for any family trying to conceal the death of an elderly family member is high.
Estimation of GFR
Serum creatinine concentration was measured according to an enzymatic method with the Cica Creatinine reagent (KANTO Chemical, Tokyo, Japan) and Hitachi 7600 analyzer (Hitachi, Tokyo, Japan). We calculated eGFR using the following 4 equations:
- eGFRMDRD=175 × (serum creatinine [mg/dL])−1.154 × age−0.203 × (0.742 if female)25,26
- eGFREPI =144 × (serum creatinine [mg/dL]/0.7)−0.329 × (0.993)Age if female and serum creatinine ≤0.7) or eGFREPI =144 × (serum creatinine [mg/dL]/0.7)−1.209 × (0.993)Age if female and serum creatinine >0.7) or eGFREPI =141 × (serum creatinine [mg/dL]/0.9)−0.411 × (0.993)Age if male and serum creatinine ≤0.9) or eGFREPI =141 × (serum creatinine [mg/dL]/0.9)−1.209 × (0.993)Age if male and serum creatinine >0.9)14
- eGFRBIS =3736 × (serum creatinine [mg/dL])−0.87 × age−0.95 × (0.82 if female)15
- eGFRmodified MDRD =175 × (serum creatinine [mg/dL])−1.154 × age−0.203 × (0.742 if female) × (1.233 if Chinese).21 We changed the coefficient of 186 to 175 based on the calibration factor used to adjust non-standardized MDRD study samples to isotope dilution mass spectrometry (IDMS).25
Statistical Analyses
Continuous variables of patients’ characteristics were expressed as mean ± standard deviation (SD), and categorical variables were expressed as percentages or ratios. eGFR was treated as continuous or categorical variables with the cut-off value at 40, 60, and 80 mL/min/1.73 m2 according to the distribution of eGFR in longevity cohort. The association of eGFR with all-cause mortality was examined by fully adjusted Cox proportional hazard models. We also examined potential non-linear relationships by using restricted cubic spline functions with four knots at the 5th, 35th, 65th, 95th percentile of each index and the reference for eGFR was 80 mL/min/1.73 m2. The fully adjusted model included age, gender, marital status, education, smoking, ADL, body mass index (BMI), hypertension, cardiovascular disease, cerebrovascular disease, chronic obstructive pulmonary disease, systolic blood pressure, serum albumin, and serum low-density lipoprotein cholesterol (LDL-C).
To assess reclassification, we created a 4 × 4 cross-tabulation of the eGFREPI and the eGFRMDRD or eGFRBIS or eGFRmodified MDRD categories, calculated the proportion of participants reclassified by eGFREPI in each category of eGFRMDRD or eGFRBIS or eGFRmodified MDRD, and assessed whether risk of death differed between participants reclassified and those not reclassified. Overall improvement in reclassification based on clinical eGFREPI categories was assessed applying net reclassification improvement,27,28 which was calculated as follows:
Net reclassification improvement (NRI) = clinically correct reclassification (proportion of participants reclassified upward among those who died + proportion of participants reclassified downward among those who survived) - clinically incorrect reclassification (proportion of participants reclassified upward among those who survived + proportion of participants reclassified downward among those who died)
Differences in baseline characteristics between included versus excluded patients were compared by Student’s t-test or X2 test. The frequency of missing data was low [<1], and multiple imputation methods with five data-sets were used in all regression analyses (Supplementary Table S10). Analyses were conducted using STATA MP version 13.1 (StataCorp, College Station, TX).
Results
Characteristics of the Study Population
Table 1 shows the demographic and clinical characteristics of participants. The mean±SD age was 97±2 years. The mean±SD BMI was 21.6±4.1 kg/m2. The participants were more likely to be women (77%), widowed (94%), and illiterate (81%). Mean serum baseline hemoglobin, albumin, and creatinine levels were 127.1±21.0 g/dL, 41.0±3.8 mg/dL, and 65.6±19.8 µmol/L, respectively (Table 1). A total of 256 (92%) participants died during the median follow-up of 2.6 years (IQR, 1.2–4.1 years) with an incidence of 33 deaths per 100 person-years.
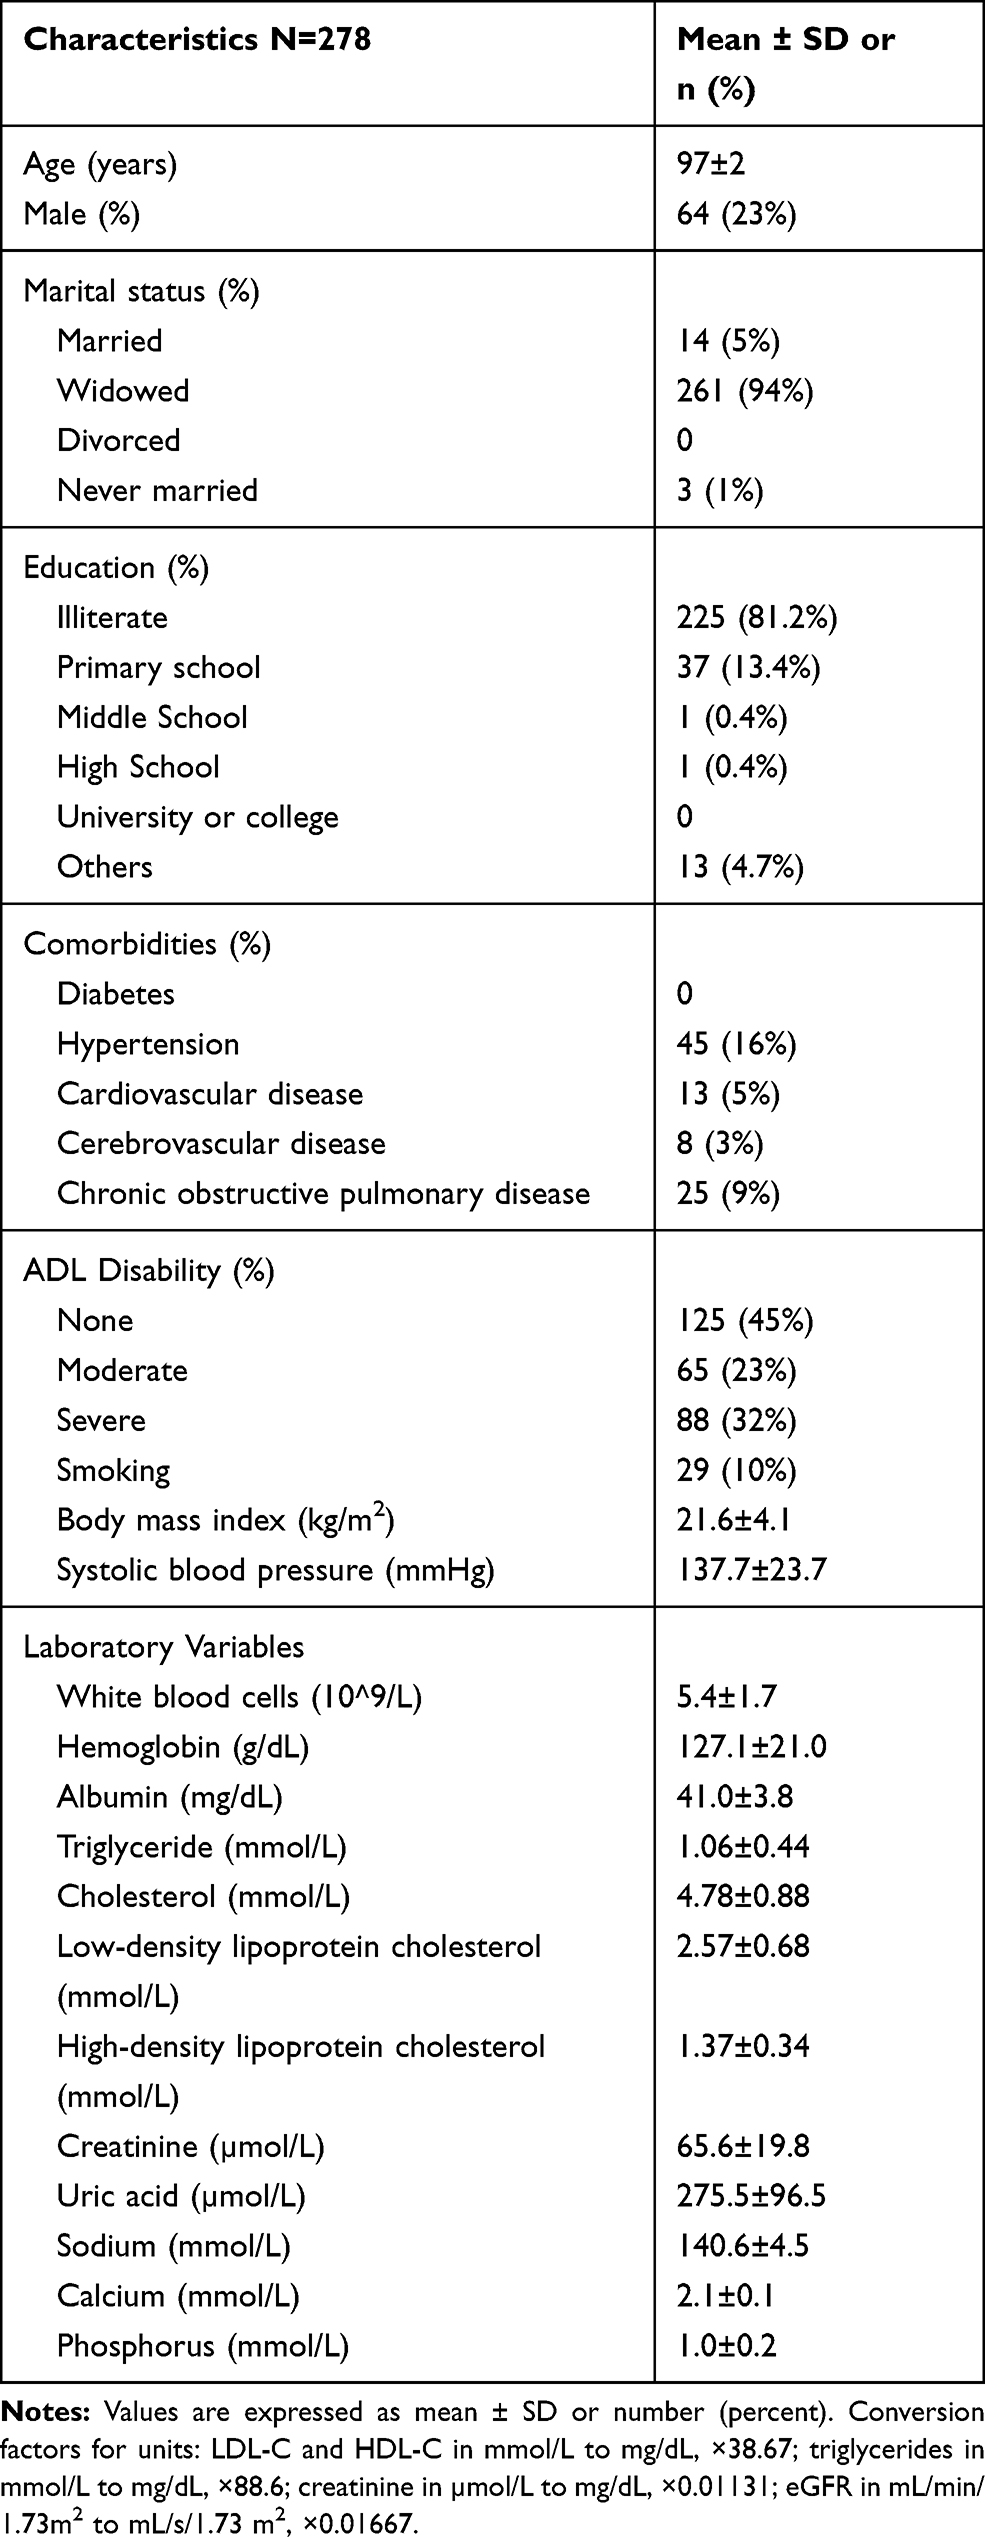 |
Table 1 Baseline Characteristics of the Rugao Longevity Population |
Compared to 185 excluded persons who lacked data on serum creatinine, 278 included persons were more likely to smoke, had lower albumin, and had higher LDL-C and calcium (Supplementary Table S1).
Distribution of eGFR by CKD-EPI Equation, MDRD Study Equation, BIS Equation, and Modified MDRD Equation
Median (IQR) eGFR by CKD-EPI, MDRD study, BIS equation, and modified MDRD equations were 73.9 (62.2–77.6), 82.3 (67.4–98.6), 56.4 (47.9–63.9), and 101.5 (83.1–121.6) mL/min per 1.73m2, respectively. The distribution of eGFREPI and eGFRBIS were more concentrated and on the left side of the axis, while the distribution of eGFRMDRD and eGFRmodified-MDRD were more dispersed and on the right side (Figure 1). The prevalence of chronic kidney disease (CKD) stage 3–5 (defined as eGFR < 60 mL/min/1.73 m2) at baseline were 23%, 16%, 63% and 4% by CKD-EPI equation, MDRD equation, BIS equation, and modified MDRD equation, respectively. High discrepancy of eGFR by 4 equations was seen after GFR of approximate 80 mL/min/1.73 m2 where much higher GFR values were obtained by MDRD and modified MDRD equations compared to CKD-EPI and BIS equations (Supplementary Figure S2).
 |
Figure 1 Kernel density estimates of eGFR by four equations in Rugao longevity population. |
Prognostic Value of eGFREPI, eGFRMDRD, eGFRBIS, and eGFRmodified-MDRD for Short-Term and Long-Term Mortality
Figure 2 shows the Kaplan–Meier curve for overall six-year survival of groups with eGFR higher or less than 60 mL/min/1.73 m2. Those with eGFREPI higher than 60 mL/min/1.73 m2 had a statistically significant higher survival rate compared to those with eGFREPI less than 60 mL/min/1.73 m2 (P=0.02 for CKD-EPI equation) (Figure 2). After adjusting for case-mix and laboratory variables, reduced eGFREPI was significantly associated with two-year and six-year mortality (for continuous eGFREPI, two-year estimates: HR 1.018, 95% CI 1.002–1.033, P=0.02; six-year estimates: HR 1.013, 95% CI 1.002–1.025, P=0.02); however, GFR estimated by three other equations did not show any significant association with all-cause mortality (Tables 2 and 3, Supplementary Table S8, S9). Models using spline functions yielded consistent results in which a trend toward lower mortality risk across higher eGFR was observed when GFR was estimated by CKD-EPI equation (Figures 3 and 4). Cox regression analysis was also carried out by considering eGFR > 60 mL/min/1.73 m2 as a reference category, and it showed that reduced kidney function (eGFR < 60 mL/min/1.73 m2) estimated by only CKD-EPI was significantly associated with increased two-year and six-year mortality (Tables 2 and 3).
 |
Table 2 Adjusted Hazard Ratio (95% CI) for Short-Term (Two-Year), All-Cause Mortality According to Estimated GFR (eGFR) Determined by CKD-EPI or MDRD or BIS or Modified MDRD Equations |
 |
Table 3 Adjusted Hazard Ratio (95% CI) for Long-Term (Six-Year), All-Cause Mortality According to eGFR Determined by CKD-EPI or MDRD or BIS or Modified MDRD Equations |
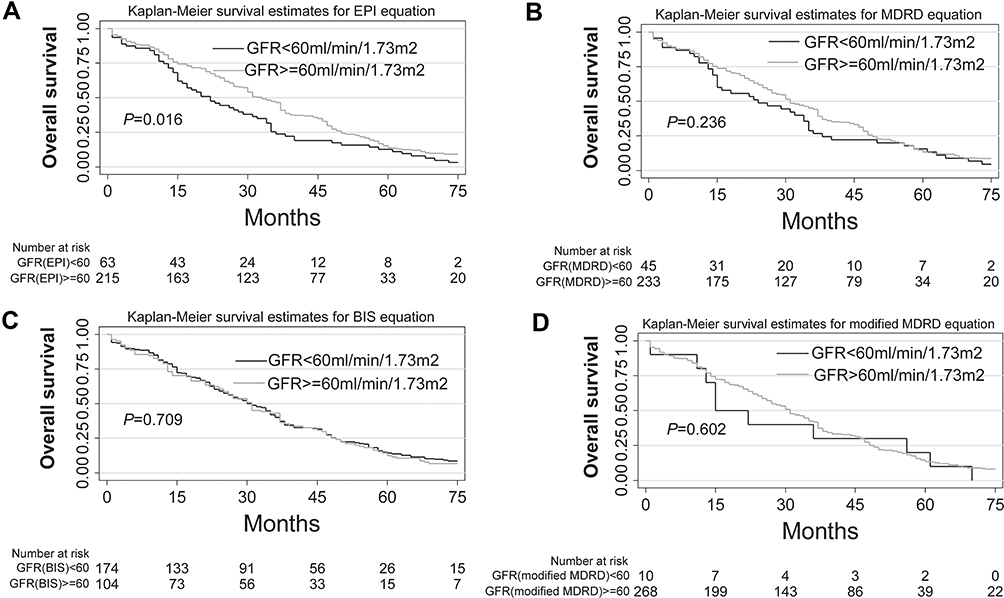 |
Figure 2 Kaplan–Meier survival estimates and 95% confidence intervals for long term by GFR level using CKD-EPI (A), MDRD (B), BIS (C), and modified MDRD (D) equations. |
 |
Figure 3 Association of eGFR with short-term (2-year), all-cause mortality in fully adjusted model using splines in Rugao longevity population with GFR estimated by (A) CKD-EPI equation, (B) MDRD equation, (C) BIS equation, (D) modified MDRD equation. |
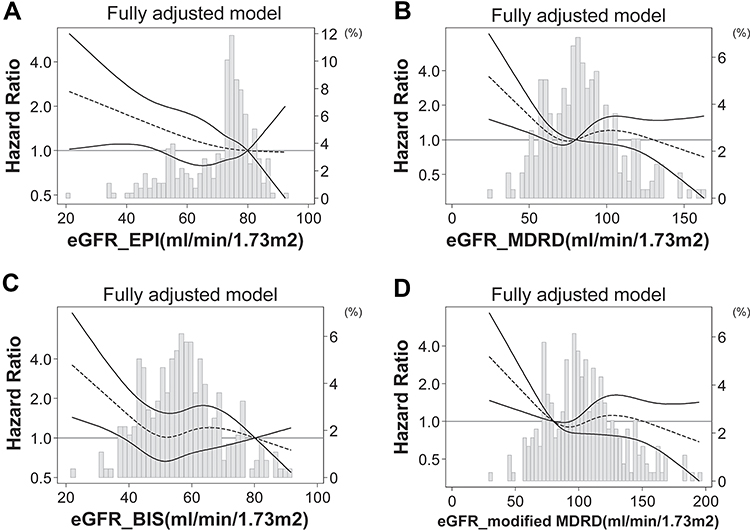 |
Figure 4 Association of eGFR with long-term (6-year), all-cause mortality in fully adjusted model using splines in Rugao longevity population with GFR estimated by (A) CKD-EPI equation, (B) MDRD equation, (C) BIS equation, (D) modified MDRD equation. |
Net Reclassification Improvement
The detailed table for calculating net reclassification improvement for death based on eGFR categories is shown in Supplementary Table S2–S7. During the two-year follow-up, 61% (n=101) of 166 participants who did not die were reclassified correctly to a lower risk (higher eGFR) category by CKD-EPI equation compared to BIS equation. On the other hand, among 112 participants who died during follow-up, 46% (n=52) were reclassified incorrectly to a lower risk (higher eGFR) group by CKD-EPI equation (Supplementary Table S2). In sum, net reclassification improvement for death by the CKD-EPI equation compared to BIS equation was 0.14 (P=0.05). Results were obtained when comparing CKD-EPI equation with MDRD equation or modified MDRD equation (EPI vs MDRD, NRI=0.05, P=0.3; EPI vs modified MDRD, NRI=0.002, P=0.5) (Supplementary Table S3–S4). The NRI were 0.14 (P=0.4), −0.02 (P=0.5), and −0.05 (P=0.5) when comparing CKD-EPI equation with BIS, MDRD, and modified MDRD equation using the six-year follow-up data (Supplementary Table S5–S7).
Discussion
Overall, our results suggest that it might be more appropriate to use the CKD-EPI equation when estimating GFR level in an elderly population according to its predictive validity and discriminative ability in relation to short-term and long-term mortality risk, in comparison to MDRD, BIS, and revised MDRD equation. Accordingly, ageing kidneys result in a decreased GFR with an average of 74 mL/min/1.73 m2 for extremely longevous population aged over 95 years according to CKD-EPI equation, and intervention of reducing GFR decrease may still be necessary for improving survival. Though not all NRI results support better overall reclassification by the CKD-EPI equation, a larger sample size may be needed to further test our hypothesis.
It is well-known that kidney function has a physiological decline in individuals without comorbid conditions and without intrinsic renal disease or proteinuria. The magnitude of this decline has been reported as an average of 0.75 mL/min per year.29 Comparing against previous studies which showed GFR by gold standard method in older individuals,17,18,30 the estimated value of GFR from modified MDRD appeared less reasonable. This may be attributed to the developing process of the equation by adding a racial factor based on the MDRD equation in a cohort of younger CKD patients. In studies that evaluated accuracy of estimated GFR by equations with measured GFR in an older population, overestimation of GFR was often reported for MDRD and CKD-EPI equations, with the bias of MDRD being slightly higher than those observed in the CKD-EPI equation,15,18,30,31 especially at higher GFRs.15,32 In contrast, underestimation of GFR was reported for BIS equation.16–18 These were in accordance with the current study which showed GFR estimated by MDRD was higher than CKD-EPI and BIS equation, and greater discrepancy of eGFR was seen after eGFR of approximate 80 mL/min/1.73 m2 where MDRD and modified MDRD equations resulted in much higher eGFR than CKD-EPI and BIS equations. The CKD-EPI equation includes two parts according to serum creatinine level which might avoid the resultant very high GFR in case of very low creatinine. This was especially important in older adults whose muscle mass may reduce dramatically.14,33 Besides, The MDRD equation was developed in CKD patients (mean GFR, 40 mL/min/1.73 m2; mean age, 50.6),13 the external validation in older individuals might not perform as well as CKD-EPI equation which was developed in a broader cohort with better kidney function (68 mL/min/1.73 m2) and BIS equation which was developed predominantly in cohorts of older people.14,15
To our knowledge, this is the first study which compared the ability of different eGFR equations to predict short-term and long-term mortality in EL populations. Actually, CKD-EPI equation had already been shown to have improved risk prediction compared to MDRD equation in a large community-based, middle-aged population.27,34 Though debate exists around older populations, in some studies, they found creatinine-based BIS and MDRD equation was not superior to creatinine-based CKD-EPI equation for predicting all-cause mortality.34–36 Here we demonstrated that CKD-EPI was the only equation with ability of predicting mortality among EL populations when using Cox regression method. The assumption is that the mortality risk predicted by eGFR is based upon the impact on death by measured renal function. GFR estimated by CKD-EPI equation might be closer to measured renal function by gold standard method. It is more stable and less biased since the cohorts used to develop the CKD-EPI equation were larger, more racially diverse and with broader range of age.14 Though BIS equation was developed from European elderly population, the single race draws into question BIS’ accuracy in Asian people with different muscle compositions and dietary habits. Besides, the BIS equation tended to estimate GFR lower than other equations. This helped to reclassify those who died to more advanced GFR categories, but may have, to a larger extent, inappropriately reclassified those who survived to more advanced GFR categories, giving less accurate outcome predictions.37 Thus, we also found that the NRI of CKD-EPI compared with BIS was positive and with marginal significance. The persistent predictive value of reduced eGFREPI in short-term and long-term follow-up highlights the strengths of baseline renal function estimated by CKD-EPI equation as an important factor in risk-stratifying EL population. Since EL is an ideal model of healthy aging without various comorbidities that interfere with the association of GFR and mortality, we believe CKD-EPI equation is superior to other equations for categorizing the risk for mortality in elderly population.
The mean GFR of the current study population estimated by BIS, CKD-EPI or MDRD equations was 5 to 10 mL/min/1.73 m2 higher than the averages reported in previous studies for older people,6,16,38-43 perhaps due to survival bias in our exceptional longevity setting.29 People with severe disease are more likely to die earlier. This phenomenon of compressed morbidity in centenarians compared to younger referent individuals was also seen in both the New England Centenarian Study (NECS) and Longevity Genes Project (LGP) cohorts.44 More than 80% of the EL individuals had delayed or escaped most lethal diseases of the elderly population including heart disease, non-skin cancer, and stroke.45 Thus, we speculated that the decrease of GFR in the current cohort was mostly due to physiological change. According to the low morbidity of EL individuals, the declining rate of GFR in healthy ageing, the accuracy of GFR estimated by CKD-EPI demonstrated in previous studies, and the conclusion, we found that GFR estimated by CKD-EPI was the predictor of mortality; the range of eGFR (IQR 62.2–77.6 mL/min/1.73 m2) by CKD-EPI equation might be a reference of successful aging kidney function of EL population. Besides, intervention may not be needed if estimated GFRs are above or near this range. However, future studies are needed to further verify these findings.
One of the strengths of the present study is the inclusion of a large community cohort of EL population followed prospectively over 6 years. To control for potential confounding factors, results were adjusted for the main clinical conditions of elderly population associated with mortality. Moreover, we revealed again that the age-adapted CKD definition should be changed to people without evidence of kidney injury, especially for elderly people with healthy ageing. Some limitations of the present study should be mentioned. First, creatinine-based equation might affect accurate GFR estimation in EL individuals who suffer from sarcopenia. However, mean BMI was 21.6±4.1 kg/m2 in our study which is very similar to the reported BMI of elderly adults from Chinese community.46 We speculate that few participants suffered from sarcopenia. Second, the creatinine measured in the current study was measured using enzymatic method with the Cica Creatinine reagent and Hitachi 7600 analyzer which was not calibrated to the recognized Roche enzymatic method. Finally, proteinuria was not measured at baseline. Thus, we could not evaluate eGFR and proteinuria simultaneously along with other factors for the most accurate risk prediction.
Conclusion
In conclusion, GFR decreased in EL population with an average of 74 mL/min/1.73 m2 by CKD-EPI equation. The CKD-EPI equation showed more accurate estimation of GFR in EL individuals with respect to predictability of mortality risk compared to the other equations, indicating greater clinical utility among older population in China.
Data Sharing Statement
Data were obtained by the staff and participants of the Rugao Longevity Cohort. Prof Xiaofeng Wang, one of our corresponding authors, would need to be emailed for available data.
Ethics Approval and Informed Consent
This study was approved by the Human Ethnics Committee of the School of Life Sciences of Fudan University, Shanghai, China. Written informed consent was obtained from each participant or a member of his or her immediate family prior to participation.
Acknowledgments
We thank the staff and participants of the Rugao Longevity Cohort for providing the clinical data for this research.
Author Contributions
All authors made substantial contributions to conception and design, acquisition of data, or analysis and interpretation of data; took part in drafting the article or revising it critically for important intellectual content; gave final approval of the version to be published; and agree to be accountable for all aspects of the work.
Disclosure
The authors declare that they have no conflict of interest.
References
1. Department of Economic and Social Affairs PD, United Nations. World Population Ageing. 2015.
2. Arias E. United States life tables, 2000. Natl Vital Stat Rep. 2002;51(3):1–38.
3. Newman AB, Murabito JM. The epidemiology of longevity and exceptional survival. Epidemiol Rev. 2013;35(1):181–197. doi:10.1093/epirev/mxs013
4. Fox CS, Larson MG, Leip EP, Culleton B, Wilson PW, Levy D. Predictors of new-onset kidney disease in a community-based population. JAMA. 2004;291(7):844–850. doi:10.1001/jama.291.7.844
5. Stevens LA, Viswanathan G, Weiner DE. Chronic kidney disease and end-stage renal disease in the elderly population: current prevalence, future projections, and clinical significance. Adv Chronic Kidney Dis. 2010;17(4):293–301. doi:10.1053/j.ackd.2010.03.010
6. Grams ME, Juraschek SP, Selvin E, et al. Trends in the prevalence of reduced GFR in the United States: a comparison of creatinine- and cystatin C-based estimates. Am J Kidney Dis. 2013;62(2):253–260. doi:10.1053/j.ajkd.2013.03.013
7. Hoerger TJ, Simpson SA, Yarnoff BO, et al. The future burden of CKD in the United States: a simulation model for the CDC CKD initiative. Am J Kidney Dis. 2015;65(3):403–411. doi:10.1053/j.ajkd.2014.09.023
8. Lattanzio F, Corsonello A, Abbatecola AM, et al. Relationship between renal function and physical performance in elderly hospitalized patients. Rejuvenation Res. 2012;15(6):545–552. doi:10.1089/rej.2012.1329
9. Pedone C, Corsonello A, Bandinelli S, Pizzarelli F, Ferrucci L, Incalzi RA. Relationship between renal function and functional decline: role of the estimating equation. J Am Med Dir Assoc. 2012;13(1):84e11–84. doi:10.1016/j.jamda.2011.01.009
10. Matsushita K, van der Velde M, et al.; Chronic Kidney Disease Prognosis C. Association of estimated glomerular filtration rate and albuminuria with all-cause and cardiovascular mortality in general population cohorts: a collaborative meta-analysis. Lancet. 2010;375(9731):2073–2081.
11. Tonelli M, Wiebe N, Culleton B, et al. Chronic kidney disease and mortality risk: a systematic review. J Am Soc Nephrol. 2006;17(7):2034–2047. doi:10.1681/ASN.2005101085
12. O’Hare AM, Bertenthal D, Covinsky KE, et al. Mortality risk stratification in chronic kidney disease: one size for all ages? J Am Soc Nephrol. 2006;17(3):846–853. doi:10.1681/ASN.2005090986
13. Levey AS, Bosch JP, Lewis JB, Greene T, Rogers N, Roth D. A more accurate method to estimate glomerular filtration rate from serum creatinine: a new prediction equation. Modification of diet in renal disease study group. Ann Intern Med. 1999;130(6):461–470. doi:10.7326/0003-4819-130-6-199903160-00002
14. Levey AS, Stevens LA, Schmid CH, et al. A new equation to estimate glomerular filtration rate. Ann Intern Med. 2009;150(9):604–612. doi:10.7326/0003-4819-150-9-200905050-00006
15. Schaeffner ES, Ebert N, Delanaye P, et al. Two novel equations to estimate kidney function in persons aged 70 years or older. Ann Intern Med. 2012;157(7):471–481. doi:10.7326/0003-4819-157-7-201210020-00003
16. Fan L, Levey AS, Gudnason V, et al. Comparing GFR estimating equations using cystatin c and creatinine in elderly individuals. J Am Soc Nephrol. 2015;26(8):1982–1989. doi:10.1681/ASN.2014060607
17. Vidal-Petiot E, Haymann JP, Letavernier E, et al. External validation of the BIS (Berlin initiative study)-1 GFR estimating equation in the elderly. Am J Kidney Dis. 2014;63(5):865–867. doi:10.1053/j.ajkd.2014.01.421
18. Lopes MB, Araujo LQ, Passos MT, et al. Estimation of glomerular filtration rate from serum creatinine and cystatin C in octogenarians and nonagenarians. BMC Nephrol. 2013;14(1):265. doi:10.1186/1471-2369-14-265
19. Koppe L, Klich A, Dubourg L, Ecochard R, Hadj-Aissa A. Performance of creatinine-based equations compared in older patients. J Nephrol. 2013;26(4):716–723. doi:10.5301/jn.5000297
20. Cai XY, Wang XF, Li SL, et al. Association of mitochondrial DNA haplogroups with exceptional longevity in a Chinese population. PLoS One. 2009;4(7):e6423. doi:10.1371/journal.pone.0006423
21. Ma YC, Zuo L, Chen JH, et al. Modified glomerular filtration rate estimating equation for Chinese patients with chronic kidney disease. J Am Soc Nephrol. 2006;17(10):2937–2944. doi:10.1681/ASN.2006040368
22. Liu Z, Zhong G, Li S, et al. Use of serum albumin and activities of daily living to predict mortality in long-lived individuals over 95 years of age: a population-based study. Age (Dordr). 2015;37(4):9809. doi:10.1007/s11357-015-9809-6
23. Katz S, Ford AB, Moskowitz RW, Jackson BA, Jaffe MW. Studies of illness in the aged. the index of Adl: a standardized measure of biological and psychosocial function. JAMA. 1963;185(12):914–919. doi:10.1001/jama.1963.03060120024016
24. Liu Z, Wang Y, Huang J, et al. Blood biomarkers and functional disability among extremely longevous individuals: a population-based study. J Gerontol a Biol Sci Med Sci. 2015;70(5):623–627. doi:10.1093/gerona/glu229
25. Levey AS, Coresh J, Greene T, et al. Expressing the modification of diet in renal disease study equation for estimating glomerular filtration rate with standardized serum creatinine values. Clin Chem. 2007;53(4):766–772. doi:10.1373/clinchem.2006.077180
26. Levey ASGT, Kusek J, Beck G. A simplified equation to predict glomerular filtration rate from serum creatinine [Abstract]. J Am Soc Nephrol. 2000;11:155A.
27. Matsushita K, Selvin E, Bash LD, Astor BC, Coresh J. Risk implications of the new CKD epidemiology collaboration (CKD-EPI) equation compared with the MDRD study equation for estimated GFR: the Atherosclerosis Risk in Communities (ARIC) study. Am J Kidney Dis. 2010;55(4):648–659. doi:10.1053/j.ajkd.2009.12.016
28. Pencina MJ, D’Agostino RB
29. Lindeman RD, Tobin J, Shock NW. Longitudinal studies on the rate of decline in renal function with age. J Am Geriatr Soc. 1985;33(4):278–285. doi:10.1111/j.1532-5415.1985.tb07117.x
30. Kilbride HS, Stevens PE, Eaglestone G, et al. Accuracy of the MDRD (Modification of Diet in Renal Disease) study and CKD-EPI (CKD Epidemiology Collaboration) equations for estimation of GFR in the elderly. Am J Kidney Dis. 2013;61(1):57–66. doi:10.1053/j.ajkd.2012.06.016
31. Murata K, Baumann NA, Saenger AK, Larson TS, Rule AD, Lieske JC. Relative performance of the MDRD and CKD-EPI equations for estimating glomerular filtration rate among patients with varied clinical presentations. Clin J Am Soc Nephrol. 2011;6(8):1963–1972. doi:10.2215/CJN.02300311
32. Stevens LA, Schmid CH, Greene T, et al. Comparative performance of the CKD Epidemiology Collaboration (CKD-EPI) and the Modification of Diet in Renal Disease (MDRD) study equations for estimating GFR levels above 60 mL/min/1.73 m2. Am J Kidney Dis. 2010;56(3):486–495. doi:10.1053/j.ajkd.2010.03.026
33. Palus S, Springer JI, Doehner W, et al. Models of sarcopenia: short review. Int J Cardiol. 2017;238:19–21. doi:10.1016/j.ijcard.2017.03.152
34. Matsushita K, Mahmoodi BK, Woodward M, et al. Comparison of risk prediction using the CKD-EPI equation and the MDRD study equation for estimated glomerular filtration rate. JAMA. 2012;307(18):1941–1951. doi:10.1001/jama.2012.3954
35. Canales MT, Blackwell T, Ishani A, et al. Renal function and death in older women: which eGFR formula should we use? Int J Nephrol. 2017;2017:8216878. doi:10.1155/2017/8216878
36. Losito A, Zampi I, Pittavini L, Zampi E. Association of reduced kidney function with cardiovascular disease and mortality in elderly patients: comparison between the new Berlin initiative study (BIS1) and the MDRD study equations. J Nephrol. 2017;30(1):81–86. doi:10.1007/s40620-015-0244-7
37. Emrich IE, Pickering JW, Schottker B, et al. Comparison of the performance of 2 GFR estimating equations using creatinine and cystatin C to predict adverse outcomes in elderly individuals. Am J Kidney Dis. 2015;65(4):636–638. doi:10.1053/j.ajkd.2014.12.006
38. Mandelli S, Riva E, Tettamanti M, Detoma P, Giacomin A, Lucca U. Mortality prediction in the oldest old with five different equations to estimate glomerular filtration rate: the health and anemia population-based study. PLoS One. 2015;10(8):e0136039. doi:10.1371/journal.pone.0136039
39. Canales MT, Blackwell T, Ishani A, et al. Estimated GFR and mortality in older men: are all eGFR formulae equal. Am J Nephrol. 2016;43(5):325–333. doi:10.1159/000445757
40. Van Pottelbergh G, Vaes B, Morelle J, Jadoul M, Wallemacq P, Degryse J. Estimating GFR in the oldest old: does it matter what equation we use? Age Ageing. 2011;40(3):401–405. doi:10.1093/ageing/afr033
41. Van Pottelbergh G, Vaes B, Adriaensen W, et al. The glomerular filtration rate estimated by new and old equations as a predictor of important outcomes in elderly patients. BMC Med. 2014;12(1):27. doi:10.1186/1741-7015-12-27
42. Bowling CB, Sharma P, Fox CS, O’Hare AM, Muntner P. Prevalence of reduced estimated glomerular filtration rate among the oldest old from 1988–994 through 2005–2010. JAMA. 2013;310(12):1284–1286. doi:10.1001/jama.2013.252441
43. Coresh J, Astor BC, Greene T, Eknoyan G, Levey AS. Prevalence of chronic kidney disease and decreased kidney function in the adult US population: third national health and nutrition examination survey. Am J Kidney Dis. 2003;41(1):1–12. doi:10.1053/ajkd.2003.50007
44. Ismail K, Nussbaum L, Sebastiani P, et al. Compression of morbidity is observed across cohorts with exceptional longevity. J Am Geriatr Soc. 2016;64(8):1583–1591. doi:10.1111/jgs.14222
45. Evert J, Lawler E, Bogan H, Perls T. Morbidity profiles of centenarians: survivors, delayers, and escapers. J Gerontol a Biol Sci Med Sci. 2003;58(3):232–237. doi:10.1093/gerona/58.3.M232
46. Hu H, Wang J, Han X, et al. BMI, waist circumference and all-cause mortality in a middle-aged and elderly Chinese population. J Nutr Health Aging. 2018;22(8):975–981. doi:10.1007/s12603-018-1047-z
 © 2020 The Author(s). This work is published and licensed by Dove Medical Press Limited. The
full terms of this license are available at https://www.dovepress.com/terms
and incorporate the Creative Commons Attribution
- Non Commercial (unported, 3.0) License.
By accessing the work you hereby accept the Terms. Non-commercial uses of the work are permitted
without any further permission from Dove Medical Press Limited, provided the work is properly
attributed. For permission for commercial use of this work, please see paragraphs 4.2 and 5 of our Terms.
© 2020 The Author(s). This work is published and licensed by Dove Medical Press Limited. The
full terms of this license are available at https://www.dovepress.com/terms
and incorporate the Creative Commons Attribution
- Non Commercial (unported, 3.0) License.
By accessing the work you hereby accept the Terms. Non-commercial uses of the work are permitted
without any further permission from Dove Medical Press Limited, provided the work is properly
attributed. For permission for commercial use of this work, please see paragraphs 4.2 and 5 of our Terms.