Back to Journals » Eye and Brain » Volume 14
Comparative Evaluation of Two SD-OCT Macular Parameters (GCC, GCL) and RNFL in Chiasmal Compression
Authors Santorini M ![]() , Ferreira De Moura T
, Ferreira De Moura T ![]() , Barraud S, Litré CF, Brugniart C, Denoyer A
, Barraud S, Litré CF, Brugniart C, Denoyer A ![]() , Djerada Z, Arndt C
, Djerada Z, Arndt C ![]()
Received 16 September 2021
Accepted for publication 24 December 2021
Published 5 March 2022 Volume 2022:14 Pages 35—48
DOI https://doi.org/10.2147/EB.S337333
Checked for plagiarism Yes
Review by Single anonymous peer review
Peer reviewer comments 3
Editor who approved publication: Professor Margaret Wong-Riley
Mélissa Santorini,1 Thomas Ferreira De Moura,1 Sara Barraud,2 Claude Fabien Litré,3 Catherine Brugniart,1 Alexandre Denoyer,1 Zoubir Djerada,4 Carl Arndt1
1Department of Ophthalmology, Robert Debré Hospital, Reims, France; 2Department of Endocrinology, Robert Debré Hospital, Reims, France; 3Department of Neurosurgery, Robert Debré Hospital, Reims, France; 4Department of Pharmacology, Robert Debré Hospital, Reims, France
Correspondence: Mélissa Santorini, Department of Ophthalmology, Robert Debré Hospital, Reims, France, Tel +33616521403, Email [email protected]
Purpose: To evaluate the relationship between different macular thickness parameters analyzed by SD-OCT and the central visual field (VF) evaluated with automated kinetic perimetry in a cohort of patients with pituitary tumors.
Methods: Data from patients with pituitary adenoma treated at Reims University Hospital between October 1st, 2017, and May 31st, 2018 were collected. All patients underwent an automated kinetic perimetry and a SD-OCT to map the ganglion cell complex (GCC), the ganglion cell layer (GCL) thickness and the retinal nerve fiber layer (RNFL) using devices from two different manufacturers. Univariate and multivariate analysis were used to evaluate the correlation between the area of central VF in square degrees (deg2) and the SD-OCT parameters (μm).
Results: Eighty-eight eyes were included in the analysis. All the thickness parameters measured in SD-OCT decreased with the visual field alteration. The best correlation was observed between superior thickness parameters (GCC, GCL) and the inferior central visual field. The most pertinent predictive factors for visual field loss were the inferior central GCL and the nasal RNFL (both AUC=0.775) with a sensitivity respectively of 86% and 70%.
Conclusion: This study suggests that both GCC, GCL thickness parameters could be reliable predictors of central visual field impairment in patients with pituitary tumors. There was no significative difference between both devices.
Keywords: optic chiasma, visual field, ganglion cell complex, ganglion cell layers, compressive optic neuropathy, optic coherence tomography, retinal nerve fiber layer, pituitary tumors, pituitary adenomas
Introduction
Pituitary adenomas can be associated with hormone overproduction and/or signs and symptoms due to the compression of adjacent structures, including optic chiasma.1,2 As other suprasellar tumors, symptoms are related to their size and position: if the adenoma is larger than 10 mm in diameter (macroadenoma), it can extend beyond the limits of the sella and can cause neuro-ophthalmologic disorders by compressing the adjoining structures.3
Compressive optic neuropathy corresponds to a retrograde phenomenon responsible for a thinning of the layer of peri-papillary retinal nerve fibers and an insidious disappearance of axons of the ganglion cells, responsible for deficits characteristic of the visual field (VF). Therefore, abnormalities of the VF and of the ocular structures of the posterior segment in chronic compressive lesions are characteristic of pituitary tumors. Their evaluation represents a crucial step in the diagnosis and prognosis of compressive optic neuropathy.
Perimetry (either static or kinetic) remains the gold standard for the follow-up of patients with pituitary tumors. However, this visual test remains challenging for patients with limited cooperation or cognitive disabilities.
Spectral domain - optic coherence tomography (SD-OCT), provides in vivo cross-sectional captures of the retina and of the optic nerve, allowing a quantitative, objective and reproductible analysis of the peri-papillary retinal nerve fibers.
The retinal nerve fiber layer (RNFL) thickness analysis is currently the most commonly used parameter for the diagnosis and the follow-up of compressive optic neuropathy.4 More recent studies5–7 have also showed the diagnostic and prognostic role of the ganglion cell complex (GCC), in particular in the early stages of the compressive optic neuropathy.
Unlike the RNFL which analyses the axons of the ganglion cells, the GCC also analyses the ganglion cell body layer (GCL) and the ganglion cell dendrites, corresponding to the inner plexiform layer (PLI). GCC is therefore defined as the macular region composed of the RNFL, the ganglion cell layer (GCL) and the inner plexiform layer (IPL). More recently, a selective analysis of the GCL can be performed.8
Compression of the anterior visual pathway by pituitary macroadenomas results in progressive thinning of the RNFL and the GCC.9 SD-OCT therefore has a role in the early diagnosis and management of patients with pituitary tumors. RNFL and macular GCC thickness correlate with visual function and play an important role in the prognostication of post-operative visual outcome after surgical tumor removal10,11.
Various studies have recently shown that macular ganglion cell analysis seems more sensitive than the RNFL analysis,12,13 and more sensitive than the visual field analysis.14 A binasal GCC pattern was also identified as typically associated with bitemporal hemianopia.13,15,16
All these studies were based on static automated perimetry mainly using the 30–2 strategy of the Humphrey field analyzer (Carl Zeiss Meditec, Dublin, CA, USA). But according to Rowe et al, semi-automated kinetic perimetry was found to be superior to central static testing for detection of pituitary disease-related visual field loss.17 Horton stated that static automated perimetry when compared with GCC thinning, might lack sensitivity to identify ganglion cell dysfunction.18
Kinetic perimetry offers the advantage of measuring the liminal extension of visual perception in square degrees rather than VF loss evaluated with decibels in a supra-luminal procedure.
When kinetic perimetry is available, it might be preferable to central static programs for increased detection of peripheral visual field loss.17 In a previous paper of our group, the interest of evaluating the nasal RNFL in predicting the post-operative outcome on the peripheral visual field evaluated with automated kinetic perimetry could be shown.19
However, to the authors’ best knowledge, GCC and GCL results have not yet been compared with central kinetic perimetry in pituitary tumors.
The purpose of this study is to look for a correlation between structure and function by evaluating the relationship between macular parameters (both GCC and GCL) in SD-OCT and central automated kinetic perimetry and to evaluate potential prognostic factors for visual field loss in a cohort of patients with pituitary tumors.
Patients and Methods
Subjects and Study Design
In this single-center retrospective study, consecutive patients with pituitary tumors treated at Reims University Hospital during the period from October 1, 2017, to May 31, 2018, were initially eligible for inclusion. The main inclusion criteria were: age > 18 years, and evidence at pituitary magnetic resonance imaging (MRI) of a suprasellar tumor with or without chiasm compression. Patients with other ocular diseases were excluded (myopia > 6 diopters, significant corneal, lens opacities, any macular disease, or a previous diagnosis of glaucoma).
Patients were classified on the basis of the type of tumor and hormonal hypersecretion associated to pituitary adenomas: prolactinoma, gonadotropin-secreting pituitary tumors, corticotrophin-secreting pituitary tumors (Cushing disease), growth hormone (GH)-secreting pituitary tumors (acromegaly) and non-secreting pituitary tumors.
MRI was performed for all patients to measure the height of the tumor and to determine the presence or not of the chiasm compression. The height of the tumor rather than the volume appeared to be the more accurate parameter as increased volume could also be due to increased lateral extension with no supra-pituitary fossa extension.
All patients underwent a complete ophthalmic examination including best-corrected visual acuity, intra-ocular pressure, anterior and posterior segment examination.
Visual Field
Automated kinetic perimetry (Vision Monitor, Metrovision, Pérenchies, France) had been performed. Three peripheral isopters and the blind spot had been tested. The three isopters (III-4d, III-0b, III-1e) were considered for analysis. The central VF corresponded to the first isopter. The VF were analyzed by 2 independent observers (CA and CF), if one isopter was considered as abnormal then the global VF of the considered eye was classified as impaired. In case of discordance between the two readers, the VF was re analyzed until a consensus was reached. The total area resulting from the sum of the areas of the 4 quadrants – temporal superior, temporal inferior, nasal superior, and nasal inferior – was expressed in square degrees (deg2).
Optical Coherence Tomography
The average thickness of the RNFL and the macular region were evaluated with two different Spectral Domain- OCT machines: RTVue (Optovue, Fremont, CA, USA) and Spectralis OCT (Heidelberg Engineering, Dossenheim, Germany).
The RNFL was evaluated by using the optic nerve head map protocol. This protocol generates a RNFL thickness map based on measurements obtained along a 3.45 mm diameter ring around the optic disc. Only good-quality scans, with signal strength equal to or higher than 7 were accepted.
On the RTVue (Optovue, Fremont, CA, USA), the macular region was analyzed by measuring the GCC thickness from the internal limiting membrane to the outer boundary of the inner plexiform layer. The GCC scan consisted of a 7×6 mm rectangular area of the macula centered 0.75 mm temporal to the fovea. The device software generates a significance map with normative database comparison for GCC thickness. Horizontal segmentation was obtained with the possibility of analyzing the superior and inferior hemi-GCC separately. (Figure 1). The images that had a Scan Score Index (SSI) less than 40 were excluded as recommended by the manufacturer.
 |
Figure 1 GCC thickness analyzed by horizontal segmentation with the RT-vue OCT. |
On the Spectralis OCT (Heidelberg Engineering, Dossenheim, Germany), the macular region was analyzed by measuring the GCL thickness from the inner limit of the RNFL to the outer boundary of the inner plexiform layer. The scan consisted of a 7×7 mm rectangular area centered on the fovea. The device software generates a significance map with normative database comparison for GCL thickness. On this OCT machine, an analysis in four quadrants (superior, inferior, nasal, temporal) and a separation between a central and a peripheral area was possible (Figure 2).
 |
Figure 2 GCL thickness analysis by quadrants and with a central and peripheral segmentation circle with the spectralis OCT. |
All scans were performed under ambient lighting and without pupil dilation.
Three trained operators carried out the examinations. Inter-operator variability in this procedure was considered to be very low.
Statistical Analysis
Statistical analyses were performed with R 3.1.4 (The R Foundation for Statistical Computing, http://www.r-project.org). Apart from the description of patient characteristics, continuous variables were described by their mean and the confidence interval (95% IC) and categorical variables as number and percentages.
The normality of distributions was assessed using the Shapiro–Wilk and Kolmogorov–Smirnov tests. Non-parametric univariate analyses were done for continuous variables using the Mann–Whitney test. Categorical variables were assessed using the chi-square test, or two-tailed Fisher’s exact tests when the expected number in any cell was <5.
The associations between the retinal thickness parameters measured on OCT (microns) and kinetic VF (square degrees) were assessed using univariate analysis. The discriminatory performance was assessed by receiver operating curve (ROC) and the AUC was calculated. The cut-off value was estimated using Youden index. The ROC-AUC of the three most interesting retinal parameters were compared using pROC R-package.
The multivariate analysis was then performed by binary logistic regression models in order to define the best diagnostic algorithm for the discrimination between patients with normal VF and with abnormal VF.
C statistics and Dxy were as discrimination indexes R2 and Brier and as a rank discrimination indexes. Variable included in the full model were selected using stepdown model using a higher significance level for a variable to be included in the model (α = 0.5,20). All the multivariable analysis were performed using rms package.21 To assess model fit, the validate function by estimating (bootstrapping resampling validation) the bias-corrected indices, that are specific to each type of model, were used. To assess if the observed responses are in agreement with predicted responses, the calibrate function was used.
All p values were two-tailed, with statistical significance indicated by a value of p < 0.05.
Results
In the predefined time frame, 48 patients with suprasellar tumors have been examined (28 women, 20 men, 96 eyes) with a mean age of 55 ± 13 years. Four eyes were excluded for unreliable VF, 2 eyes were excluded for no light perception and 2 eyes was excluded for corneal opacity. Eighty-eight eyes remained. Thus, 40 patients had their two eyes included and in 8 patients only one eye was included.
The height of the tumor could be evaluated in 46 patients and the tumor height average was 23.29 ± 11.79 mm. It was considered as compressive in 33 patients.
Among the suprasellar tumors of our 48 patients, 42 were pituitary adenomas, 3 were Rathke cyst and 2 were craniopharyngiomas and 1 was an osteomeningiome jugum (which is a meningioma with a bone component). Among the pituitary adenomas, 17 were not functional, 8 were gonadotropic, 8 were prolactinomas, 6 were corticotropic, 2 were somatotropic and 1 was both somatotropic and corticotropic.
Among the 88 eyes included in this study, 44 right eyes and 44 left eyes. Nineteen eyes had a normal global VF, and 69 eyes had a global VF which was considered as altered. Thirty-seven eyes had a normal central VF and 51 eyes had a central VF which was considered as altered.
When analyzing the GCL, 9 eyes were excluded of the statistical analysis for missing values (patients in whom only the SD-OCT with the Optovue device had been performed and not with the Spectralis device).
When analyzing the GCC, 2 eyes were excluded of statistical analysis for missing values (patients in whom only the SD-OCT with the Spectralis device had been performed and not with the Optovue device).
No eyes were excluded for low SSI or low signal strength.
The general characteristics of subjects are shown in Table 1.
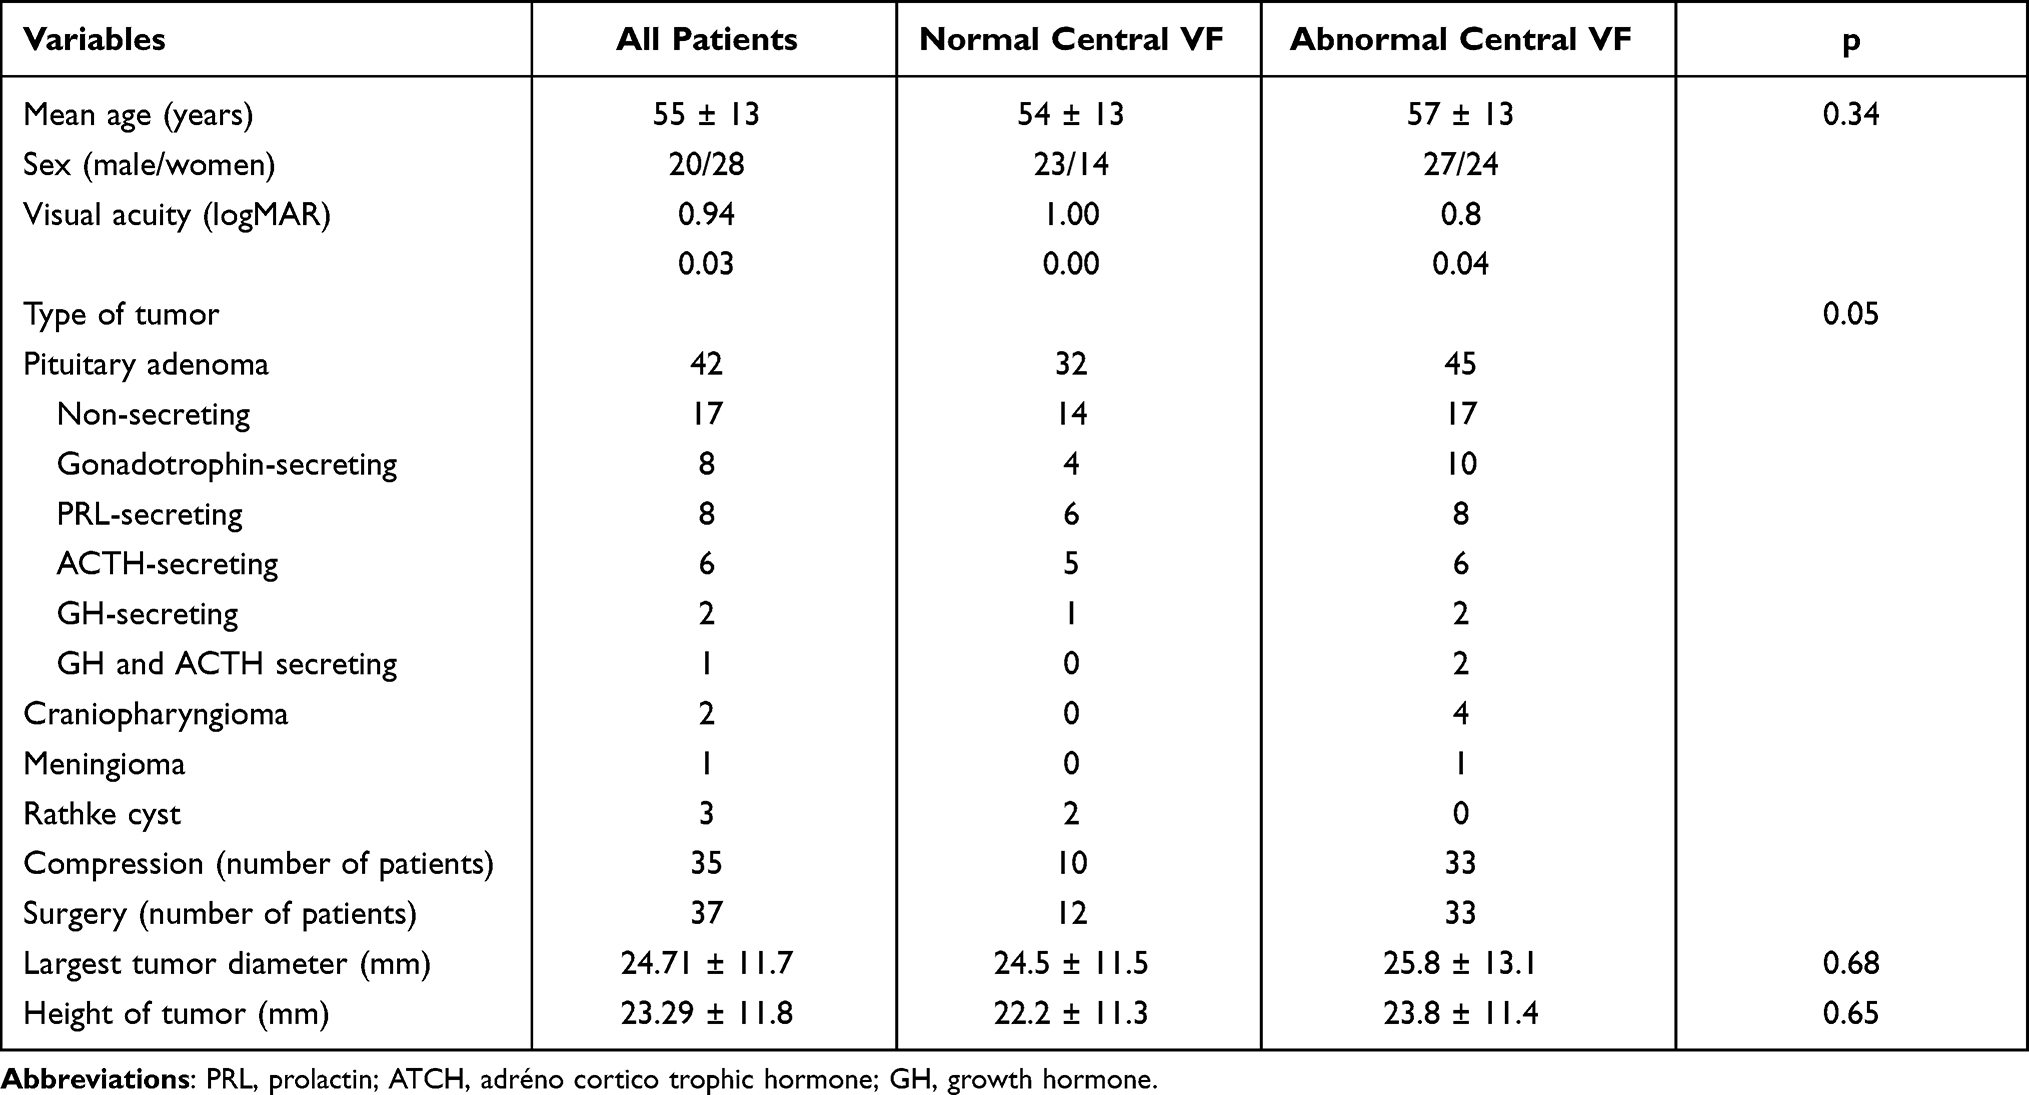 |
Table 1 Demographic Data Study Participants |
Correlation Between Structure and Function
To look for the existence of an anatomic-functional correspondence between the central VF and the retinal ganglion cells, different correlations were evaluated, using the GCL, GCC and RNFL thickness parameters.
GCL Thickness vs Perimetry
The statistical analysis comparing the GCL and the VF by hemi-quadrant found a good correlation between structure and function. The best correlation was found for the average GCL and the central VF (R=0.60, p<0.001). The correlation was also statistically significant between the superior central GCL with the inferior VF (R=0.57, p<0.0001) and superior peripheral GCL (R=0.56, p<0.0001) with the inferior VF.
In our statistical analysis, a lower correlation was found between the peripheral inferior GCL and the superior central VF (R=0.41, p<0.0001).
The results are detailed Table 2.
 |
Table 2 Correlation Between GCL and Central VF |
GCC Thickness vs Perimetry
When comparing GCC thickness with central VF, the statistical analysis showed a significant albeit lower relationship between central VF with the average GCC (R=0.30, p=0.002), inferior VF with superior GCC (R=0.34, p=0.04) and superior VF with inferior GCC (R=0.20, p=0.06).
The results are detailed Table 3.
 |
Table 3 Correlation Between GCC and Central VF |
RNFL Thickness vs Perimetry
A strong relationship between the visual field area and the mean, inferior, and superior RNFL thickness could be demonstrated. A weaker relationship with the visual field area was found with the nasal and temporal thickness. The results are detailed Table 4.
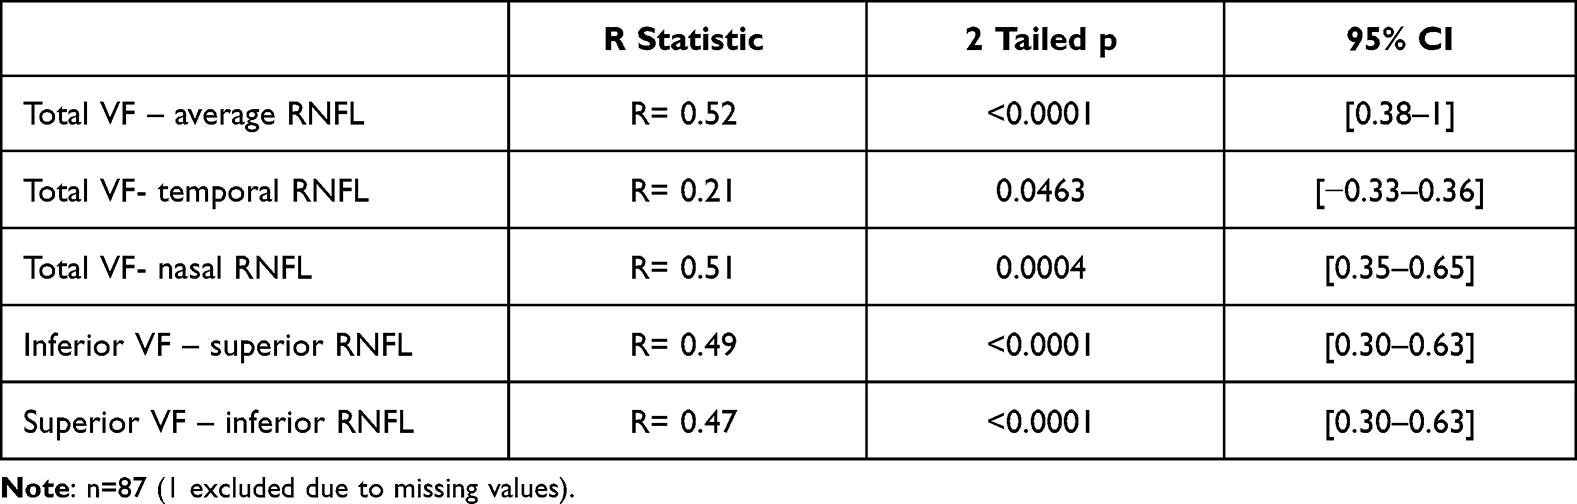 |
Table 4 Correlation Between RNFL and Central VF |
Searching for OCT Predictors of Central Visual Field Loss
Univariate Analysis
To look for the existence of predictors for central VF loss, all the OCT parameters (GCL, GCC and RNFL thickness) were compared between eyes with a normal VF and those with an altered VF.
GCL vs Visual Field Loss
When comparing the GCL thickness between the group with normal central VF (37 eyes) and the group with an altered central VF (51 eyes), the central inferior GCL appeared as the most reliable parameter with the highest area under the curve (AUC) of 0.74 in a univariate analysis. Although the AUCs for the other parameters were lower, the difference did not reach statistical significance. Only the AUC obtained with the peripheral inferior GCL was significantly lower than the AUC obtained with the central inferior GCL (p=0.04).
The detailed results are shown Table 5.
 |
Table 5 Abnormal vs Normal Central VF – GCL (Spectralis) |
GCC vs Visual Field Loss
When comparing GCC thickness between the group with normal VF (37 eyes) and the group with altered VF (51 eyes) the AUC is 0.70 for the inferior GCC, which appeared as the best predictor for central visual field loss. The AUC for the superior and average GCC are respectively 0.68 and 0.69, however the difference with the AUC of the inferior GCC was not significant.
The detailed results are shown Table 6
 |
Table 6 Abnormal vs Normal Central VF – GCC (Optovue) |
RNFL vs Visual Field Loss
When comparing RNFL thickness between the group with normal VF (37 eyes) and the group with altered VF (51 eyes) the AUC is 0.74 for the nasal RNFL with the Optovue device, which seems to be the best predictor for central visual field loss.
The other results (average, temporal, superior and inferior RNFL) are shown Tables 7 and 8.
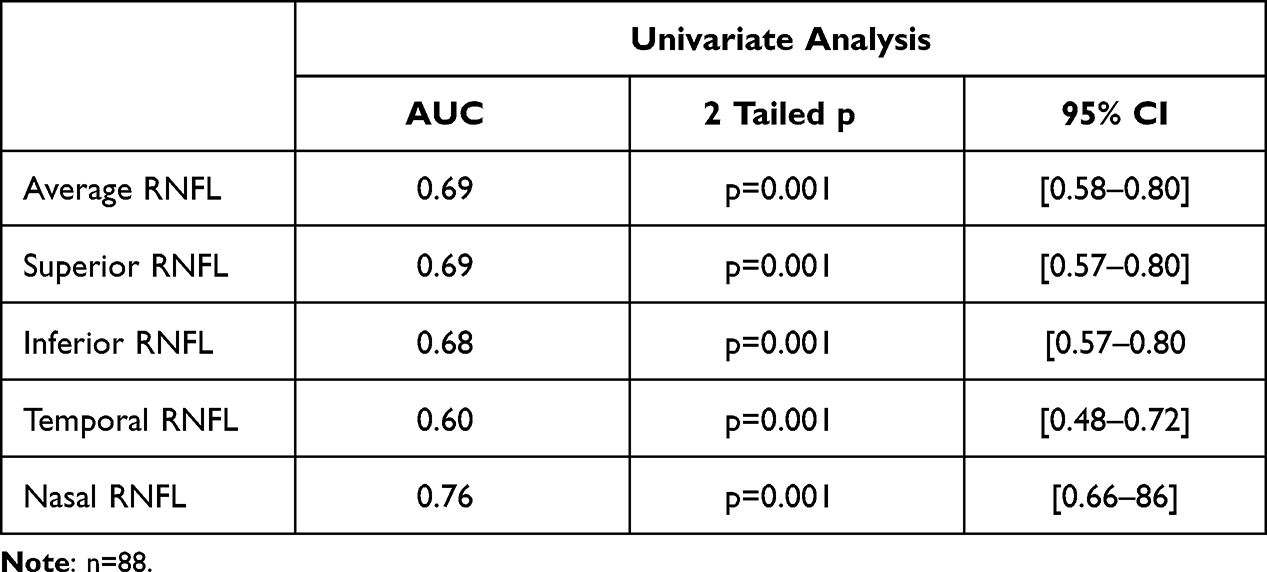 |
Table 7 Abnormal vs Normal Central VF – RNFL (Optovue) |
 |
Table 8 Abnormal vs Normal Central VF – RNFL (Spectralis) |
Nasal RNFL, Inferior GCC and Central Inferior GCL vs Visual Field Loss
No statistical difference between these 3 parameters was found for predicting visual field loss (p>0.2 in all comparative univariate analysis). These results are shown in Table 9.
 |
Table 9 Comparative Analysis Between the 3 Best Parameters in Univariate Analysis |
Inferior GCC, Inner Inferior GCL and RNFL Sensitivity and Specificity
The diagnostic performance of the inferior GCC, the central inferior GCL and the RNFL parameters in detecting eyes with an abnormal central VF was assessed using the Area Under the Curve (AUC) (Tables 5–8).
Among the GCC parameters, the AUC for diagnosing an altered central VF was largest for the inferior GCC thickness with a cutoff around 91.8 μm. The sensitivity of the inferior GCC was 58% and the specificity 78% (Figure 3).
 |
Figure 3 Inferior GCC AUC, showing a cut off at 91.8 μm, a specificity at 78% and a sensitivity at 57%. |
Among the RNFL parameters, the AUC for diagnosing an altered central VF was largest for the nasal RNFL thickness with a cutoff at 72μm. The sensitivity of the nasal RNFL was 70% and the specificity 75% (Figure 4). The global RNFL AUC for diagnosing an altered central VF was also analyzed, with a cut-off at 81μm (Figure 5).
 |
Figure 4 Nasal RNFL AUC, showing a cut off at 72 μm, a specificity at 75% and a sensitivity at 71%. |
 |
Figure 5 Global RNFL AUC, showing a cut off at 81 μm, a specificity at 89% and a sensitivity at 48%. |
Among the GCL parameters, the AUC for diagnosing an altered central VF was largest for the central inferior GCL thickness with a cutoff at 53μm. The sensitivity was 86% and the specificity 52% (Figure 6).
 |
Figure 6 Central inferior GCL AUC, showing a cut off at 53.0 μm, a specificity at 53% and a sensitivity at 86%. |
Central Visual Field Correlation
Univariate analysis by a logistic regression model was carried out to determine the factors influencing the central VF. Parameters such as the gender, the age, the type of tumor, the type of hormonal hypersecretion or the chiasmal compression by the tumor did not statistically impact the central VF. The only factor which was statistically correlated to the central VF was the tumor’s largest diameter and largest height (both p<0.01).
Multivariate Analysis (Table 10)
A multiple logistic regression analysis was performed to assess independent associations between the central VF and retinal parameters. In the multivariate analysis, the tumor largest diameter and largest height were no longer associated with VF and SD-OCT.
 |
Table 10 Multivariate Analysis |
The AUC for diagnosing an altered central VF was largest for the central inferior GCL (0.775; p=0.004) (vs 0.74 in the univariate analysis) and identical with the nasal RNFL (0.775; p=0.0006 vs 0.76 in the univariate analysis).
The AUC for diagnosing an altered central VF was lower for the inferior GCC (0.707; p=0.21) (vs 0.70 in the univariate analysis) than for the inferior GCL and the nasal RNFL.
Discussion
In this retrospective analysis of chiasmal compression evaluated with the RNFL and the macular ganglion cell layers, a correlation with central kinetic perimetry was found for all OCT parameters. The best predictive macular thickness parameter for visual field loss appeared to be the central inferior ganglion cell layer thickness equivalent to the nasal RNFL thickness (both AUC=0.775 in a multivariate analysis). This may be related to the preferential location of compression at the inferior part of the chiasma. A significative difference (p=0.04) has been found between the central inferior GCL and the peripheral inferior GCL.
The central inferior GCL also appeared as the most sensitive parameter (86%) to detect central VF loss, which is in accordance with anatomo-functional considerations. The optic chiasma is located a few millimeters above the pituitary gland. This could explain, that in case of progressive expansion of a pituitary tumor, the inferior axons are the first to be affected.
Concerning the relationship between OCT parameters and the central visual field, all GCL thickness parameters appeared to be correlated with the corresponding hemifield (eg nasal GCL versus temporal hemi-field, and inferior GCL versus superior hemi-field). The highest correlation was observed between the superior central GCL and the inferior hemifield (r=0.57). The second highest correlation observed was the superior peripheral GCL again with the inferior hemifield (r=0.56).
Although the correlation between VF and thickness is lower with the GCC parameters, no significative difference in predicting visual field loss was found between GCC and GCL. Thus, no superiority of either device could be demonstrated.
Besides the macular parameters (GCL and GCC), the RNFL and particularly the nasal RNFL (AUC=0.775 in the multivariate analysis) also demonstrated a robust correlation with the visual field parameters as it has already been demonstrated in a previous publication.19 The AUC for both inferior central GCL and nasal RNFL was identical. The inferior RNFL was also correlated to the visual field in our study even though the correlation was lower than described in the literature.22,23
The global RNFL has also been analyzed and the cut-off between the normal and altered central VF has been found in this study at 81 μm, which is compatible with the fact that an RNFL in compressive neuropathy was considered as altered under 99.5 μm in a Danesh-Meyer study.24 Moreover, the same author also mentioned10,24 that a thinner preoperative RNFL thickness measurement (<80 μm) was associated with worse visual acuity and visual field after surgery.
The compressive optic neuropathy induces a progressive disappearance of ganglion cell axons by a retrograde phenomenon, responsible for a thinning of the peri-papillary retinal nerve fiber layer (RNFL) and of the macular parameters (GCL and GCC). The macular parameters have some advantages: unlike the RNFL in which the measurement of axonal loss is less reliable when the thickness gets under 35 μm, the macular parameters (GCL and GCC) do not have such a basement effect. This increases the potential value and interest for the follow-up of patients with progressive pituitary tumors. In addition, macular parameters are potentially less affected than the RNFL by inter-individual variations (papillary size variations, peripapillary atrophy).25 However, despite this theoretical advantage, the predictive value for VF impairment was found to be identical between RNFL and GCL.
Regarding the methodology, this study was based on tissue thicknesses which are objective and reproductible parameters. Patients with myopia, macular diseases or glaucoma have been excluded as these conditions would have altered the analysis of visual field and of the different SD-OCT parameters, creating a confusion bias. However, we could have added to exclusion criteria any systemic disorders that might affect eyes (systemic corticosteroids intake, diabetes or hypertension) and excluded myopic eyes > 3 dioptries (instead of 6 dioptries) as the thickness of ganglion cell layer could be slightly different in these eyes.
The RTVue SD-OCT device does not allow a separation between the nasal and temporal hemi-retina, only the GCC thickness in the superior and inferior subfields was evaluated. On the contrary, the Spectralis OCT enables an analysis by hemiquadrant, also separating the perifoveal and the more peripheral macular retina. Overall, the RTvue analyzed the retina in 3 subfields whereas the Spectralis OCT analyzed the retina in 9 subfields.
In addition, the two devices have different segmentation maps, the Optovue analyzing the combination of the GCL and the inner plexiform layer (called GCC) whereas the Spectralis measures the isolated thickness of the GCL.
Despite the higher degree of retinal layer segmentation and higher number of subfields provided by the Spectralis device, in particular measuring the GCL alone vs a combined measurement of GCL and IPL, no significant advantage in terms of predicting visual field loss could be shown with the isolated GCL analysis despite the higher AUC.
Limitations of the Study
The study was monocentric and retrospective which could induce a selection bias. It could be interesting to build a prospective study with a long-term follow-up in order to analyze the evolution of these different macular parameters.
Finally, the chiasmal compression in this study has various origins although the majority was due to pituitary adenomas. This may have induced bias in comparison with the results obtained in a homogeneous group of patients with compression of the same origin.
A multivariate model created by artificial intelligence could also be pertinent in order to analyze the different parameters of a same device and determine if there is an interest in regrouping them to increase sensitivity and specificity to detect VF loss. A study with a larger population would therefore be necessary.
Conclusion
The present study showed a significant correlation between the macular parameters and the area of perception on kinetic perimetry. All the thickness parameters measured in SD-OCT decreased with the visual field alteration. The robust correlation between the RNFL and the visual field has been confirmed in this study, confirming the interest of the nasal RNFL and the cut-off value at 80 μm of the mean RNFL to predict central visual field loss. It also enabled to identify several GCL and GCC parameters as potential predictive factors for visual field loss. The central inferior GCL and the nasal RNFL appeared as the best predictive SD-OCT factors to detect central visual field impairment, with a sensitivity of 86% and a cut off at 53 μm.
In conclusion, this study suggests that macular parameters (GCL and GCC) could be as interesting as the RNFL for the follow-up of patients with pituitary tumors in order to predict the visual field alteration due to compressive optic neuropathy. No superiority of either device could be demonstrated.
Statement of Ethics
This was performed in accordance with the ethical standard for the Declaration of Helsinki. Database was built in accordance with the reference methodology MR003 of the Commission Nationale de l’Informatique et des Libertés (n°2016198, 12th December 2016). Patients were informed that the study was being carried out via the hospital’s registry of ongoing studies, and non-opposition forms were sent to all patients included, explaining that data will be collected and that they may oppose. In absence of opposition within the time set limit, data were collected and anonymized prior to analysis.
According to the French Public Health Code, this research also did not need require an ethical committee.26
Funding
The authors do not have any funding source relative to this research to declare.
Disclosure
Prof. Dr. Carl Arndt reports non-financial support from Metrovision, grants from Heidelberg Engineering, during the conduct of the study. The authors have no other conflicts of interest to declare.
References
1. Colao A, Sarno A, Cappabianca P, et al. Gender differences in the prevalence, clinical features and response to cabergoline in hyperprolactinemia. Eur J Endocrinol. 2003:325–331. doi:10.1530/eje.0.1480325
2. Colao A, Di Somma C, Pivonello R, Faggiano A, Lombardi G, Savastano S. Medical therapy for clinically non-functioning pituitary adenomas. Endocr Relat Cancer. 2008;15(4):905–915. doi:10.1677/ERC-08-0181
3. Zee CS, Go JL, Kim PE, Mitchell D, Ahmadi J. Imaging of the pituitary and parasellar region. Neurosurg Clin N Am. 2003;26:e45.
4. Danesh-Meyer HV, Carroll SC, Foroozan R, et al. Relationship between retinal nerve fiber layer and visual field sensitivity as measured by optical coherence tomography in chiasmal compression. Investig Ophthalmol Vis Sci. 2006;47(11):4827. doi:10.1167/iovs.06-0327
5. Akashi A, Kanamori A, Ueda K, Matsumoto Y, Yamada Y, Nakamura M. The detection of macular analysis by SD-OCT for optic chiasmal compression neuropathy and nasotemporal overlap. Investig Ophthalmol Vis Sci. 2014;55(7):4667. doi:10.1167/iovs.14-14766
6. Micieli JA, Newman NJ, Biousse V. The role of optical coherence tomography in the evaluation of compressive optic neuropathies. Curr Opin Neurol. 2019;32(1):115–123. doi:10.1097/WCO.0000000000000636
7. Moon JS, Shin SY. Segmented retinal layer analysis of chiasmal compressive optic neuropathy in pituitary adenoma patients. Graefes Arch Clin Exp Ophthalmol. 2020;258(2):419–425. doi:10.1007/s00417-019-04560-3
8. Mwanza JC, Oakley JD, Budenz DL, Chang RT, Knight OJ, Feuer WJ. Macular ganglion cell–inner plexiform layer: automated detection and thickness reproducibility with spectral domain–optical coherence tomography in glaucoma. Investig Ophthalmol Vis Sci. 2011;52(11):8323. doi:10.1167/iovs.11-7962
9. Monteiro MLR, Hokazono K, Fernandes DB, et al. Evaluation of inner retinal layers in eyes with temporal hemianopic visual loss from chiasmal compression using optical coherence tomography. Investig Ophthalmol Vis Sci. 2014;55(5):3328. doi:10.1167/iovs.14-14118
10. Danesh-Meyer HV, Papchenko T, Savino PJ, Law A, Evans J, Gamble GD. In vivo retinal nerve fiber layer thickness measured by optical coherence tomography predicts visual recovery after surgery for parachiasmal tumors. Investig Ophthalmol Vis Sci. 2008;49(5):1879. doi:10.1167/iovs.07-1127
11. Ohkubo S, Higashide T, Takeda H, Murotani E, Hayashi Y, Sugiyama K. Relationship between macular ganglion cell complex parameters and visual field parameters after tumor resection in chiasmal compression. Jpn J Ophthalmol. 2012;56(1):68–75. doi:10.1007/s10384-011-0093-4
12. Zhang Y, Ye Z, Wang M, Qiao N. Ganglion cell complex loss precedes retinal nerve fiber layer thinning in patients with pituitary adenoma. J Clin Neurosci. 2017;43:274–277. doi:10.1016/j.jocn.2017.06.008
13. Tieger MG, Hedges TR, Ho J, et al. Ganglion cell complex loss in chiasmal compression by brain tumors. J Neuroophthalmol. 2017;37(1):7–12. doi:10.1097/WNO.0000000000000424
14. Blanch RJ, Micieli JA, Oyesiku NM, Newman NJ, Biousse V. Optical coherence tomography retinal ganglion cell complex analysis for the detection of early chiasmal compression. Pituitary. 2018;21(5):515–523. doi:10.1007/s11102-018-0906-2
15. Yum HR, Park SH, Park HYL, Shin SY. Macular ganglion cell analysis determined by cirrus HD optical coherence tomography for early detecting chiasmal compression. PLoS One. 2016;11(4):e0153064. doi:10.1371/journal.pone.0153064
16. Jeong AR, Kim EY, Kim NR. Preferential ganglion cell loss in the nasal hemiretina in patients with pituitary tumor. J Neuroophthalmol. 2016;36(2):152–155. doi:10.1097/WNO.0000000000000331
17. Rowe FJ, Cheyne CP, García-Fiñana M, et al. Detection of visual field loss in pituitary disease: peripheral kinetic versus central static. Neuro-Ophthalmol. 2015;39(3):116–124. doi:10.3109/01658107.2014.990985
18. Horton JC. Invited commentary: ganglion cell complex measurement in compressive optic neuropathy. J Neuroophthalmol. 2017;37(1):13–15. doi:10.1097/WNO.0000000000000489
19. Garcia T, Sanchez S, Litré CF, et al. Prognostic value of retinal nerve fiber layer thickness for postoperative peripheral visual field recovery in optic chiasm compression: clinical article. J Neurosurg. 2014;121(1):165–169. doi:10.3171/2014.2.JNS131767
20. Steyerberg EW, Eijkemans MJC, Jr FEH, Habbema JDF. Prognostic modelling with logistic regression analysis: a comparison of selection and estimation methods in small data sets. Stat Med. 2000;21:1059–1079.
21. Harrell FE. Case study in binary logistic regression, model selection and approximation: predicting cause of death. In: Regression Modeling Strategies. Springer Series in Statistics. Springer International Publishing; 2015:275–289. doi:10.1007/978-3-319-19425-7_11
22. Abouaf L, Vighetto A, Lebas M. Neuro-ophthalmologic exploration in non-functioning pituitary adenoma. Ann Endocrinol. 2015;76(3):210–219. doi:10.1016/j.ando.2015.04.006
23. Jacob M, Raverot G, Jouanneau E, et al. Predicting visual outcome after treatment of pituitary adenomas with optical coherence tomography. Am J Ophthalmol. 2009;147(1):64–70.e2. doi:10.1016/j.ajo.2008.07.016
24. Danesh-Meyer HV, Wong A, Papchenko T, et al. Optical coherence tomography predicts visual outcome for pituitary tumors. J Clin Neurosci. 2015;22(7):1098–1104. doi:10.1016/j.jocn.2015.02.001
25. Korobelnik JF, Agard É, Aharchi F, Aptel F. OCT En Ophtalmologie: rapport 2019; 2019.
26. Article R1121-2 of French Public Health Code. Available from: https://www.legifrance.gouv.fr/codes/article_lc/LEGIARTI000034696957.
 © 2022 The Author(s). This work is published and licensed by Dove Medical Press Limited. The
full terms of this license are available at https://www.dovepress.com/terms
and incorporate the Creative Commons Attribution
- Non Commercial (unported, 3.0) License.
By accessing the work you hereby accept the Terms. Non-commercial uses of the work are permitted
without any further permission from Dove Medical Press Limited, provided the work is properly
attributed. For permission for commercial use of this work, please see paragraphs 4.2 and 5 of our Terms.
© 2022 The Author(s). This work is published and licensed by Dove Medical Press Limited. The
full terms of this license are available at https://www.dovepress.com/terms
and incorporate the Creative Commons Attribution
- Non Commercial (unported, 3.0) License.
By accessing the work you hereby accept the Terms. Non-commercial uses of the work are permitted
without any further permission from Dove Medical Press Limited, provided the work is properly
attributed. For permission for commercial use of this work, please see paragraphs 4.2 and 5 of our Terms.