Back to Journals » ClinicoEconomics and Outcomes Research » Volume 6
Comparative cost effectiveness of Coflex® interlaminar stabilization versus instrumented posterolateral lumbar fusion for the treatment of lumbar spinal stenosis and spondylolisthesis
Authors Schmier J, Halevi M, Maislin G, Ong K
Received 14 December 2013
Accepted for publication 28 January 2014
Published 18 March 2014 Volume 2014:6 Pages 125—131
DOI https://doi.org/10.2147/CEOR.S59194
Checked for plagiarism Yes
Review by Single anonymous peer review
Peer reviewer comments 3
Jordana Kate Schmier,1 Marci Halevi,2 Greg Maislin,3 Kevin Ong4
1Health Sciences, Exponent Inc., Alexandria, VA, USA; 2Paradigm LLC, New York, NY, USA; 3Biomedical Statistical Consulting, Wynnewood, PA, USA; 4Biomedical Engineering, Exponent Inc., Philadelphia, PA, USA
Introduction: Symptomatic chronic low back and leg pain resulting from lumbar spinal stenosis is expensive to treat and manage. A randomized, controlled, multicenter US Food and Drug Administration Investigational Device Exemption clinical trial assessed treatment-related patient outcomes comparing the Coflex® Interlaminar Stabilization Device, an interlaminar stabilization implant inserted following decompressive surgical laminotomy in the lumbar spine, to instrumented posterolateral fusion among patients with moderate to severe spinal stenosis. This study uses patient-reported outcomes and clinical events from the trial along with costs and expected resource utilization to determine cost effectiveness.
Methods: A decision-analytic model compared outcomes over 5 years. Clinical input parameters were derived from the trial. Oswestry Disability Index scores were converted to utilities. Treatment patterns over 5 years were estimated based on claims analyses and expert opinion. A third-party payer perspective was used; costs (in $US 2013) and outcomes were discounted at 3% annually. Sensitivity analyses examined the influence of key parameters. Analyses were conducted using Medicare payment rates and typical commercial reimbursements.
Results: Five-year costs were lower for patients implanted with Coflex compared to those undergoing fusion. Average Medicare payments over 5 years were estimated at $15,182 for Coflex compared to $26,863 for the fusion control, a difference of $11,681. Mean quality-adjusted life years were higher for Coflex patients compared to controls (3.02 vs 2.97). Results indicate that patients implanted with the Coflex device derive more utility, on average, than those treated with fusion, but at substantially lower costs. The cost advantage was greater when evaluating commercial insurance payments. Subgroup analyses found that the cost advantage for Coflex relative to fusion was even larger for two-level procedures compared to one-level procedures.
Conclusion: The Coflex Interlaminar Stabilization Device was found to be cost effective compared to instrumented posterolateral fusion for treatment of lumbar spinal stenosis. It provided higher utility at substantially lower cost.
Keywords: cost analysis, spine, treatment comparison
Introduction
Lumbar spinal stenosis (LSS), in which narrowing of the spinal canal results in pressure on nerves in the back and leg, affects as many as 38.8% of adults 60 years and older in the United States.1 As the population ages, the prevalence of LSS is likely to increase, resulting in an increased need for management of this condition. Treatments for which there is evidence of effectiveness include pharmacologic use, intramuscular calcitonin, epidural steroid injections, and surgery.2 While surgical decompression, with or without instrumented fusion, is effective for the majority of LSS patients,2 newer surgical options such as interspinous implants have also demonstrated clinical effectiveness in patients for whom conservative treatments, such as bed rest, physical therapy, exercise, braces, traction, transcutaneous electrical nerve stimulation, spinal manipulation, narcotic analgesics, or epidural steroids, have failed.3 It is noteworthy that after seeking conservative treatment for LSS, many patients do not progress to surgery immediately; only one-fifth of Medicare beneficiaries diagnosed in 2003 with LSS underwent surgery within the 3 years after diagnosis.4
Many studies have quantified the costs of surgical treatment for LSS among Medicare beneficiaries in the United States. Some of these studies limit their analyses to surgical costs and do not identify any differences in treatment expenditures past the initial hospitalization.5,6 While the overall rates of surgery for LSS have decreased from 2002 to 2007, the rate of multilevel fusion procedures has increased dramatically.6 Multilevel fusion procedures were shown to be more costly and associated with significantly more life-threatening complications and rehospitalizations than decompression alone, particularly within the 30 days postsurgery.6 When comparing surgical intervention to nonoperative care for patients with stenosis among participants in the Spine Patient Outcomes Research Trial (SPORT),8 decompression surgery appeared much more cost effective than a fusion surgery when each was compared to nonsurgical intervention.
The incremental cost-effectiveness ratio (ICER) provides a single value that accounts for both cost and clinical effectiveness and allows for an assessment of cost effectiveness between two or more treatments. It has been estimated for a number of spinal surgical interventions.7,8 By allowing for the comparison of various potential options using a single metric, the ICER is a tool health care providers can utilize for making treatment decisions. However, decision making may be streamlined in those situations where one treatment option maintains (or improves) clinical effectiveness/utility while simultaneously lowering the expenses, because in such a scenario there is no cost-effectiveness tradeoff: the treatment demonstrates benefits in both its clinical utility and its cost effectiveness. In those cases, that treatment option is said to “dominate” the alternatives.
When examining the economic analyses described above, decompression alone appears to have the most favorable ICER. Therefore, assessments of potential future treatments for spinal stenosis should at the very least attain the observed cost effectiveness of decompression surgery relative to a nonsurgical alternative; that is, demonstrate a better cost-effectiveness profile than decompression alone.
The Coflex interlaminar stabilization device (Paradigm Spine, New York City, NY, USA) has been approved as an alternative to spinal fusion in the treatment of spinal stenosis with or without low-grade spondylolisthesis. While the 2-year clinical and radiographic results have been reported,9,10 the comparative cost-effectiveness of these treatments has not been previously reported. In this analysis, we utilize a health care economic model to estimate the direct health care costs as well as quality-adjusted life years (QALY) of Coflex-treated patients and provide comparisons relative to instrumented posterolateral fusion over a 5-year period.
Methods
The economic model uses multiple sources of input. The spreadsheet model incorporates clinical data, treatment patterns, and costs. The base case of the model uses reimbursement rates from the US Medicare fee schedule, presented in 2013 dollars and the model takes a third-party payer perspective as it estimates costs over a 5-year period. Costs and outcomes are discounted annually at 3% in the base case. A third-party payer perspective was used for the base case. Figure 1 shows the structure of the model.
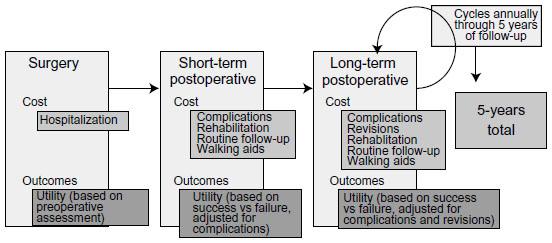 | Figure 1 Model structure. |
The clinical data input was obtained from results reported in Davis et al10 that describe a randomized Investigational Device Exemption (IDE) clinical trial comparing Coflex to instrumented fusion. Briefly, patients included in that trial had lumbar spinal stenosis in one or two vertebral levels from L1 to L5 and had undergone at least 6 months of conservative treatment. Patients were randomized in a 2:1 ratio to either the investigational arm (Coflex Interlaminar Stabilization Device following decompression) or to the control arm (posterolateral fusion with autograft and pedicle screw fixation). The primary endpoint was a Month 24 composite clinical success (CCS) assessment that comprised the following components: an improvement of at least 15 points on the Oswestry Disability Index;11 no reoperations, revisions, or supplemental fixation; no lumbar epidural steroid injections; no major device-related complications, and no new or worsening, persistent neurologic deficits. The results at Month 24 showed that Coflex successfully met the noninferiority endpoint as compared to instrumented fusion (Bayesian posterior probability =0.999 using a noninferiority margin of 0.10).
The clinical data from the IDE trial included the Oswestry Disability Index (ODI), a patient-reported questionnaire completed by trial participants at every follow-up visit. Using a published algorithm, the ODI allowed for derivation of SF-6D utility scores.12 Scores were calculated at various time points as well as for subgroups of subjects who experienced particular adverse events or complications.
To ensure the data from this study could not potentially be influenced by the sponsor, data management for this study was outsourced in its entirety to an independent clinical research organization with no financial ties to the study sponsor. Similarly, to minimize site-to-site reporting variability, all adverse events were adjudicated by an independent clinical events committee with the adjudication binding on the sponsor.13
For both cohorts, expected treatment patterns through 5 years were derived from published sources,2 analysis of the Medicare Limited Data Set 5% Sample (2005–2009),14 and expert opinion (a survey of six orthopedic practices in the United States). Treatment patterns from the IDE trial could not be used directly because of the various protocol-driven assessments such as imaging requirements as well as the number of follow-up visits (Week 6, Months 3, 6, 12, and 24), both of which exceed normal standard of care practices.
Costs were derived from the Medicare Fee Schedule,15 as published by the Centers for Medicare and Medicaid Services, and included payment for physician services and inpatient hospital reimbursement for the index surgical event. The 2013 Medicare Physician Fee Schedule and applicable conversion factor were used to derive the reimbursement for physician services for each primary procedure. Physician services included the index event as well as certain follow-up services occurring up to 90 days postoperatively and determined to be part of the global surgery package. The 2013 Inpatient Prospective Payment System Final Rule16 was used to estimate Medicare national average for the applicable Medical Severity Diagnosis-related Group (DRG) to which each primary procedure would typically be assigned. DRG reimbursement amounts represent the total payment provided to the hospital. Separate amounts are billed by surgeons; these were also included in the model. The reimbursement for devices and supplies used for each procedure is included in the DRG reimbursement; there is no additional or separate reimbursement for implanted devices. It was assumed that primary procedures were performed in an inpatient setting and would be coded using the appropriate CPT® codes17 to report the implantation of Coflex following decompression or posterolateral fusion with pedicle screw fixation and autograft bone following decompressive laminectomy. Based on the clinical data from the IDE trial, the payment amount used in the model assumed that 68% of cases were one-level, and the remainder were two-level. Rates for complications were derived from the clinical trial; costs were derived from analysis of the Medicare Limited Data Set14 and Thomson Reuters MarketScan data. In the situation where a Medicare payment was available but one for commercial insurance was not, we inserted a rate that was the Medicare value plus 20%, which is a conservative estimate of commercial payments to Medicare rates, as anecdotal evidence indicates that payments made by commercial insurance carriers are typically higher than 20% above Medicare rates.
Annual follow-up expenses were estimated by weighting costs for each of the resources identified by the expert panel by the proportion of patients who would be expected to use each type of resource. Thus, if 20% of patients were expected to have a certain test, then the model applied 20% of the cost for the test to each patient. In this fashion, an average cost per patient was developed. Subgroup analyses were conducted for selected groups for whom data were available (eg, one vs two levels treated). Sensitivity analyses examined the robustness of the findings and identified the inputs that most strongly influenced the model. This was done by varying the cost multipliers for specific resources and utilities associated with specific clinical status or occurrence of an event. Threshold analyses were used to determine the point at which changes in key model inputs result in a reversal of study conclusions.
Data from the Coflex US IDE clinical trial were used for the base case analysis. Demographic, clinical, and health status characteristics are presented in Table 1. There were no significant differences in baseline or disease severity characteristics between the Coflex and instrumented fusion groups. Patients who reported complications were scored with mild decrements; eg, those patients with component problems had a utility score of 0.652, while those reporting new or worsening pain received a score of 0.599. Expert opinion was used to estimate the number of months over which each complication affected utilities. For example, a fracture was assumed to affect utility scores for 9 months, while a wound problem decreased utilities for 1 month. These values were also subjected to sensitivity analysis. The same utility values were used for both cohorts; that is, regardless of how the patient achieved clinical success, the same value was assigned. Similarly, regardless of the type of surgery that was followed by a wound infection, the utility value assigned for the wound infection was identical across cohorts. This approach is based on the assumption that the utility value should be guided by the current health state, not by prior surgical history.
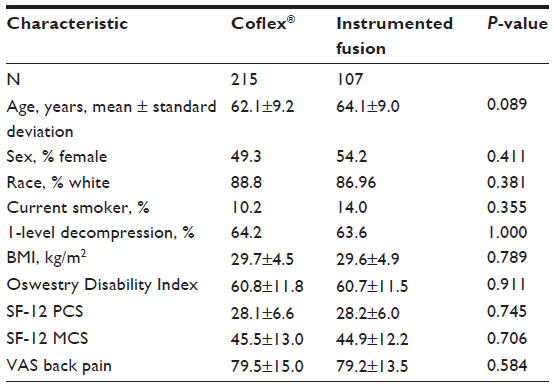 | Table 1 Demographic and clinical characteristics of trial participants |
Results
Clinical inputs to the model are presented in Table 2. These include the rates of success, failure, and complications. Utilities are also presented in Table 2. Based on ODI scores measured before randomization, the preoperative utility score was determined to be 0.468. Those who achieved overall clinical success had utility scores determined to be 0.692, while those with failure had utility determined to be 0.552.
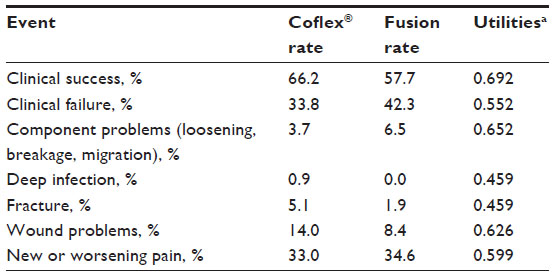 | Table 2 Clinical inputs |
Treatment costs associated with routine follow-up care and for selected complications are presented in Table 3. For simplicity, the table presents only summary information, but it is important to note that the values in this table take into account a variety of costs. For example, based on input from an orthopedic expert panel regarding the first 6 weeks after surgery, all patients treated with Coflex have an X-ray procedure, 30% have an additional X-ray, 1% have an MRI, and 9% have a physical therapy evaluation. Similarly, all patients treated with instrumented fusion have an X-ray procedure, 20% have an additional X-ray, 2% have a CT scan, and 2% have a physical therapy evaluation. Over these initial 6 weeks, average Medicare reimbursements, excluding payment for the index event and follow-up services considered to be part of the global surgery package, were estimated to be $59 for Coflex patients and $47 for instrumented fusion patients. In the years after surgery, patients from both study cohorts attended similar rates of outpatient visits, but the instrumented fusion patients did undergo higher than expected use of X-rays in order to verify bony fusion success over time. Patients treated with instrumented fusion also had higher use of physical therapy, which is associated with increased annual costs, with the costs for Years 2 through 5 being more than twice as high for patients who had undergone fusion compared to Coflex patients.
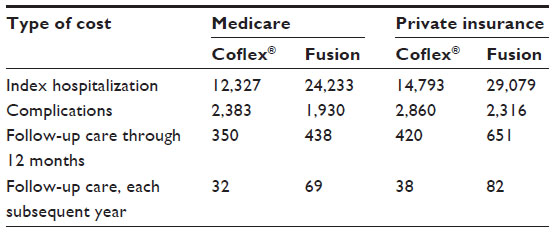 | Table 3 Cost inputs |
Table 4 presents the base case results for the model. Initial costs were substantially greater for fusion compared to Coflex patients. Expected costs in the first year were determined to be $12,327 for Coflex patients and $24,233 for fusion patients. Over the 5-year follow-up horizon, expected costs were $15,182 and $26,863, respectively, for Coflex and fusion, an expected difference of $11,681.
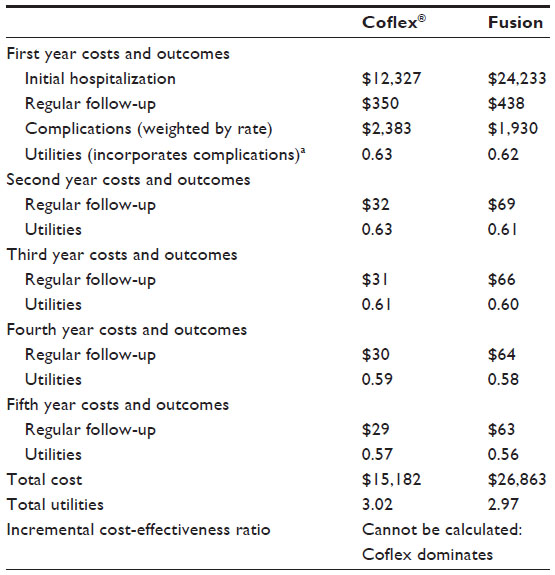 | Table 4 Model results: base case – Medicare |
Carrying the 24-month utility (derived from ODI) forward until the end of the observation period, discounting it by 3% annually, and weighting the frequency of complications in each group by the scores reported for patients experiencing specific complication, QALY over a 5-year period were estimated to be 3.02 for Coflex-treated patients and 2.97 for instrumented fusion patients.
Because Coflex patients were determined to have both lower average costs and higher average utilities over 5 years than those patients treated with fusion, there was no need to think about the comparison in terms of trade-offs between the costs and benefits of the investigational device via calculation of an ICER ratio; for Coflex, both the QALY and the costs were better than the comparator (fusion).
Subgroup analyses performed for subpopulations such as patients with one- vs two-level procedures and sensitivity analyses that explored clinical and cost parameters did not change the direction or magnitude of findings substantially (Table 5). Also, changing the discount rate had almost no effect because more than 75% of the cost for each cohort was attributed to the initial year, before any discounting would apply.
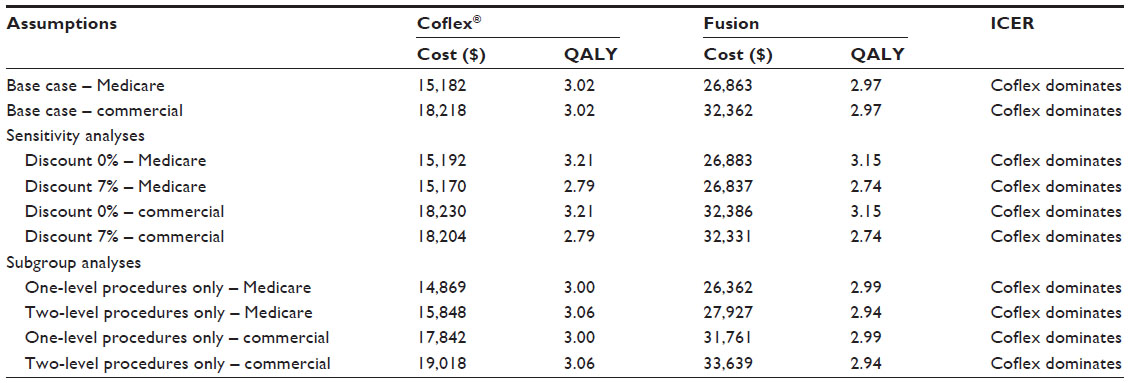 | Table 5 Model results and selected subgroup and sensitivity analyses |
Assuming Medicare payment rates and 3% discounting, threshold analyses revealed that Coflex could cost as much as $24,108 ($11,781 more than the current cost) and still be no more costly than instrumented fusion over the observation period. Similarly, fusion payments would need to be decreased to $12,542 (from the current $24,233 cost) in order to achieve the same 5-year costs as Coflex. Additional threshold analyses showed no reasonable scenario in which Coflex would not be cost effective compared to instrumented fusion. There is no reasonable scenario identified in sensitivity analyses of single or multiple model inputs in which Coflex would be more costly than fusion.
Discussion
While two recent publications have confirmed the safety and clinical equivalence of Coflex interlaminar stabilization compared to fusion,9,10 the current study is the first to report a substantial advantage in cost effectiveness with Coflex compared to fusion. The average index hospitalization savings among potential Medicare enrollees for a Coflex hospitalization compared with a fusion hospitalization was $11,096, while for private insurance the savings averaged $14,286. Over the 5-year follow-up period, costs were projected to be $15,182 for patients who received the Coflex procedure and $26,863 for patients who underwent a fusion, a difference of $11,681 per patient. At the same time, patient-reported utilities were observed to be slightly higher among Coflex patients. In short, Coflex stabilization achieves clinical equivalence with substantial cost savings compared with fusion.
This study has several limitations that should be considered when interpreting the results. The analysis is limited by the input assumptions that were required in order to develop the model. For example, while the trial outcomes were essential to determining the cost effectiveness of Coflex, a wider patient population might differ from a randomized clinical trial cohort. Further, the model uses clinical data from a 24-month analysis; while it is not anticipated that the rate of failures will change substantially during the following 3 years, for more accurate results, the model could be updated as more patients complete follow-up. Also, while some subgroup utility values were determined using small sample sizes, utility values determined in this study are similar to those determined in other studies of patients with chronic low back pain. Finally, although one of many standard cost sources available for purchase was used for commercial reimbursement rates, there may be differences compared with other such sources on the market.18–20
An important input to the model was utility values converted from ODI scores. Other studies evaluated costs using a published algorithm derived from a different reference population. For example, Suarez-Almazor et al reported mean values from 0.38 to 0.55 across the EQ-5D, the Health Utilities Index and visual analog scales.21 A recent report from SPORT that used the EQ-5D but examined the SF-6D in sensitivity analyses found that cost per QALY was lower with the EQ-5D. Therefore, findings may vary by the choice of utility assessment tool.8 Further, the SPORT protocol included evaluations of health states through 48 months after the intervention, and thus may have been able to capture longer-term variations that we could not identify in our analysis of 2-year data.8 Nonetheless, given the magnitude and direction of difference in cost between Coflex and fusion patients, even resetting all utilities to 1.0 does not result in a change in findings; Coflex continues to dominate with lower costs and equivalent utility values.
The cost and utility treatment group differences determined in this study are subject to various other uncertainties. The clinical endpoint used here was the same composite clinical success (CCS) endpoint used in the regulatory trial. In this trial, the CCS rates were 66.2% for patients implanted with the Coflex device and 57.7% for patients undergoing instrumented posterolateral fusion. The use of other individual endpoints to determine utilities, such as decrease of 15 points on the ODI score (85.8% of Coflex patients, 76.7% of fusion controls) or maintenance or improvement of the SF-12 physical component summary score (91.7% of Coflex patients and 82.9% of controls), would have produced different results. The panel of orthopedic experts that supplied guidance on treatment patterns suggested that patients may use a cane or walker for a period of time after surgery. Because these costs are highly variable due to differences in local coverage rates, we did not include them. However, given that the use of these assistive devices was expected to be higher and/or for longer periods among fusion patients, the decision not to include them is conservative.
Conclusion
The clinical and health insurance communities each have vested interest in identifying treatment options for moderate to severe LSS with and without spondylolisthesis that are both clinically beneficial and cost effective. This study found that over 5 years, treatment with Coflex resulted in important reductions in health care costs accompanied by utilities that were better than those experienced by patients treated with fusion. This finding was robust, and no reasonable sensitivity analysis scenario identified instrumented fusion as a cost-effective option compared to Coflex.
Acknowledgments
We thank Edmund Lau, MS, of Exponent for his analytic contribution to this manuscript. Portions of this work have been presented in poster form at the North American Spine Society 27th Annual Meeting (Dallas, TX, 2012) and the International Society of Pharmacoeconomics and Outcomes Research 18th Annual International Meeting (New Orleans, LA, 2013).
Author contributions
The initial framework and problem statement was developed by JKS, MH, and KO. JKS developed the model with input from KO. GM provided analytic support for model inputs. JKS drafted the manuscript; MH, GM, and KO provided critical input and approval of the final version.
Disclosure
Exponent received a research grant from Paradigm Spine, LLC (New York, NY, USA) through Musculoskeletal Clinical Regulatory Advisors (Washington, DC, USA). JKS and KO are employees of Exponent; MH is an employee of Paradigm Spine; GM is the owner of Biomedical Statistical Consulting. The authors report no other conflicts of interest in this work.
References
Kalichman L, Cole R, Kim DH, et al. Spinal stenosis prevalence and association with symptoms: the Framingham Study. Spine J. 2009;9(7):545–550. | |
North American Spine Society. Diagnosis and treatment of degenerative lumbar spinal stenosis. Burr Ridge (IL): North American Spine Society; 2011. | |
Bono CM, Vaccaro AR. Interspinous process devices in the lumbar spine. J Spinal Disord Tech. 2007;20(3):255–261. | |
Chen E, Tong KB, Laouri M. Surgical treatment patterns among Medicare beneficiaries newly diagnosed with lumbar spinal stenosis. Spine J. 2010;10(7):588–594. | |
Katz JN, Lipson SJ, Lew RA, et al. Lumbar laminectomy alone or with instrumented or noninstrumented arthrodesis in degenerative lumbar spinal stenosis. Patient selection, costs, and surgical outcomes. Spine (Phila Pa 1976). 1997;22(10):1123–1131. | |
Deyo RA, Mirza SK, Martin BI, Kreuter W, Goodman DC, Jarvik JG. Trends, major medical complications, and charges associated with surgery for lumbar spinal stenosis in older adults. JAMA. 2010;303(13):1259–1265. | |
Tosteson AN, Tosteson TD, Lurie JD, et al. Comparative effectiveness evidence from the spine patient outcomes research trial: surgical versus nonoperative care for spinal stenosis, degenerative spondylolisthesis, and intervertebral disc herniation. Spine (Phila Pa 1976). 2011;36(24):2061–2068. | |
Kuntz KM, Snider RK, Weinstein JN, Pope MH, Katz JN. Cost-effectiveness of fusion with and without instrumentation for patients with degenerative spondylolisthesis and spinal stenosis. Spine (Phila Pa 1976). 2000;25(9):1132–1139. | |
Davis R, Auerbach JD, Bae H, Errico TJ. Can low-grade spondylolisthesis be effectively treated by either coflex interlaminar stabilization or laminectomy and posterior spinal fusion? Two-year clinical and radiographic results from the randomized, prospective, multicenter US investigational device exemption trial: clinical article. J Neurosurg Spine. 2013;19(2):174–184. | |
Davis RJ, Errico TJ, Bae H, Auerbach JD. Decompression and Coflex interlaminar stabilization compared with decompression and instrumented spinal fusion for spinal stenosis and low-grade degenerative spondylolisthesis: two-year results from the prospective, randomized, multicenter, Food and Drug Administration Investigational Device Exemption trial. Spine (Phila Pa 1976). 2013;38(18):1529–1539. | |
Fairbank JC, Pynsent PB. The Oswestry Disability Index. Spine. 2000;25(22):2940–2952. | |
Carreon LY, Glassman SD, McDonough CM, Rampersaud R, Berven S, Shainline M. Predicting SF-6D utility scores from the Oswestry disability index and numeric rating scales for back and leg pain. Spine (Phila Pa 1976). 2009;34(19):2085–2089. | |
Auerbach JD, McGowan KB, Halevi M, et al. Mitigating adverse event reporting bias in spine surgery. J Bone Joint Surg Am. 2013;95(16):1450–1456. | |
Auerbach JD, Ong KL, Lau E, Ochoa J, Schmier JK, Zigler JD. Perioperative outcomes, complications, and costs associated with lumbar spinal fusion in older patients with spinal stenosis and spondylolisthesis: analysis of the United States Medicare claims database. Value in Health. 2012;15(4):A3. | |
Centers for Medicare & Medicaid Services. CMS-1590-CN, and CMS-1590-P. Available at: http://www.cms.gov/Medicare/Medicare-Fee-for-Service-Payment/PhysicianFeeSched/PFS-Federal-Regulation-Notices-Items/CMS-1590-FC.html?DLPage=1&DLSort=3&DLSortDir=descending. Accessed 25 February 2014. | |
IPPS: Centers for Medicare and Medicaid Services. 2013 Inpatient Prospective Payment System Final Rule. CMS-1588-F, CMS-1588-CN2, CMS-1588-F2, CMS-1588-CN3, and CMS-1588-N, CMS-1588-CN4. Available at http://www.cms.gov/Medicare/Medicare-Fee-for-Service-Payment/AcuteInpatientPPS/FY-2013-IPPS-Final-Rule-Home-Page-Items/CMS-1588-F-Text-Version.html?DLPage=1&DLSort=0&DLSortDir=ascending. Accessed 11 February 2014. | |
CPT 2013 Professional Edition, 2012 American Medical Association (AMA); CPT is a trademark of the AMA. Available at: http://www.ama-assn.org/ama/pub/physician-resources/solutions-managing-your-practice/coding-billing-insurance/cpt.page. Accessed 25 February 2014. | |
Wasserman Medical Publishers. Physicians’ Fee Reference. Wasserman Medical Publishers; Milwaukee, WI, 2011. | |
MAG Mutual Healthcare Solutions Inc. Physicians Fee and Coding Guide. Augusta, GA: MAG Mutual Healthcare Solutions; 2011. | |
FAIR Health. FH Benchmark data. Available from: http://www.fairhealth.org/Research. Accessed February 11, 2011. | |
Suarez-Almazor ME, Kendall C, Johnson JA, Skeith K, Vincent D. Use of health status measures in patients with low back pain in clinical settings. Comparison of specific, generic and preference-based instruments. Rheumatology (Oxford). 2000;39(7):783–790. |
 © 2014 The Author(s). This work is published and licensed by Dove Medical Press Limited. The
full terms of this license are available at https://www.dovepress.com/terms
and incorporate the Creative Commons Attribution
- Non Commercial (unported, 3.0) License.
By accessing the work you hereby accept the Terms. Non-commercial uses of the work are permitted
without any further permission from Dove Medical Press Limited, provided the work is properly
attributed. For permission for commercial use of this work, please see paragraphs 4.2 and 5 of our Terms.
© 2014 The Author(s). This work is published and licensed by Dove Medical Press Limited. The
full terms of this license are available at https://www.dovepress.com/terms
and incorporate the Creative Commons Attribution
- Non Commercial (unported, 3.0) License.
By accessing the work you hereby accept the Terms. Non-commercial uses of the work are permitted
without any further permission from Dove Medical Press Limited, provided the work is properly
attributed. For permission for commercial use of this work, please see paragraphs 4.2 and 5 of our Terms.