Back to Journals » Patient Preference and Adherence » Volume 10
Communication of laboratory data and diagnostic test results to hospitalized patients: a study of preferences and recall
Authors Athar M, Mativo C, Landis R, Wright S
Received 22 April 2016
Accepted for publication 6 June 2016
Published 29 July 2016 Volume 2016:10 Pages 1409—1413
DOI https://doi.org/10.2147/PPA.S111190
Checked for plagiarism Yes
Review by Single anonymous peer review
Peer reviewer comments 3
Editor who approved publication: Dr Johnny Chen
Muhammad W Athar,1 Christine Mativo,1 Regina Landis,2 Scott M Wright1
1Department of Medicine, Johns Hopkins University School of Medicine, 2Division of Hospital Medicine, Johns Hopkins Bayview Medical Center, Baltimore, MD, USA
Objective: To assess patients’ preferences with respect to different methods of receiving test results while they were hospitalized and to determine whether the different modes of communication of the test results were associated with better recall.
Methods: Five discrete test results were shared with adult inpatients on general medicine service (blood pressure, white blood cell count, hematocrit, creatinine, and chest X-ray). The information was delivered by a physician in one of three ways: 1) verbally, 2) explained with a print out of the results, or 3) described while showing results on a computer monitor (electronic). The same physician returned within 3 hours to assess recall and satisfaction with the way patients received their results.
Results: All the patients (100%) receiving their results in written format were satisfied with the mode of communication as compared to electronic format (86%) or verbally (79%) (P=0.02). Fifty percent of patients in the computer format group could recall four or more test results at the follow-up, as compared to 43% in printed group and 24% who were informed of their results verbally (P=0.35).
Conclusion: Patients most appreciated receiving test results in written form while in the hospital, and this delivery method was as good as any other method with respect to recall.
Keywords: patient preference, patient satisfaction, patient-centered care
Introduction
Physician–patient communication is at the heart of effective health care. Part of this communication involves informing patients of their laboratory and diagnostic test results. Failure to inform may lead to poor understanding of illness and patient dissatisfaction. Meza and Webster1 found that an overwhelming majority of patients prefer to receive test results, regardless of whether the results were normal or abnormal. Ross and Lin2 discovered that most outpatients wish to receive normal results mailed to them and would like a direct phone call regarding abnormal results. Litchfield et al3,4 found that patients preferred receiving results from the ordering primary care physician without delay, as they were less comfortable receiving results from a nonclinical staff member. How best to share test results with hospitalized patients is not clear, and their preferences have not been studied. Patient-centered care5–7 and shared decision making8–10 make it necessary for patients to be educated about their medical conditions, and test results should thus be shared as they become available.
Patients admitted to our hospitals undergo numerous laboratory, radiologic, and other tests, and it can be difficult for them to keep track of all the results. Many patients have a hard time explaining to family and friends why they are in the hospital and what their physicians have discovered.11 Not only is patients’ preferred way of learning about their results while hospitalized not known but it is also unclear which method is associated with the greatest recall. Therefore, we conducted this study to learn patients’ preferences and to discover the method that is most closely associated with enhanced retention.
Methods
Study design and setting
A randomized educational trial was conducted as a pilot study in early 2014 at Johns Hopkins Bayview Medical Center, a 477-bed academic medical center in Baltimore. At our hospital, there was no portal for patients to access and view inpatient test results throughout the study period.
Subjects
The study’s research assistant screened our proprietary electronic patient tracking and sign-out system to identify potential research subjects who were on the second day of their admission to the hospital on one of our general medicine units. English-speaking patients >18 years of age who were alert, oriented, and able to answer questions (without communication barriers, specifically dementia or delirium) were approached with hopes of obtaining informed consent for participation in this study. Baseline demographic information was collected only if informed consent was provided. Other exclusion criteria included hemodynamic instability and other communication impairments – including deafness, blindness, or aphasias.
Intervention
Consenting patients were randomly assigned to one of the three groups, via a computer-generated random numbers program (www.researchrandomizer.org). After assignment, a physician on the study team (CM) approached each patient to deliver their test results. All patients were notified about five specific test results that are commonly measured among hospitalized patients: blood pressure, white blood cell (WBC) count, hematocrit, creatinine, and chest X-ray.
In group 1, the physician verbally recounted each test result and what it indicates (eg, high WBC count may be a marker of infection, low hemoglobin indicates anemia, or a low red blood cell count). In group 2, the physician explained the test results (as in group 1) and gave a print out of the results. Results were given to patients on a customized “results sheet” (with numerical values for blood pressure, WBC, hemoglobin, and creatinine, and overall impression for the chest X-ray) designed specifically for this study. The results sheet used arrows, bold font, and written explanations of the patients’ results relative to the expected normal values. In group 3, the physician showed the results electronically on a computer screen by taking a workstation on wheels to patient’s bedside and logging in to medical center’s electronic medical record (MEDITECH, Westwood, MA, USA). On the monitor, abnormal results were highlighted, and high or low was written next to these values. The chest X-ray images were loaded on the hospital’s Picture Archiving and Communications System and shown to the patient at bedside with explanation by the physician whether the image was normal or abnormal. If the image was abnormal, further clarification was provided (eg, pneumonia, cardiomegaly). Those with email addresses also had the results emailed to them.
In all three groups, information about what the test addressed, why it was performed, and whether their results were normal or abnormal was explained and emphasized. If the patient had questions, these were patiently answered.
Data collection
After 1 hour and within 3 hours of being informed of their five test results using one of the three methods (timing was variable depending on when the patient was available in their hospital room), the same physician returned to assess recall of the tests performed and the patient’s results. The study team decided to assess recall later on the same day on which test results were delivered because the tests that we examined are often ordered daily and may vary from one day to the next. The first portion of the survey asked patients to describe what they recalled of the five test results (both the names of the tests [or what they measure] and whether their result was normal or abnormal). If patients could not recall a test, they were reminded of the name of the test and then asked if they remembered their result. Accurate recall was defined as the ability to state whether the results of a specific test were normal or abnormal (blood pressure was low, normal, or high; WBC was low, normal, or high; hematocrit was low, normal, or high; kidney function was normal, moderately decreased, or severely decreased; and chest X-ray was normal, abnormal, or was not done).
The second portion of the survey inquired about patients’ satisfaction with the method of test result delivery, using a Likert scale with the response options being “very dissatisfied”, “somewhat dissatisfied”, “neither satisfied nor dissatisfied”, “somewhat satisfied”, and “very satisfied”. Patients choosing either of the last two options were deemed “satisfied” with the mode of notification. Finally, one open-ended question asked patients about their preferences for being notified of test results.
The study protocol was reviewed and approved by Johns Hopkins University Institutional Review Board.
Data analysis
After data collection, all data were deidentified. We analyzed the data from the surveys about preferences and recall using descriptive statistics, chi-square, and Fisher’s exact tests, where appropriate. Statistical significance was defined as P<0.05. All statistical analyses were done using STATA 11 (StataCorp LP, College Station, TX, USA).
All narrative comments related to patients’ preferences were analyzed using standard qualitative analytic methodology with an editing style approach. Two authors independently categorized patients’ qualitative comments into themes. Comparisons of the coding were made, and disagreements were resolved by discussions until consensus was reached.
Results
Among the 106 eligible patients, 87 consented to participate and completed all parts of the study. Nine patients were ineligible due to exclusion criteria, and ten refused to participate. The majority of the patients studied were female (54%), and participants’ mean age was 53.5 years. Seventy-three percent of patients had at least a high school education. A majority of the patients (54%) had an annual income of <$20,000, and most of them (84%) were followed by primary care physicians (Table 1). Those who declined to participate were of a similar sex composition to the participants (P>0.05).
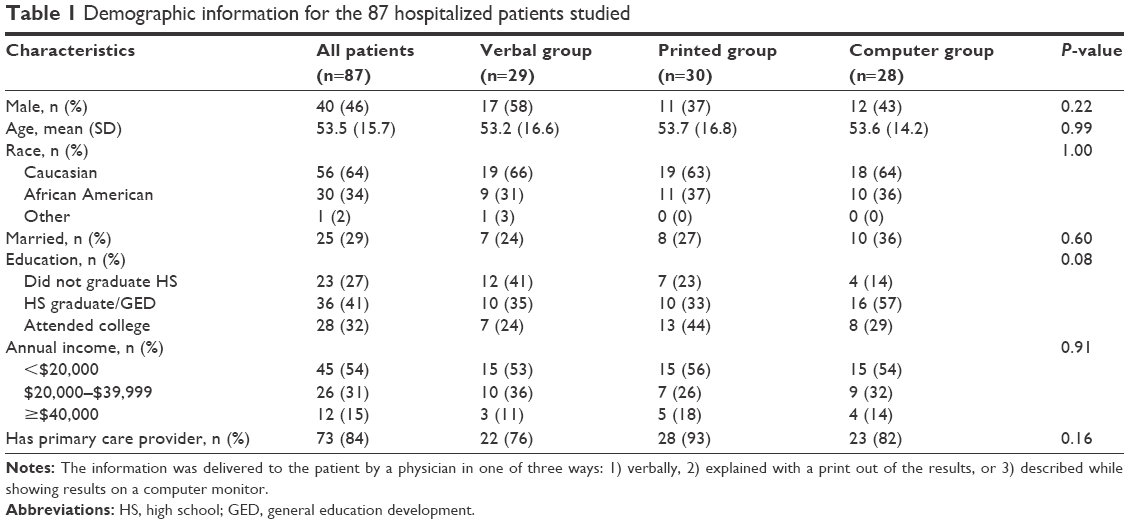 | Table 1 Demographic information for the 87 hospitalized patients studied |
Recall
With respect to remembering the names and types of tests that the patients had been told about earlier, the lowest proportion able to name all five tests were those whose data were presented verbally (17%, compared to ~30% for the written and electronic delivery). In fact, seven of 29 patients who received their test results verbally could not recall the name of any of the tests. Ability to name three or more tests was highest (71%) among those informed of their results with the aid of the computer (Table 2).
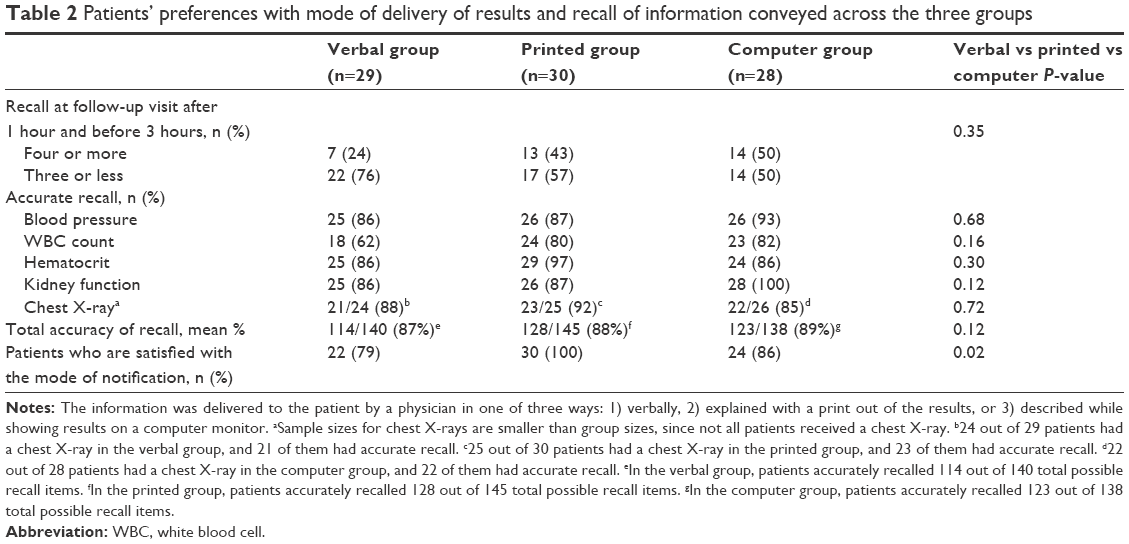 | Table 2 Patients’ preferences with mode of delivery of results and recall of information conveyed across the three groups |
As for accuracy of remembering their results within 1–3 hours, patients notified by each of the three methods were similarly able to correctly recall their test results across all five categories (Table 2). The highest accuracy was 100% for kidney function among those who were showed the results electronically on a computer, while the lowest accuracy was 62% for WBC count among those who were told the results verbally. There were no significant differences in accuracy of recall of results across the three delivery methods (all P>0.05). There were also no significant differences in the accuracy of recall of test results among patients presenting with a problem related to one of these tests (eg, patients with anemia did not have better recall of hematocrit results, patients with pneumonia did not have better recall of the results of chest X-ray, and patients with acute renal insufficiency did not have better recall of their creatinine results, all P>0.05).
Patients’ preferences
One hundred percent of the patients who were notified of their results in written format were satisfied with the way the results were delivered as compared to those who were notified verbally (79%) and by computer (86%) (P=0.02).
Patients were asked open-endedly if they had any comments. From the qualitative analysis of the patients’ comments, two themes emerged: “dissatisfaction with current methods of result notification” and “preference for a pictorial way to be shown results”.
From the first theme, a couple of representative comments from unique patients include:
I do not know what tests are done or the results. Patients are the last to know, if they ever find out. [55-year-old woman admitted with right shoulder pain, verbal group]
Usually when I ask, I am just told that most of my results are okay. [44-year-old man admitted with lower extremity cellulitis, printed group]
Exemplary perspectives related to the preferences for pictorial visual aids were:
My memory is small; it’s nice to have something to look at. [77-year-old man admitted with syncope, printed group]
It was nice looking at my chest X-ray. [78-year-old woman admitted with syncope, computer group]
Something visible would be best, like either a printout of my results or seeing them on the computer. [52-year-old woman admitted with pancreatitis, verbal group]
I like written. I don’t remember a lot but with written, I can look back, make a folder, avoid duplicate studies, and take them to my usual doctor. [60-year-old woman admitted with hepatic encephalopathy, printed group]
When I see something, it makes more sense to me. [77-year-old man admitted with pyelonephritis, computer group]
Discussion
Physician–patient communication forms the foundation of an effective patient–physician relationship. Patients value communication of test results in a timely fashion, preferably from their treating clinician, and they are generally dissatisfied with the current systems of result notification.4 Disclosing test results to patients in a way that can be understood and remembered may allow for shared decision making with our patients.12 If this is not done, patient-centered care may never be realized.13 During inpatient stays, proportionately more tests are performed for patients over a shorter period of time compared to any other interface with the health care system. This is done at a time when patients are acutely ill and may not be optimally able to understand, retain, or recall the information due to stress, worry, or fear. Increased volume and complexity of data increase the chances of ineffective communication and limited understanding, even among those with reasonable health literacy.
The patients we surveyed unanimously agreed that verbal sharing of test results is the least appreciated way of being notified of results. Nonetheless, while there is no research to support this assertion, we surmise that this may be the most commonly used method used at our nation’s hospitals.14 Supplementing the data sharing with printed results or computer-based pictorials would appear to respect patients’ preferences, thereby facilitating the patient-centeredness of the care15 and perhaps even shared decision making.16,17 Our study results suggest that written communication was optimal for recall of both what tests were done and what the tests showed.
Despite the statistically significant difference in patients’ preference regarding the mode in which they received test results, overall recall at follow-up did not differ statistically significantly. However, we were surprised to see the high retention rate of >80% for each mode of communication. This could be due to relatively young patient population enrolled in our study or because we assessed recall within 3 hours after the information was given rather than assessing delayed recall. The solid recollection may also be attributed to the manner in which we presented the information, which was very structured. Further, we asked patients to recall a straightforward fact, normal versus abnormal, rather than the more specific number associated with the test or magnitude of the abnormality.
Several limitations of this study should be considered. First, it is a single-center study at an academic medical center, and our results may not be generalizable to other settings. Second, we only surveyed patients on the general medicine service, and patients admitted under other services may have preferred to receive information in a different way. Third, we excluded the patients who were non-English speaking or had communication barriers. Fourth, it is possible that some patients had already received these test results from their treating physicians. At the time of the study, our hospital does not have a policy or strategy to universally and effectively share test results with the patients. Finally, the sample size was not large in this pilot, and it is possible that some comparisons might have reached statistical significance if the sample size had been larger.
Conclusion
Patients most appreciated receiving test results in written form while in the hospital, and this delivery method was as good as any other method with respect to recall. Patient-centered communication would certainly involve notifying patients of their test results by their preferred method. Such flexibility would respect the unique needs and preferences of all individuals. Doing so might improve patient satisfaction with their physician and the care that they are receiving. Presenting hospitalized patients with their test results daily by their preferred method may result in improved satisfaction with care and perhaps a better understanding of their illness.
Acknowledgments
Doctor Wright is a Miller-Coulson Family Scholar, and this support comes from Hopkins Center for Innovative Medicine.
Disclosure
The authors report no conflicts of interest in this work.
References
Meza JP, Webster DS. Patient preferences for laboratory test results notification. Am J Manag Care. 2000;6(12):1297–1300. | ||
Ross SE, Lin C-T. The effects of promoting patient access to medical records: a review. J Am Med Inform Assoc. 2003;10(2):129–138. | ||
Litchfield I, Bentham L, Lilford R, McManus RJ, Hill A, Greenfield S. Test result communication in primary care: a survey of current practice. BMJ Qual Saf. 2015;24(11):691–699. | ||
Litchfield IJ, Bentham LM, Lilford RJ, McManus RJ, Greenfield SM. Patient perspectives on test result communication in primary care: a qualitative study. Br J Gen Pract. 2015;65(632):e133–e140. | ||
IOM (Institute of Medicine). Crossing the Quality Chasm: A New Health System for the 21st Century. Washington, DC: National Academy Press; 2001. | ||
Moura Jde A, Costa BC, de Faria RMD, Soares TF, Moura EP, Chiappelli F. Improving communication skill training in patient centered medical practice for enhancing rational use of laboratory tests: the core of bioinformation for leveraging stakeholder engagement in regulatory science. Bioinformation. 2013;9(14):718–720. | ||
LaVela SL, Schectman G, Gering J, Locatelli SM, Gawron A, Weaver FM. Understanding health care communication preferences of veteran primary care users. Patient Educ Couns. 2012;88(3):420–426. | ||
Mead N, Bower P. Patient-centredness: a conceptual framework and review of the empirical literature. Soc Sci Med. 2000;51(7):1087–1110. | ||
Cooper LA, Roter DL, Carson KA, et al. A randomized trial to improve patient-centered care and hypertension control in underserved primary care patients. J Gen Intern Med. 2011;26(11):1297–1304. | ||
Audet A-M, Davis K, Schoenbaum SC. Adoption of patient-centered care practices by physicians: results from a national survey. Arch Intern Med. 2006;166(7):754–759. | ||
Makaryus AN, Friedman EA. Patients’ understanding of their treatment plans and diagnosis at discharge. Mayo Clin Proc. 2005;80(8):991–994. | ||
Greenfield S, Kaplan S, Ware JE. Expanding patient involvement in care. Effects on patient outcomes. Ann Intern Med. 1985;102(4):520–528. | ||
Sherbourne CD, Hays RD, Ordway L, DiMatteo MR, Kravitz RL. Antecedents of adherence to medical recommendations: results from the medical outcomes study. J Behav Med. 1992;15(5):447–468. | ||
Kessels RPC. Patients’ memory for medical information. J R Soc Med. 2003;96(10):520. | ||
Laine C, Davidoff F. Patient-centered medicine a professional evolution. JAMA. 1996;275(2):152–156. | ||
Charles C, Gafni A, Whelan T. Shared decision-making in the medical encounter: what does it mean? (or it takes at least two to tango). Soc Sci Med. 1997;44(5):681–692. | ||
Golin CE, DiMatteo MR, Gelberg L. The role of patient participation in the doctor visit. Implications for adherence to diabetes care. Diabetes Care. 1996;19(10):1153–1164. |
 © 2016 The Author(s). This work is published and licensed by Dove Medical Press Limited. The
full terms of this license are available at https://www.dovepress.com/terms
and incorporate the Creative Commons Attribution
- Non Commercial (unported, 3.0) License.
By accessing the work you hereby accept the Terms. Non-commercial uses of the work are permitted
without any further permission from Dove Medical Press Limited, provided the work is properly
attributed. For permission for commercial use of this work, please see paragraphs 4.2 and 5 of our Terms.
© 2016 The Author(s). This work is published and licensed by Dove Medical Press Limited. The
full terms of this license are available at https://www.dovepress.com/terms
and incorporate the Creative Commons Attribution
- Non Commercial (unported, 3.0) License.
By accessing the work you hereby accept the Terms. Non-commercial uses of the work are permitted
without any further permission from Dove Medical Press Limited, provided the work is properly
attributed. For permission for commercial use of this work, please see paragraphs 4.2 and 5 of our Terms.