Back to Journals » International Journal of Nanomedicine » Volume 11
Combination of salinomycin and silver nanoparticles enhances apoptosis and autophagy in human ovarian cancer cells: an effective anticancer therapy
Authors Zhang X, Gurunathan S ![]()
Received 24 April 2016
Accepted for publication 1 June 2016
Published 2 August 2016 Volume 2016:11 Pages 3655—3675
DOI https://doi.org/10.2147/IJN.S111279
Checked for plagiarism Yes
Review by Single anonymous peer review
Peer reviewer comments 2
Editor who approved publication: Dr Thomas Webster
Xi-Feng Zhang,1 Sangiliyandi Gurunathan2
1College of Biological and Pharmaceutical Engineering, Wuhan Polytechnic University, Wuhan, People’s Republic of China; 2Department of Stem Cell and Regenerative Biology, Konkuk University, Seoul, South Korea
Abstract: Ovarian cancer is one of the most important malignancies, and the origin, detection, and pathogenesis of epithelial ovarian cancer remain elusive. Although many cancer drugs have been developed to dramatically reduce the size of tumors, most cancers eventually relapse, posing a critical problem to overcome. Hence, it is necessary to identify possible alternative therapeutic approaches to reduce the mortality rate of this devastating disease. To identify alternative approaches, we first synthesized silver nanoparticles (AgNPs) using a novel bacterium called Bacillus clausii. The synthesized AgNPs were homogenous and spherical in shape, with an average size of 16–20 nm, which are known to cause cytotoxicity in various types of human cancer cells, whereas salinomycin (Sal) is able to kill cancer stem cells. Therefore, we selected both Sal and AgNPs to study their combined effect on apoptosis and autophagy in ovarian cancer cells. The cells treated with either Sal or AgNPs showed a dose-dependent effect with inhibitory concentration (IC)-50 values of 6.0 µM and 8 µg/mL for Sal and AgNPs, respectively. To determine the combination effect, we measured the IC25 values of both Sal and AgNPs (3.0 µM and 4 µg/mL), which showed a more dramatic inhibitory effect on cell viability and cell morphology than either Sal or AgNPs alone. The combination of Sal and AgNPs had more pronounced effect on cytotoxicity and expression of apoptotic genes and also significantly induced the accumulation of autophagolysosomes, which was associated with mitochondrial dysfunction and loss of cell viability. Our data show a strong synergistic interaction between Sal and AgNPs in tested cancer cells. The combination treatment increased the therapeutic potential and demonstrated the relevant targeted therapy for the treatment of ovarian cancer. Furthermore, we provide, for the first time, a mode of action for Sal and AgNPs in ovarian cancer cells: enhanced apoptosis and autophagy.
Keywords: apoptosis, autophagy, cell viability, caspase activity, ovarian cancer, salinomycin, silver nanoparticles
Introduction
Ovarian cancer is diagnosed almost in a quarter of a million women globally each year. It remains a leading cause of death from a gynecological malignancy with >140,000 deaths each year, and it shows the highest mortality rate of all gynecological cancers (http://globocan.iarc.fr).1 In the US, ~20,000 women get ovarian cancer per year, and it is the eighth most common cancer and the fifth leading cause of cancer death (United States Cancer Statistics: 1999–2012 Incidence and Mortality Web-based Report).2 The high mortality rate of ovarian cancer is due to the lack of early detection and chemoresistance during treatment.3,4 The successful treatment of cancer is a tedious process due to multidrug resistance (MDR) and/or apoptosis resistance to chemotherapy, which are frequently obtained by various mechanisms.5 Recent studies suggest that a small subset of distinct cells termed cancer stem cells (CSCs) are responsible for tumor initiation and propagation. CSCs are capable of self-renewal, tumor initiation, invasion, metastasis, and therapeutic resistance.6–9
Recently, ovarian cancer seems to have high mortality rates, and therapeutic approaches for ovarian cancer are found to be ineffective in the treatment of solid tumors due to the increased resistance of CSCs.10,11 Therefore, it is necessary to develop novel therapeutic modalities to eliminate CSCs for successful treatment. One possible approach is targeting of tumor-initiating CSCs.11 Recently, salinomycin (Sal) has been identified as a highly effective chemical in the elimination of CSCs in a high-throughput screen.12 Among the 16,000 small-molecule chemicals studied, Sal was 100 times more effective than paclitaxel.12
Sal is one of the monocarboxylic ionophores isolated from Streptomyces albus;13 it is used as an antibacterial and anticoccidial drug.14,15 Sal acts as an ionophore and promotes the transfer of cations across biological membranes via an exchange diffusion mechanism.16,17 Recently, Sal has been used to inhibit the growth of tumor stem cells and chemoresistant cancer cells.12,18–20 Sal functions as an efflux pump P-glycoprotein inhibitor and is considered to be a potential anticancer drug for cancer chemoprevention.21–23 Several studies reported that Sal potentially induces the toxicity of CSCs from many cancers, including gastrointestinal sarcoma, osteosarcoma, colorectal, and breast.19,24–26 Sal has been reported to selectively deplete human breast CSCs from tumorspheres and to inhibit the mammary tumor growth and metastasis in vivo.12 The activation of apoptotic pathways by Sal is independent of p53 and caspase activation, and it has been shown that Sal can sensitize cancer cells by reducing p21 levels.18,27 Sal induces apoptosis in various cancer cell lines through cell cycle arrest and reactive oxygen species (ROS)-mediated mitochondrial pathways. It also induces cell death by overcoming ABC transporter-mediated multidrug and apoptosis resistance in MDR cancer cells.21,27,28 Sal causes concentration- and time-dependent reduction in the viability of LNM35 and A549 cells through a caspase-3/7-associated cell death pathway. Similarly, Sal treatment at a concentration of 2.5–5 μM for 7 days significantly decreases the growth of human lung cancer cell lines, LNM35 and A549 colonies, in soft agar.29 Sal induces not only apoptosis but also autophagy in human cancer cells, via the generation of ROS and activation of endoplasmic reticulum stress.30,31
Silver nanoparticles (AgNPs) are one of the nanomaterials with the highest degree of commercialization.32,33 AgNPs have been extensively used as antibacterial agents in the health industry and biomedical applications, and also as antiangiogenic34 and anticancer agents.35,36 AgNPs are known to induce cytotoxicity via apoptosis and necrosis in different cell lines, and they are important for cytotoxicity, inflammation, and genotoxicity.37 Previously, several studies reported the inhibitory effects of AgNPs on human glioblastoma cells, human breast cancer cells, and NIH3T3 cells. These effects were mediated by enhanced generation of ROS, disruption of normal cellular function, perturbation of the membrane integrity, and induction of various apoptotic signaling pathways.36,38–43 AgNPs inhibit the growth and viability of HCT116 colon cancer cells by increasing the level of p53, p21, and caspases 3, 8, and 9 and by decreasing the levels of AKT and NF-κB.44 Therefore, AgNPs could be bona fide anticancer agents. Based on the literature, Sal targets cancer-initiating cells (CSCs) that are resistant to conventional therapies.45 The mode of entry and the mechanism of action of AgNPs are well known in cancer cells compared to other metal nanoparticles. Based on the abovementioned evidence, we selected AgNPs as another active substitute molecule to test the effect of anticancer activity in the combined treatment with Sal. To overcome drug resistance and reduce drug toxicity and sensitivity, this study was designed with the following objectives: 1) to evaluate the biological effect of Sal alone or in combination with AgNPs in human ovarian cancer cell line A2780 and 2) to investigate the mechanism of action of Sal alone or in combination with AgNPs in human ovarian cancer cell line A2780.
Materials and methods
Materials
Penicillin–streptomycin solution, trypsin-EDTA solution, Dulbecco’s Modified Eagle’s Medium (DMEM), RPMI 1640 medium, and 1% antibiotic–antimycotic solution were obtained from Thermo Fisher Scientific (Waltham, MA, USA). Sal, silver nitrate, fetal bovine serum, and the In Vitro Toxicology Assay Kit were purchased from Sigma-Aldrich Co. (St Louis, MO, USA). Antibodies against pro-caspase-3 were purchased from Cell Signaling Technology (Beverly, MA, USA). All other chemicals were purchased from Sigma-Aldrich Co., unless otherwise stated.
Synthesis and characterization of AgNPs
AgNPs were synthesized and characterized according to Gurunathan et al.42,46 The culture supernatant of Bacillus clausii was incubated with AgNO3 solution at a concentration of 5 mM for 6 hours. AgNPs were characterized as described earlier.46 The synthesized AgNPs were dissolved in double distilled water and stored at room temperature.
Cell viability assay
The water soluble tetrazolium salts (WST)-8 assay was performed as described earlier.42 Typically, 2×10⁵ cells were seeded in a 96-well plate and cultured in standard DMEM supplemented with 10% fetal bovine serum at 37°C under 5% CO2. After 24 hours, the cells were washed twice with 100 μL of serum-free DMEM and incubated with 100 μL of media containing Sal (0–20 μM) or AgNPs (0–20 μg/mL) for 24 hours. The cells that were not exposed to Sal or AgNPs served as controls. After 24 hours of exposure, the cells were washed twice with serum-free DMEM, and 15 μL of WST-8 solution was added to each well containing 100 μL of serum-free DMEM. After 1 hour of incubation at 37°C under 5% CO2, 80 μL of the mixture was transferred to another 96-well plate. The absorbance of the mixture solutions was measured at 450 nm using a microplate reader.
Cell morphology
Ovarian cancer cells were plated in six-well plates (2×10⁵ cells/well) and incubated with 3 μM Sal or 4 μg/mL AgNPs for 24 hours. Cells cultured in medium without the addition of Sal or AgNPs were used as the control. The cell morphology was analyzed using an optical microscope at 24 hours posttreatment. The morphology of the cells was examined with an OLYMPUS IX71 microscope (Olympus Corporation, Tokyo, Japan) using the appropriate filter sets.
Cytotoxicity assay
The cell membrane integrity of the human ovarian cancer cells was evaluated by determining the release of lactate dehydrogenase (LDH) from the cells, according to the manufacturer’s instructions (In Vitro Toxicology Assay Kit, TOX7) and as described earlier.36,43 Briefly, the cells were exposed to the respective concentrations of Sal (3 μM) or AgNPs (4 μg/mL) or the combination of Sal and AgNPs for 24 hours, and then LDH was measured.
ROS were estimated according to a method described earlier.36,43 The cells were seeded in 24-well plates at a density of 5×10⁴ cells/well and cultured for 24 hours. After washing twice with phosphate-buffered saline (PBS), fresh media containing respective concentrations of Sal (3 μM), AgNPs (4 μg/mL), or both Sal and AgNPs were added and incubated for 24 hours. The cells were then supplemented with 20 μM DCFH-DA, and the incubation continued for 30 minutes at 37°C. The cells were rinsed with PBS, where 2 mL of PBS was added to each well, and the fluorescence intensity was determined using a spectrofluorometer (Gemini EM, Molecular devices, Sunnyvale, CA, USA) with excitation at 485 nm and emission at 530 nm.
Measurement of oxidative stress markers
For oxidative stress markers, such as malondialdehyde (MDA), glutathione (GSH), superoxide dismutase (SOD), and catalase (CAT), the assays were performed according to the manufacturer’s instructions for the reagent kits (Sigma-Aldrich Co.). Briefly, the cells were cultured in 75 cm2 culture flasks and exposed to Sal (3 μM), AgNPs (4 μg/mL), or Sal and AgNPs for 24 hours, and then the cells were harvested in chilled PBS by scraping and washed twice with 1× PBS at 4°C for 6 minutes at 1,500 rpm. The cell pellet was sonicated at 15 W for 10 seconds (three cycles) to obtain the cell lysate, and the resulting supernatant was stored at 70°C until analyzed.
Mitochondrial membrane potential
The mitochondrial membrane potential (MMP) was measured as described earlier47–49 using a cationic fluorescent indicator JC-1 (Molecular Probes, Eugene, OR, USA). JC-1 is a lipophilic cation, which, in a reaction driven by ΔΨm in normal polarized mitochondria, assembles into a red fluorescence-emitting dimer forming JC-1 aggregates. Cells were incubated with 10 μM JC-1 at 37°C for 15 minutes, washed with PBS, and resuspended in PBS, and then the fluorescence intensity was measured. MMP was expressed as the ratio of the fluorescence intensity of the JC-1 aggregates to monomers.
Extraction and amplification of mRNA
Total RNA was extracted from cells treated with Sal (6 μM), AgNPs (6 μg/mL), or Sal and AgNPs for 24 hours using the Arcturus Picopure RNA Isolation Kit (eBioscience, San Diego, CA, USA), and samples were prepared according to the manufacturer’s instructions. Real-time reverse transcription polymerase chain reaction (RT-PCR) was conducted using a Vill7 (Thermo Fisher Scientific) and SYBR Green as the double-stranded DNA-specific fluorescent dye (Thermo Fisher Scientific). Target gene expression levels were normalized to GAPDH expression, which was unaffected by the treatment. The RT-PCR primer sets are shown in Table 1. Real-time RT-PCR was performed independently in triplicate for each of the different samples; the data are presented as mean values of gene expression measured in treated sample vs control.
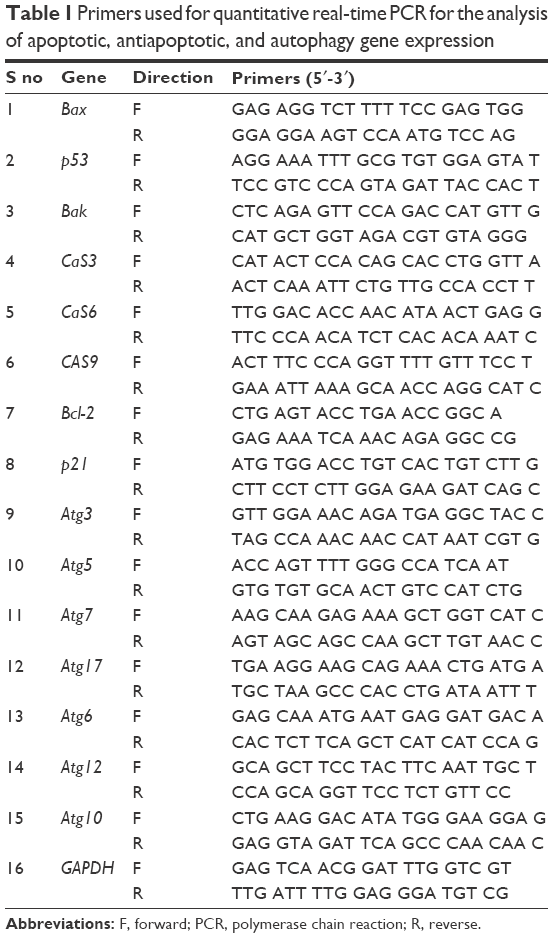 | Table 1 Primers used for quantitative real-time PCR for the analysis of apoptotic, antiapoptotic, and autophagy gene expression |
Measurement of caspase-3 activity and TUNEL assay
The measurement of caspase-3 and TUNEL assay were performed according to the method described earlier.35,36,42 The cells were treated with Sal (3 μM), AgNPs (4 μg/mL), or both Sal and AgNPs with the addition of caspase-3 inhibitor for 24 hours. The activity of caspase-3 was measured in the cancer cells using a kit from Sigma-Aldrich Co. according to the manufacturer’s instructions.
Apoptotic cells were assayed using a DNA Fragmentation Imaging Kit (Hoffman-La Roche Ltd., Basel, Switzerland) following the manufacturer’s instruction. After the incubation period, the culture medium was aspirated, and the cell layers were trypsinized. The trypsinized cells were reattached on 0.01% polylysine-coated slides, fixed with 4% methanol-free formaldehyde solution, and stained according to the manufacturer’s instructions for the TUNEL protocol.
Statistical analyses
All assays were conducted in triplicate, and each experiment was repeated at least three times. The results are presented as mean ± standard deviation. All the experimental data were compared using the Student’s t-test. A P-value <0.05 was considered statistically significant.
Results and discussion
Synthesis and characterization of AgNPs
AgNPs were prepared according to a method described earlier.46 Particularly to produce smaller AgNPs, 5 mM AgNO3 was added to culture supernatant of B. clausii and incubated for 6 hours at 60°C, pH 8.0. Synthesis was confirmed by visual observation of the culture supernatant and AgNO3.50 The appearance of a brown color suggested the formation of AgNPs.46 The characterization of synthesized nanoparticles is an important aspect for nanoparticle applications. Therefore, we used several analytical techniques. The ultraviolet–visible spectra showed maximum absorbance between 400 nm and 420 nm (Figure 1A), and the peaks were observed at 410 nm, corresponding to the surface plasmon resonance of AgNPs.46,51 We also examined the crystal nature of the prepared AgNPs using X-ray diffraction. The sharp X-ray diffraction peaks at 2θ of 38.2, 44.3, 64.8, and 77.4 are attributed to the (111), (200), (220), and (311) crystallographic planes, respectively (Figure 1B). The two main and sharp diffraction peaks could be indexed as (111) and (200) planes of face-centered cubic silver (Joint Committee on Powder Diffraction Standards, file no 04-0783). The assigned peaks at 2θ values of 29.5°, (amorphous organic phase), may be related to the crystalline and amorphous organic phase.36,52 We performed Fourier transform infrared spectroscopy (FTIR) analysis to identify potential biomolecules involved in the reduction in the Ag+ ions and to serve as capping agents of AgNPs.43 Figure 1C shows FTIR spectra of the AgNPs prepared from culture supernatant; it shows typical peaks at 3,380 cm−1 and 1,650 cm−1, which are characteristic of the O–H and C=O stretching modes for the OH and C=O groups, possibly functional groups of culture supernatant. The presence of bonds due to O–H stretching (~3,380 cm−1), C=O group (~1,650 cm−1), and the peak at 1,650 cm−1 could be attributed to the vibrations due to amide I. Particle size distribution was performed by dynamic light scattering, which shows an average size between 4 nm and 20 nm (Figure 1D).
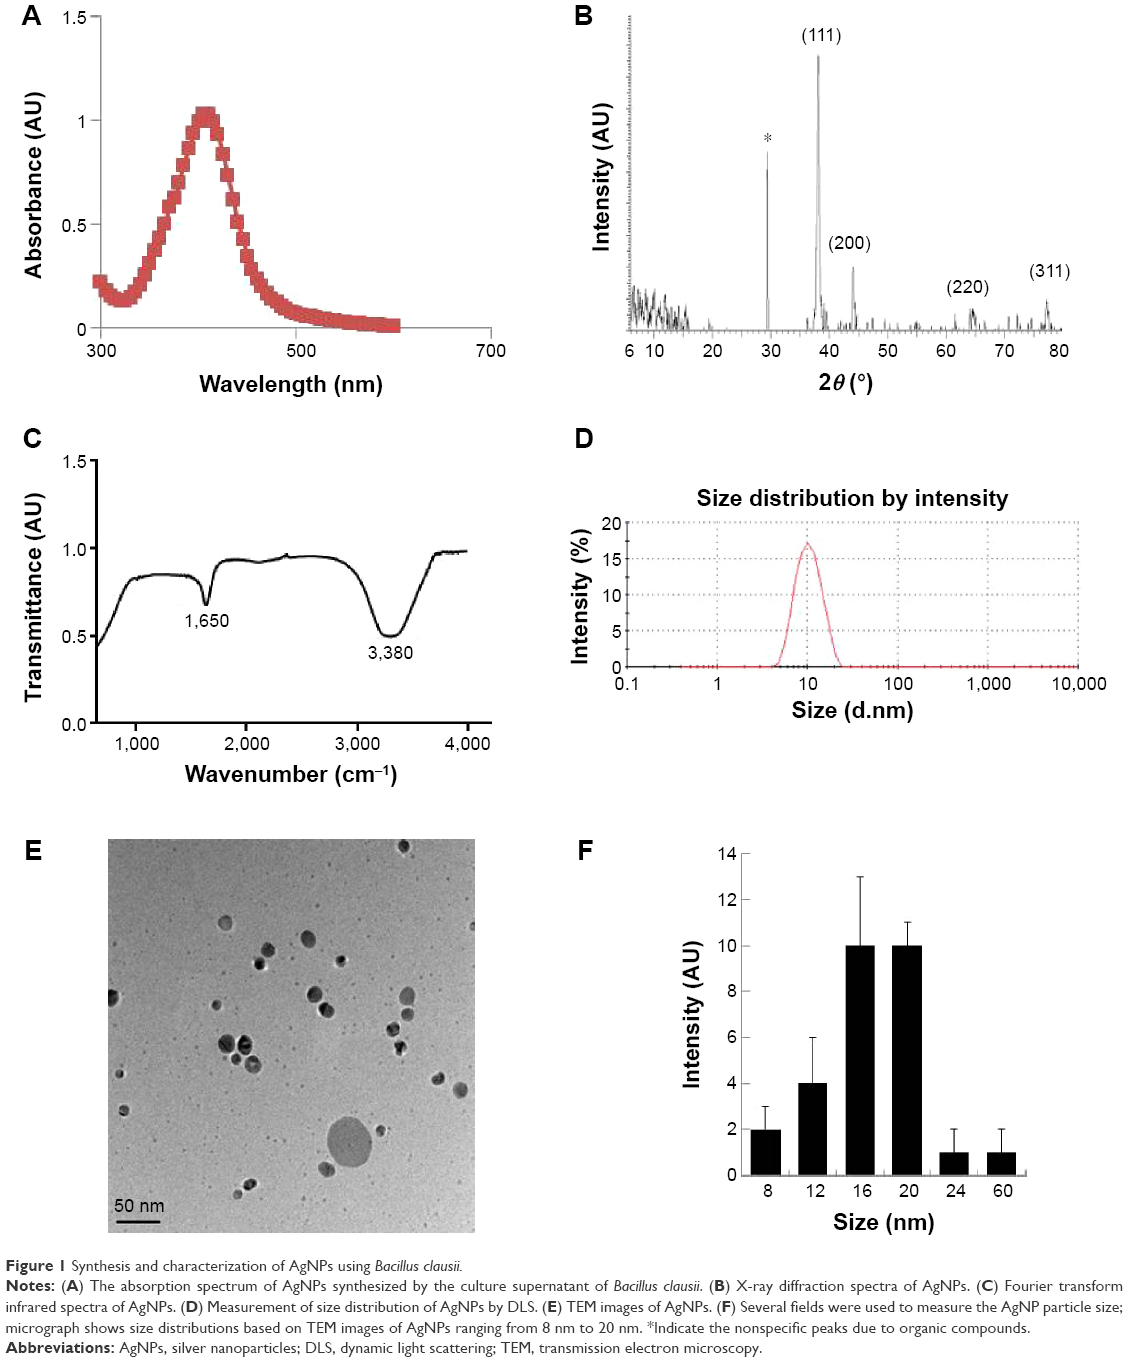 | Figure 1 Synthesis and characterization of AgNPs using Bacillus clausii. |
Ultimately, observation of AgNPs using transmission electron microscopy (TEM) is the most essential tool to directly analyze the structural information, such as the size and morphology of the nanoparticles.43 TEM micrographs of the AgNPs showed distinct, uniformly spherical shapes that were well separated from each other (Figure 1E). The average particle sizes were between 8 nm and 60 nm with an average size of 18 nm from measuring >200 particles from TEM images (Figure 1F). The characterization of biologically derived AgNPs is consistent with the previous work reported by multiple laboratories that used plant extracts, including Azadirachta indica leaf extract,53 Olax scandens,54 Allophylus cobbe,55 and Artemisia princeps,50 and bacteria-derived AgNPs from Bacillus funiculus,56 Bacillus cereus,57 Bacillus tequilensis, and Calocybe indica.42
Effect of Sal and AgNPs in human breast cancer and ovarian cancer cell lines
To determine the effect of Sal and AgNPs on cell viability, initially we selected two types of cancer cells: human breast cancer cell line MDA-MB-231 (Figure 2A) and human ovarian cancer cell line A2780 (Figure 2B). The cells were treated with various concentrations of Sal (0–20 μM) or AgNPs (0–20 μg/mL) for 24 hours, and cell viability was measured by WST-8 assay. The results from the cell viability assay showed a concentration-dependent pattern in both cell types. The Sal and AgNPs cause significant cell death in ovarian cancer cells than breast cancer cells at tested concentrations (Figure 2A and B). Sal was more potent in ovarian cancer cells (A2780); thus, it could be a suitable model for the development of novel therapeutic approaches to combat ovarian cancer. Therefore, in further experiments, we focused on ovarian cancer cells. With increasing concentration, the survival rate of A2780 cells treated with Sal decreased more sharply than that of cells treated with AgNPs, whereas the cytotoxic effect of AgNPs was slightly less than that of Sal. This finding demonstrated that Sal was slightly more potent than AgNPs in A2780 cells. However, both Sal and AgNPs caused dose-dependent toxicity effects. Furthermore, these data could support the previous postulation that Sal was likely to preferentially target CSCs, whereas gemcitabine could further eliminate differentiated cancer cells.58 Zhang et al59 reported the growth-inhibitory effect of Sal or cisplatin in various cell lines, including OV2008, C13, A2780, A/CP, SKOV3, and OVCAR3. They concluded that Sal was slightly more potent in A2780 than in the other cell lines tested. The effect of Sal on cytotoxicity was investigated using an MTT assay on the doxorubicin-sensitive MCF-7 or doxorubicin-resistant MCF-7/MDR cells. Sal significantly inhibited cell viability in the MCF-7 cells60 and significantly enhanced the cytotoxicity of doxorubicin on the MCF-7/MDR cells in a dose-dependent manner.60 It was able to increase the apoptotic rate of Cisp-resistant SW620 cells via accumulated ROS and upregulation of some apoptosis-related genes or proteins.61 Human uterine leiomyoma cells treated with Sal showed decreased cell growth in a dose-dependent manner. The results drawn from this study are consistent with previously published data. To test the combinatory effect of Sal and AgNPs at low concentrations, we measured the inhibitory concentration 25 (IC25) values of Sal and AgNPs, which were 3 μM and 4 μg/mL, respectively. The following experiments were conducted using the IC25 values of Sal and AgNPs until unless specified.
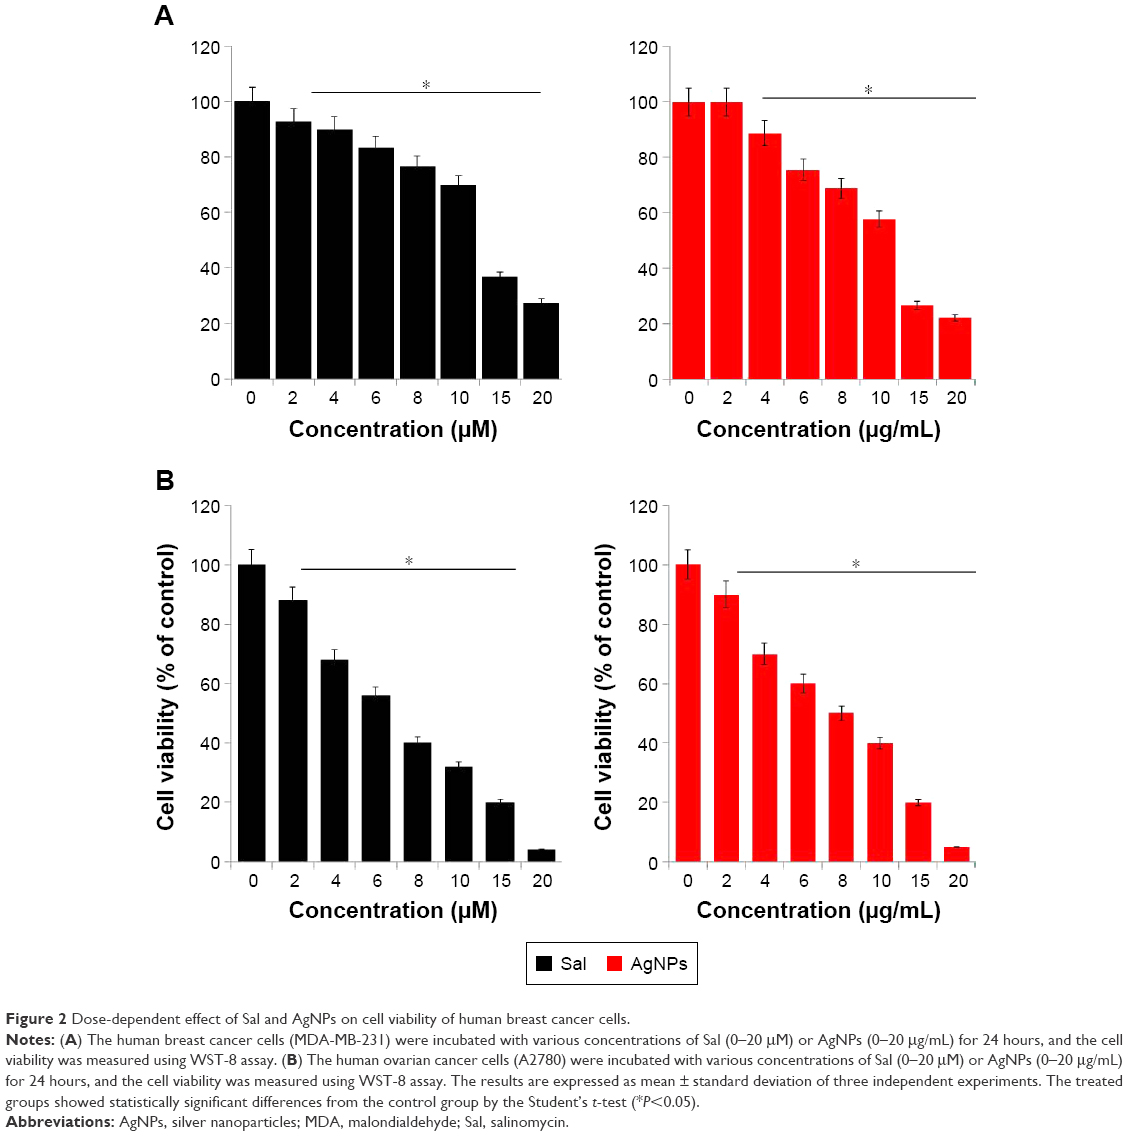 | Figure 2 Dose-dependent effect of Sal and AgNPs on cell viability of human breast cancer cells. |
Combined effect of Sal and AgNPs on cell viability
Based on the cell viability assay, we chose Sal (3 μM) and AgNPs (4 μg/mL) for subsequent experiments to test the combined cytotoxic effects of this drug combination. Cell growth inhibition was determined by WST-8 assay in the A2780 cell line. As shown in Figure 3A, the combined treatment with Sal and AgNPs enhanced the cell death (81%) by decreasing the cell viability more efficiently than either Sal (25%) or AgNPs alone (25%). Further, we examined the simultaneous addition of AgNPs (6 μg/mL, 9 μg/mL, 12 μg/mL, or 15 μg/mL) with a fixed concentration of Sal (3 μM) in the A2780 cell line. The results show that higher concentrations of AgNPs reduce the cell viability more than lower concentrations, but it is not a remarkable effect. This indicates that a lower concentration of AgNPs is enough to strongly synergize with Sal to induce cell death in ovarian cancer cells (Figure 3B). Our results are consistent with an earlier study by Zhang et al,58 which reported that the combined treatment with Sal and gemcitabine inhibited cell growth more in SW1990 and AsPC-1, side population and non-side population cells. Similarly, the combination of Sal and AgNPs demonstrated the most efficient cytotoxic effect in A2780 cells. Wang et al62 analyzed the effect of combination therapy with Sal and 5-fluorouracil on human hepatocellular carcinoma cell lines Huh7, LM3, and SMMC-7721 and nude mice. The combination of Sal and 5-fluorouracil shows an effective synergistic antitumor effect against liver tumors. Treatment with low doses of Sal in combination with TNF-related apoptosis-inducing ligand (TRAIL) augmented the activation of caspase-3 and increased TRAIL-R2 cell surface expression.63 Kim et al64 demonstrated that a lower concentration of Sal (0.5 μM) increases apoptosis in Hs578T breast cancer cells through detachment. The combined use of 2-fluoro 2-deoxy d-glucose or 2-deoxy d-glucose with Sal is lethal in cancer cells, whereas the use of oxamate does not improve the cell-death-inducing properties of Sal. Interestingly, cancer cells treated with Sal under starvation conditions have not only greater apoptotic caspase activity but also diminishment of the protective autophagy normally triggered by treatment with Sal alone.45 Considering studies from other groups, our findings suggest that the low concentration of Sal and AgNPs could enhance the cell death significantly in human ovarian cancer cells.
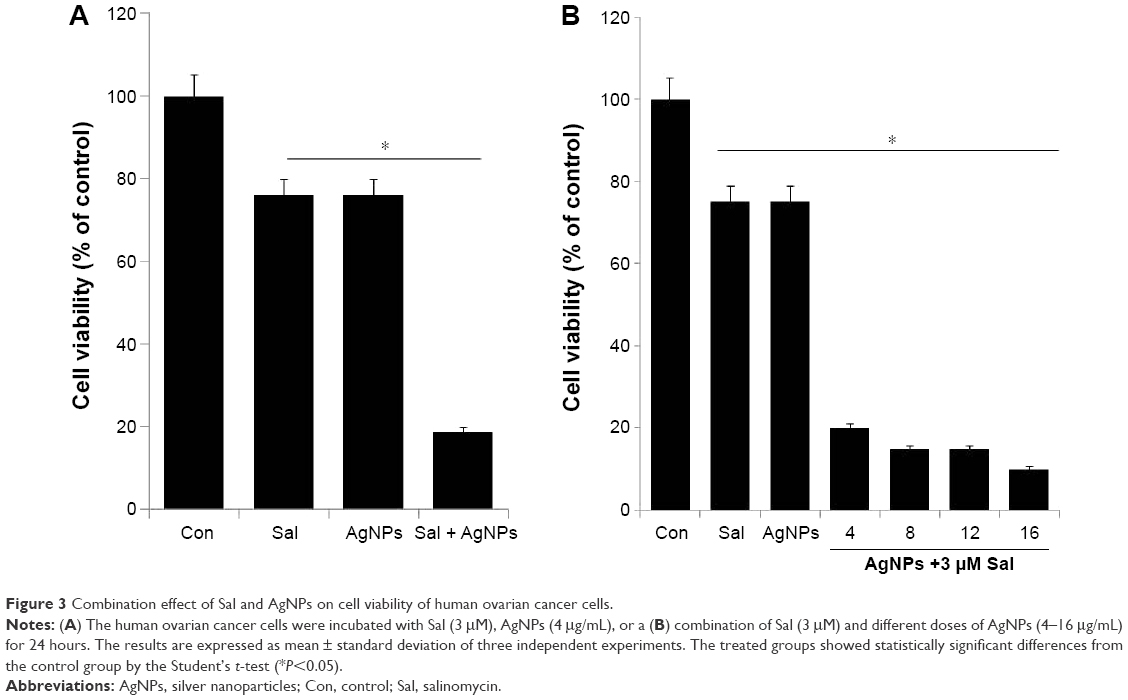 | Figure 3 Combination effect of Sal and AgNPs on cell viability of human ovarian cancer cells. |
Sal and AgNPs alter cell morphology
To determine whether Sal, AgNPs, or the combination of Sal and AgNPs could influence cell morphology, we evaluated A2780 cells treated with Sal (3 μM), AgNPs (4 μg/mL), or both Sal and AgNPs (3 μM plus 4 μg/mL). Treatment with either Sal or AgNPs alone caused marginal cell morphological changes, such as a round shape, whereas the combination of Sal and AgNPs caused severe morphological changes, such as rounder cells and lower cell density than in either single treatment group (Figure 4). Similarly, a reduction in cell growth was observed when the OVCAR-8 ovarian cancer cell line and its derivatives, the multidrug-resistant NCI/ADR-RES and DXR cell lines, were exposed to Sal (4 μM and 8 μM) for 24 hours. Sal altered the morphological appearance of the cells in the human CC cell line Mz-ChA.65 Primary cultured mouse astrocytes treated with 5–10 μM Sal showed a slight inhibition of cell survival and morphological changes.66 AgNPs are known to cause toxicity by morphological changes that appeared in various cells.50 Loss of normal morphology was evident in cells treated with Sal or AgNPs alone after 24 hours of exposure. Cells became spherical in shape, forming clusters and eventually detaching from the surface. Previous studies suggest that human hepatoma cells exposed to AgNPs display abnormal morphology, cellular shrinkage, detachment, decreased mitochondrial function, and significantly increased LDH after 24 hours of exposure.19,67 Cell shrinkage is a characteristic feature of apoptosis and is caused by disruption of the maintenance of the normal physiological concentrations of K+ and Na+ and intracellular ion homeostasis.68 Overall, the preliminary data that Sal and AgNPs alter cellular morphology provide evidence for their toxicity.
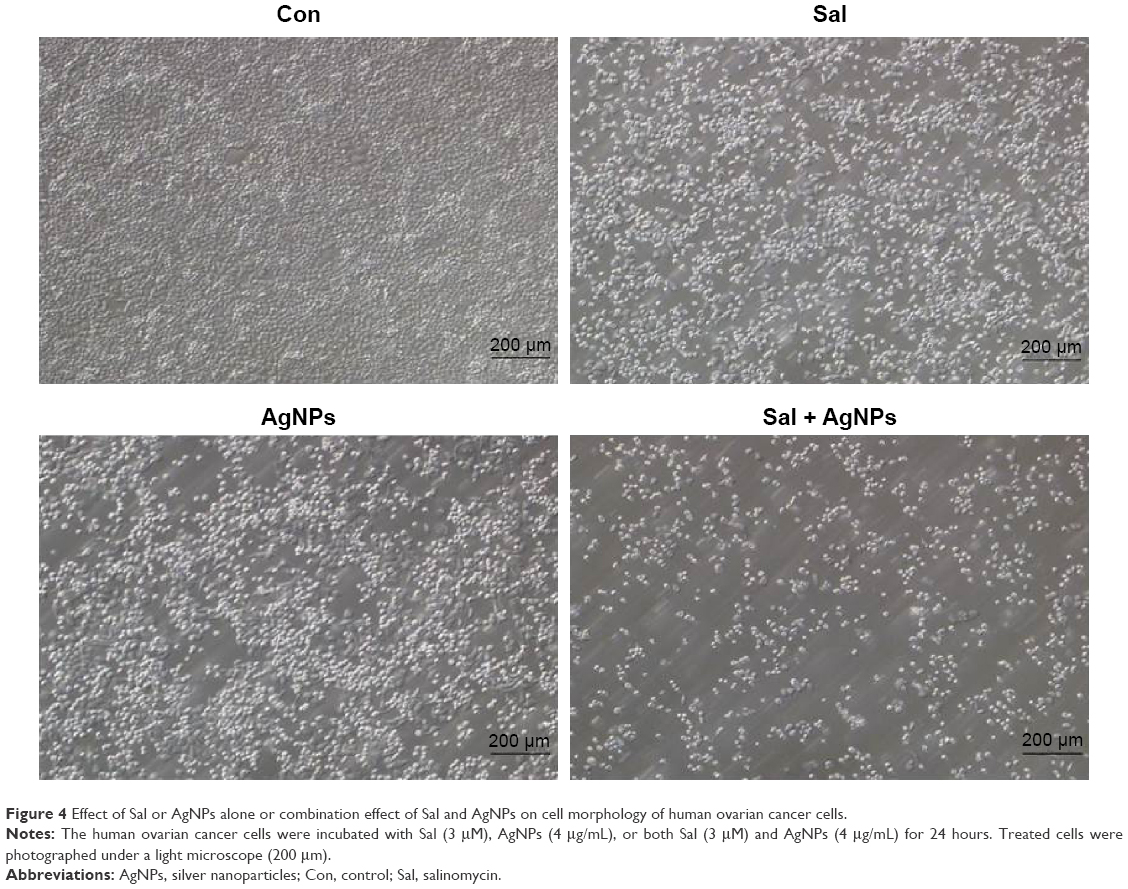 | Figure 4 Effect of Sal or AgNPs alone or combination effect of Sal and AgNPs on cell morphology of human ovarian cancer cells. |
Sal and AgNPs enhance cytotoxicity
Cytotoxicity can be assessed by measuring the release of LDH into the media, which is a good indicator of cellular damage in many cell lines, especially during shear stress, sonication, or from other external toxic agents.36,50,69,70 To investigate the combined effect of Sal and AgNPs on cell membrane integrity, we treated human ovarian cancer cells with Sal (3 μM), AgNPs (4 μg/mL), or a combination of Sal and AgNPs (3 μM plus 4 μg/mL). The release of LDH was significantly higher in the cells treated with Sal and AgNPs than in cells treated with either Sal or AgNPs alone (Figure 5A). This demonstrated that Sal and AgNPs can greatly affect the plasma membrane structure of A2780 cells and can induce cell death. Similarly, Sal increased LDH release and MDA levels and downregulated SOD and GSH-PX activities in Cisp-resistant SW620 cells.71 We found a significant correlation between the cell viability test and LDH activity measurements in the supernatant of A2780 cells. Therefore, the LDH assay is a potential marker of cell injury and death.
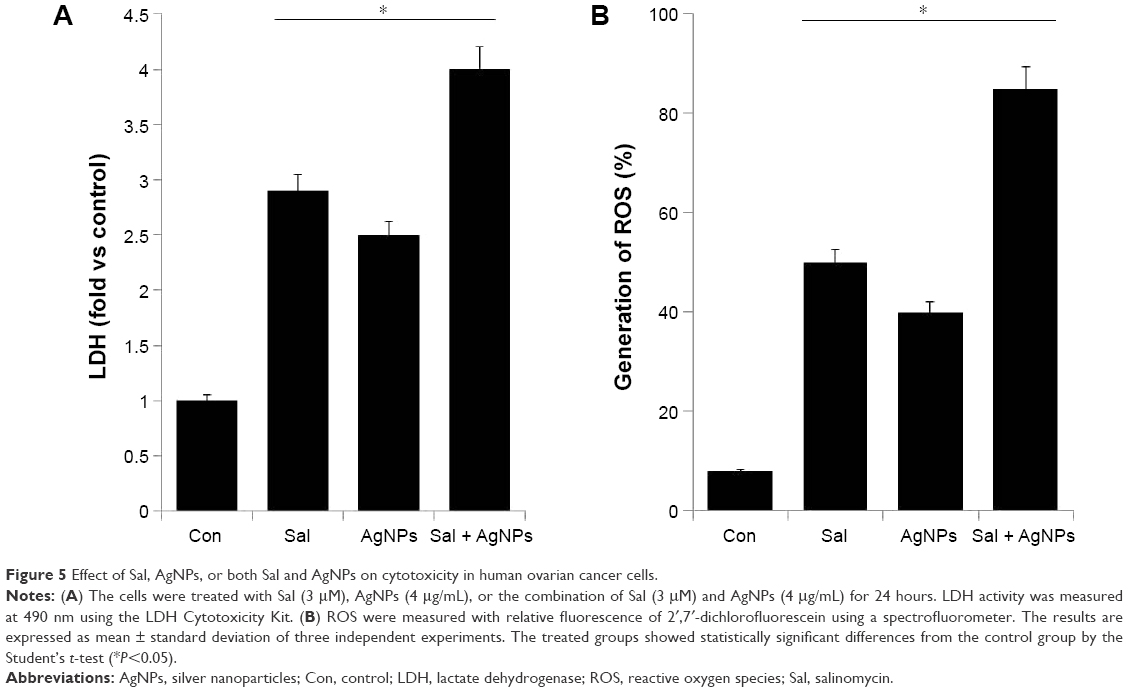 | Figure 5 Effect of Sal, AgNPs, or both Sal and AgNPs on cytotoxicity in human ovarian cancer cells. |
ROS can cause apoptosis via multiple pathways, including cell survival, cell death, proliferation, and metabolic regulation pathways, as well as pathways that regulate the activation of antioxidant systems, the control of iron metabolism, and calcium signaling.72 Increased generation of ROS in turn creates oxidative stress, and it leads to dysfunction of antioxidant systems in the cell.72 Physiological levels of ROS mediate crucial intracellular signaling pathways involved in cell survival, but an excess of ROS induces cell damage and death.73 To investigate the mechanisms of cell death caused by both Sal and AgNPs, we examined the combined effect of Sal and AgNPs on ROS production. Sal could generate ROS in prostate cancer cells;20,74 however, Sal caused growth inhibition but not apoptosis in vertebral cancer of the prostate and LNCaP prostate cancer cells.20 Figure 5B shows the production of ROS after treatment with Sal, AgNPs, or both Sal and AgNPs. Our results are consistent with other studies stating that Sal induced apoptosis in human prostate cancer cells.74 Verdoodt et al30 demonstrated that Sal induces autophagy in colon and breast cancer cells with concomitant generation of ROS, and the dysregulation of apoptosis-related genes or proteins might ultimately lead to apoptosis in Cisp-resistant SW620 cells.71 The cytotoxicity experiments suggest that the combination of Sal and AgNPs causes dramatic effect on the generation of ROS, which eventually causes cell death.
Effect of Sal and AgNPs on oxidative stress markers
Nanomaterials are known to produce free radicals, which is one of the primary mechanisms causing cell toxicity.75 The produced free radicals can cause oxidative stress that damages membranes, increases levels of oxidative markers, and induces DNA damage.43,50,76 Lipids are susceptible targets of oxidation.77 MDA is one of the most well-studied markers of lipid peroxidation. We investigated the combined effect of Sal and AgNPs on oxidative stress markers such as MDA by measuring the levels. The levels of MDA in control, Sal-treated, AgNPs-treated, and Sal plus AgNPs-treated cells were 0.31 nmol/mg, 1.21 nmol/mg, 0.81 nmol/mg, and 2.4 nmol/mg of protein, respectively. The level of MDA was significantly higher in Sal or AgNPs or combined treatment of both Sal and AgNPs than control. Interestingly, the combined treatment with Sal and AgNPs significantly increases the MDA level (Figure 6A). Previous findings also suggest that Sal treatment could result in an abundance of lipid peroxides with increased LDH release and MDA levels in Cisp-resistant SW620 cells. Sal also downregulated SOD and GSH-PX activities in Cisp-resistant SW620 cells.71
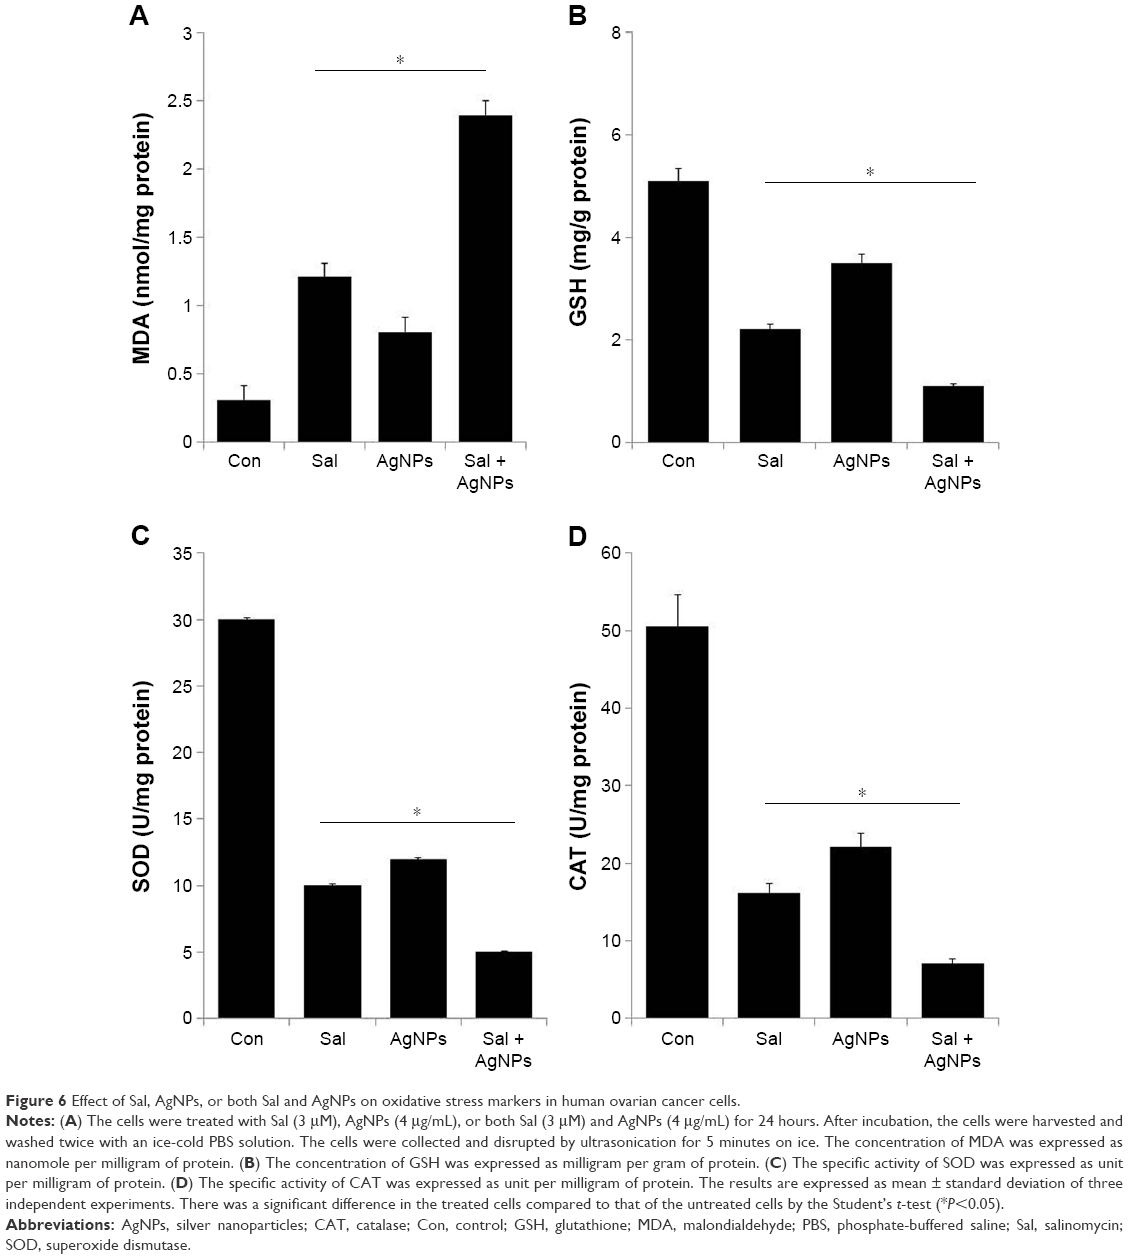 | Figure 6 Effect of Sal, AgNPs, or both Sal and AgNPs on oxidative stress markers in human ovarian cancer cells. |
Next, we investigated the levels of GSH, SOD, and CAT in the cells exposed to Sal and AgNPs (Figure 6B–D). GSH plays an important role in various cellular processes, such as cell differentiation, proliferation, and apoptosis.73 An imbalance in GSH homeostasis is responsible for the etiology and progression of many human diseases, including cancer.73 Antioxidant defense system controls the level of ROS including SOD, CAT, and GSH peroxidase. Therefore, in the cells, the balance between ROS generation and ROS scavenging is essential for cell proliferation or death.68 We analyzed the level of GSH, SOD, and CAT. As expected, GSH, SOD, and CAT levels were significantly lower in cells treated with Sal (3 μM), AgNPs (4 μg/mL), or the combination of Sal and AgNPs (3 μM plus 4 μg/mL) for 24 hours than in controls (Figure 6B–D). These results suggest that Sal and AgNPs lead to a condition of oxidative stress in cells, which may arise due to the imbalance of oxidant and antioxidant levels in cells.78 Overall, oxidative stress was induced by the treatment of Sal and AgNPs as confirmed by the significant decrease in GSH, SOD, and CAT levels in the treated groups.
Sal and AgNPs induce loss of MMP
Mitochondria have key roles in the early stages of apoptosis, including loss of MMP, intracellular energy, mitochondrial swelling, and release of mitochondrial proteins, such as cytochrome c and AIF, to the cytosol and/or nucleus.79–82 Loss of MMP is a crucial step in triggering apoptosis through the release of mitochondrial proteins. To determine the combined effect of Sal and AgNPs in mitochondrial function and their role in induced cell death, the JC-1 assay was used to analyze MMP as described earlier.83,84 We measured the loss of MMP in cells treated with Sal, AgNPs, or a combination of Sal and AgNPs. As shown in Figure 7, cells treated with Sal (3 μM) and AgNPs (4 μg/mL) exhibited an imbalance ratio between green fluorescence and red fluorescence; interestingly, the combination of both Sal and AgNPs exhibited remarkable difference from the control as well as the single treatments. The results from this study suggest that the red–green fluorescence intensity (aggregate/monomer) ratio was decreased to 42%, 37%, and 82% in Sal-treated, AgNPs-treated, and Sal plus AgNPs-treated cells, respectively (Figure 7). The JC-1 red–green fluorescence intensity ratio was higher in control cells than the treated groups. Interestingly, cells treated with Sal, AgNPs, or a combination of both clearly show a lower JC-1 red–green fluorescence intensity ratio, indicating a loss of mitochondrial membrane integrity. This analysis provided clear evidence that Sal or AgNPs alone were able to induce a significant increase in the proportion of cells exhibiting a loss of MMP, and this effect was potentially enhanced by the combination of Sal with AgNPs. Jangamreddy et al84 observed an increase in both JC-1 green and red fluorescence in breast cancer cell lines (SKBR3 and MDAMB468) at 24 hours. The prostate cancer PC3 cell line shows a strong increase in green fluorescence. Jangamreddy et al84 observed that Sal triggers mitochondrial swelling, mitophagy, and disruption of mitochondrial architecture and mitochondrial hyperpolarization in cancer cells. Previously, we observed a loss of MMP in AgNPs-treated lung carcinoma (A549) cells50 and MDA-MB-231 human breast cancer cells.42 Similarly, Calzolari et al63 found pronounced loss of MMP in TRAIL-sensitive T98G cells treated with both Sal and TRAIL. Sal was able to induce mitochondrial membrane depolarization and lead to cytochrome c release, activation of CASP3, and cleavage of its substrate PARP1, eventually leading to apoptosis.74 Similarly, AgNPs also reduce mitochondrial function and increase membrane leakage in mammalian germline stem cells via ROS generation in rat liver cells.85,86 Overall, previous studies and our data suggest that the combination of Sal and AgNPs results in a loss of MMP.
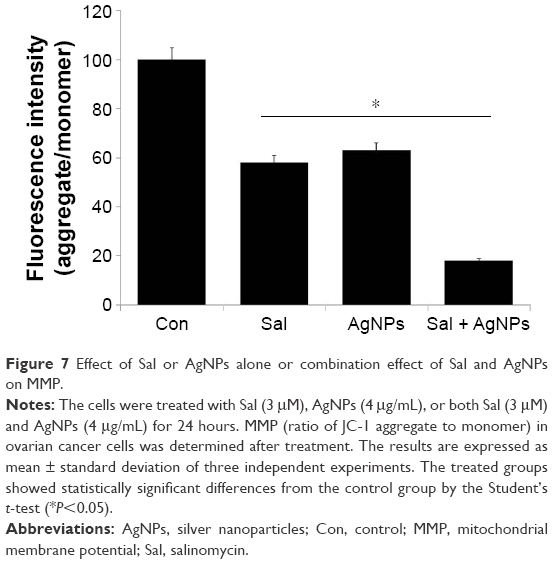 | Figure 7 Effect of Sal or AgNPs alone or combination effect of Sal and AgNPs on MMP. |
Combination of Sal and AgNPs enhances apoptosis by upregulation of proapoptotic genes
The tumor suppressor p53 is a potent transcription factor, which induces cell cycle arrest, apoptosis, or senescence.87,88 Although p21 is a transcriptional target of p53 and can act as a cell cycle inhibitor, it functions independently in response to a variety of stresses, including DNA damage.89 In addition, p21 regulates p53 function either negatively or positively for the induction of apoptosis.90 Therefore, we chose to investigate the p53-mediated proapoptotic effect of Sal, AgNPs, or the combination of both. p53 mRNA levels were analyzed at 24 hours posttreatment by quantitative RT-PCR (Figure 8). AgNPs are known to induce p53-mediated apoptosis in human breast cancer cells.42 p53 levels were slightly increased in cells treated with AgNPs or Sal than in the control group, whereas the combined treatment with Sal and AgNPs led to a 1.5-fold increase. To test if the elevated p53 expression correlates with the transcription of p53 target genes, we examined the expression of the canonical p53 target p21. The data suggest that p21 was upregulated by 15- and fivefold in Sal- and AgNPs-treated cells, respectively. Interestingly, the combination of Sal and AgNPs shows a 25-fold (Figure 8).
 | Figure 8 Impact of Sal or AgNPs alone or combination effect of Sal and AgNPs on the expression of apoptotic and antiapoptotic gene expression. |
Bcl-2 family proteins, including Bax and Bak and antiapoptotic proteins (Bcl-2), have a crucial role in mitochondrial-mediated apoptosis. First, to understand whether the treatment of Sal and AgNPs upregulates proapoptotic Bax and Bak and downregulates antiapoptotic gene Bcl-2, we treated human ovarian cancer cells with Sal, AgNPs, or combination of both Sal and AgNPs, and gene expression analysis was performed for these genes. We observed that Bax and Bak genes were significantly upregulated in cells treated with both Sal and AgNPs (Figure 8).
To determine whether the cell death is caspase-mediated apoptosis, we examined the effect of combined treatment with Sal and AgNPs on caspase-9 and caspase-3 in human ovarian cells. The expression of initiator caspase-9 or executioner caspase-3 was determined in cells that were treated with AgNPs, Sal, or the combination of Sal and AgNPs. The combined treatment (ie, Sal and AgNPs) resulted in a significant increase in caspase-9/3 activity, which is responsible for maintaining homeostasis by regulating cell death and inflammation.91 Further to confirm the role of major apoptotic player, caspase-3, we measured the level of pro-caspase-3, in cell lysates derived from cells treated with Sal, AgNPs, and the combination of both Sal and AgNPs. In the presence of Sal, AgNPs, and the combination of both Sal and AgNPs, the pro-forms of caspase-3 were significantly reduced. The combination of both Sal- and AgNPs-treated cells showed a remarkable reduction in procaspase-3 forms than single treatment. All these assays clearly indicate that AgNPs, Sal, or a combination of Sal and AgNPs induces apoptosis through the upregulation of apoptotic genes by increasing the ROS level and changing the proapoptotic/antiapoptotic gene ratio.
Sal and AgNPs induce caspase-3-dependent cell death
Several studies indicate that multiple pathways are involved in the induction of apoptosis, originating from a variety of cell surface receptor-triggered or other events.92–94 Caspase-3 is a crucial mediator of programmed cell death. Therefore, we investigated whether Sal and AgNPs could induce cell death through caspase-3-dependent or independent pathways. To determine the combined effect of Sal and AgNPs, we evaluated the effect of Sal and AgNPs on caspase-3 activation by spectrophotometric analysis using a caspase-3 inhibitor. When compared to control, Sal alone induced caspase-3 activation in A2780 cells; however, the effect was lower than that of AgNPs alone. Treatment with both Sal and AgNPs resulted in significant caspase-3 activation. Next, we tried to inhibit Sal- or AgNPs-induced cytotoxicity using the caspase-3 inhibitor. The addition of inhibitor rescued the Sal or AgNPs or Sal- or AgNPs-induced caspase-3 activation. This indicates that Sal, AgNPs, or both Sal and AgNPs induce cell death through caspase-3 activation in A2780 cells (Figure 9). Calzolari et al63 reported that Sal alone failed to induce any significant caspase-3 activation in both T98G and U251 cells; however, clear caspase-3 activation was observed in combining Sal with TRAIL.63 Sal inhibited cell proliferation and induced cell death through activation of caspase-3, caspase-8, and caspase-9 in uterine leiomyoma cells.95 Sal induces both caspase-mediated apoptosis and necrosis/necroptosis as evident by the release of high mobility group box 1; it also caused strong and time-dependent adenosine triphosphate depletion in cancer cells, but not in human normal dermal fibroblasts.84 The cell lysates obtained from Dalton’s lymphoma ascites cell lines treated with 50 nM of AgNPs at 500 nM concentrations show caspase-3 activation, suggesting that AgNPs caused cell death through apoptosis. In vivo studies report that AgNPs can induce caspase-3 activation, inhibiting tumor formation,35 and cause cytotoxicity in several cell lines, including human breast cancer cells36 and ovarian cancer cells,96 via caspase-3-mediated cell death. Overall, caspase-3 can complete the apoptotic process in cells treated with Sal and AgNPs.
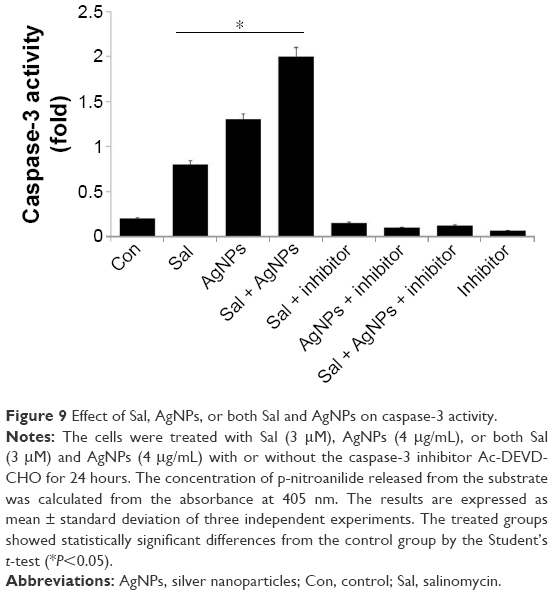 | Figure 9 Effect of Sal, AgNPs, or both Sal and AgNPs on caspase-3 activity. |
Sal and AgNPs enhance apoptosis
DNA fragmentation is a typical feature of apoptosis.97 Apoptosis can be confirmed when there is an abnormal reduction in the size of cells and DNA fragmentation.36 Apoptosis is a fundamental, complex biological process involved in various signaling pathways to regulate development, normal homeostasis, and disease.94,98–100 Cell death is characterized by distinctive morphological and biochemical changes.101 These cellular changes are largely mediated by caspases, which are important indicators of apoptotic cell death.98,102,103 To determine whether caspase-3 activation in cells treated with Sal and AgNPs leads to apoptosis, we measured apoptosis after a 24-hour treatment of cells with Sal, AgNPs, or both using DNA fragmentation assay. AgNPs alone induced apoptosis significantly compared to Sal. However, the results of the combination of Sal and AgNPs significantly enhanced apoptosis than that of a single treatment (Figure 10). Uterine leiomyoma cells showed a significant increase in histone-associated DNA fragments after a 24-hour exposure to Sal.9 Mroz et al104 proposed that nanoparticles induce DNA damage by activating p53 and also mimicking irradiation-related carcinogenesis. Whether the cells undergo apoptosis or senescence depends upon the magnitude of DNA damage caused to cancer cells.105 Several studies confirmed that Sal could potentiate anticancer activity with several DNA damage-causing chemotherapeutic drugs.27 In line with previous studies, our results show that Sal enhances the cytotoxic effect of AgNPs in human ovarian cancer cells. AgNPs have been shown to induce DNA fragmentation in AgNPs-treated Dalton’s lymphoma ascites cells.35 The mechanisms of cytotoxicity of silver are the results of the active physicochemical interaction of silver atoms with the functional groups of intracellular proteins, as well as with the nitrogen bases and phosphate groups in DNA.35 AgNPs-induced toxicity depends on the balances between anti-ROS responses and DNA damage, chromosome instability, and inhibition of mitosis.106 Foldbjerg et al107 observed that AgNPs lead to an increase in ROS associated with DNA damage, apoptosis, and necrosis. Chinese hamster ovary cells exposed to various concentrations of AgNPs induced oxidative stress, which in turn damaged the DNA, leading to apoptosis.108 AgNPs significantly enhanced DNA fragmentation dose dependently, and treatment with p53 siRNA or pifithrin-α prevented DNA fragmentation.42,109 Our results are in line with previous studies indicating that Sal and AgNPs could induce oxidative stress, dysfunction of mitochondria, and DNA fragmentation, eventually leading to apoptosis.
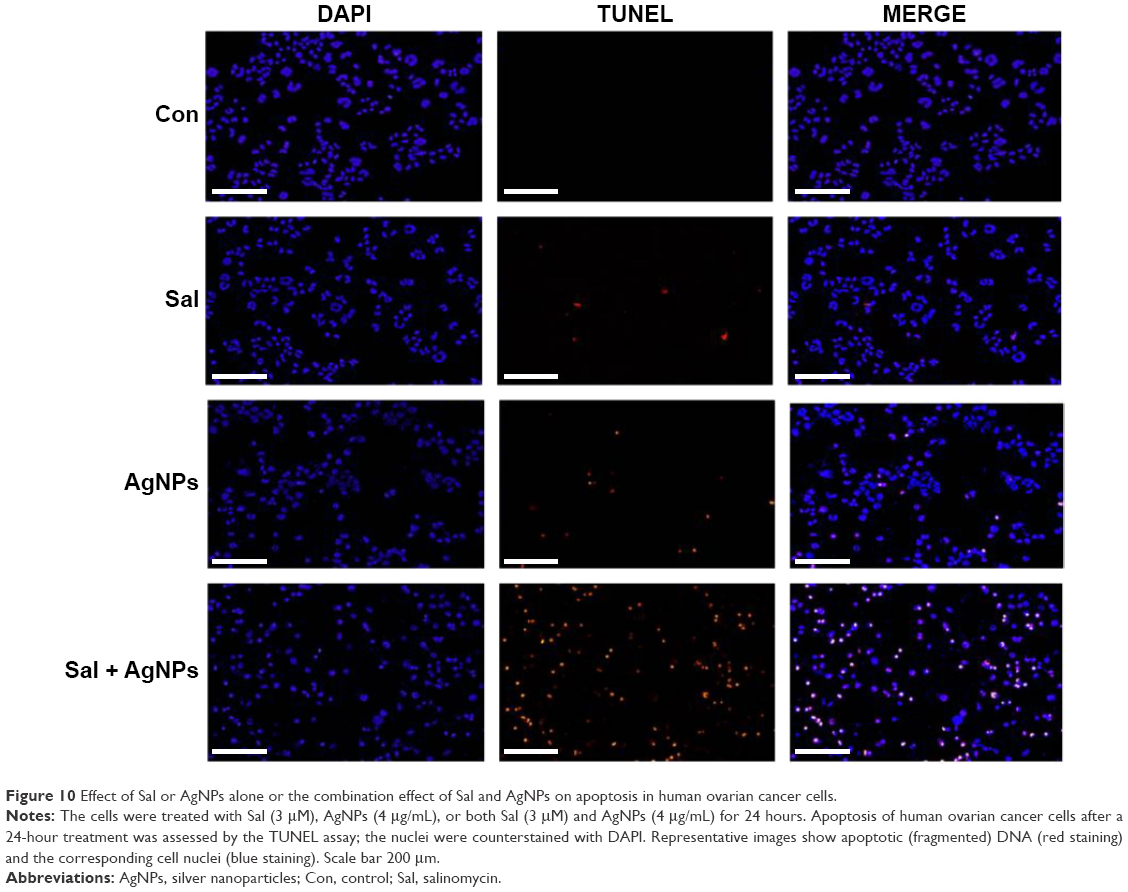 | Figure 10 Effect of Sal or AgNPs alone or the combination effect of Sal and AgNPs on apoptosis in human ovarian cancer cells. |
Combination of Sal and AgNPs induces upregulation of autophagy genes
Autophagy is a unique intracellular trafficking pathway activated in response to extracellular signals.110–112 It is initiated by activation of the Atg1 complex, which includes Atg1/13/17 and other necessary components. Autophagy is responsible for the formation of autophagosomes, which are regulated by a set of evolutionarily conserved ATG proteins.113–116 Although all of these proteins were identified, the signaling pathway involved in autophagy is complex and not fully resolved.110–112
Several studies have shown the importance of autophagy in cancer; however, the mechanisms of autophagy, such as whether it increases the tumor progression or suppression, are not clear. Inhibition of autophagy allows the continuous growth of precancerous cells,117–119 and defects in autophagy are associated with increased tumorigenesis,120,121 suggesting that autophagy can act as a cancer suppressor. However, the molecular bases of autophagy gene regulation by Sal or AgNPs or a combination of both AgNPs and Sal are not known. To address this issue, the cells were treated with Sal, AgNPs, or both, and we examined the expression of various autophagy genes, including Atg3, Atg5, Atg6, Atg7, Atg10, Atg12, and Atg17. The results suggest that AgNPs alone have no significant effect on the expression of Atg3, Atg5, Atg6, Atg7, Atg10, Atg12, and Atg17, except Atg5, and Atg7, whereas Sal clearly upregulated all the tested genes including Atg3, Atg5, Atg7, Atg12, and Atg17, except Atg6 and Atg10. This indicates that AgNPs and Sal have a clear role in autophagy induction (Figure 11). Interestingly, the combination of both Sal and AgNPs shows remarkable difference when compared to untreated or single treatment cells. These data suggest that the combination treatment significantly upregulates autophagy genes that are involved in autophagosome formation. In some cases, the induction of autophagy could lead to apoptosis. These data are consistent with findings made by others that Atg3 and other mediators of autophagy, such as Atg5, Atg6, Atg7, Atg10, Atg12, and Atg17, can trigger apoptosis via mechanisms unrelated to their ability to promote autophagosome formation.122,123
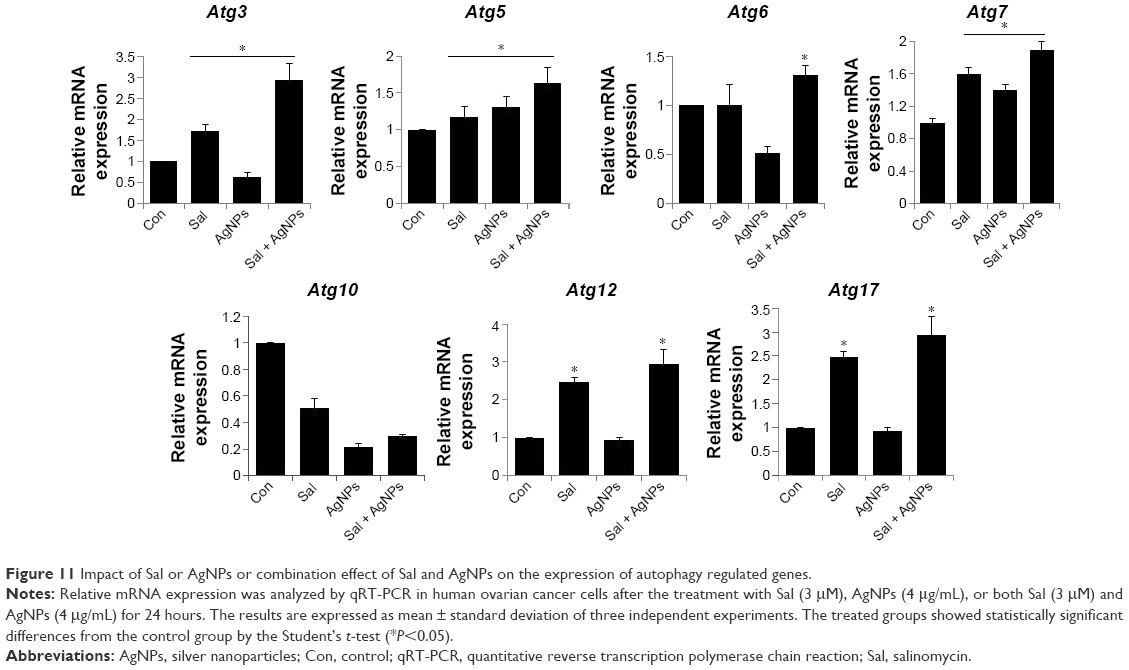 | Figure 11 Impact of Sal or AgNPs or combination effect of Sal and AgNPs on the expression of autophagy regulated genes. |
Yoo et al124 reported that upregulation of Atg3 promotes autophagy-independent apoptosis of the attached cells. Atg5 is a central regulator necessary for autophagy due to its involvement in autophagosome elongation.125 Atg5 also constitutes a point of crosstalk between autophagy and apoptotic pathways.126,127 Interferon γ-induced cell death and vacuole formation were suppressed by downregulation of Atg5 in HeLa cells. Conversely, ectopic expression of Atg5 using adenoviral delivery induces autophagy cell death, indicating that Atg5 contributes to autophagy cell death.128 Overall, our results indicate that Atg5 promotes autophagy, eventually leading to apoptosis. Using pharmacological inhibitors or specific siRNA knockdown of Beclin1/Atg6 and Atg7 profoundly inhibits apoptosis in CD4+ T-cells.129 This indicates that Atg6 and Atg7 are critically involved in autophagy-induced apoptosis. Atg10 can interact with LC3 and facilitate LC3 conjugation with phosphatidylethanolamine.130 Atg7, an E1-like enzyme, activates Atg12, which is facilitating oligomerization of various autophagy gene products.131,132 The Atg12–Atg5–Atg16 complex is essential for the formation of the pre-autophagosomes, which are released to the cytosol, whereas LC3-II is essential for the formation of the autophagosomes.131–133 Eventually, the completed autophagosome fuses with lysosomes, where the autophagosome contents are degraded.133
Combination of Sal and AgNPs induces accumulation of autophagolysosomes along with autophagosomes and lysosomes
Autophagy compartments represent intermediate components of a dynamic degradation process.134 It is known that Sal can induce the formation of autophagosomes;84 however, to further validate the induction of autophagy after treatment with a combination of Sal and AgNPs, we performed TEM analysis. Interestingly, AgNPs induce strong vacuolization and autophagosome formation similar to Sal. Surprisingly, the combination of Sal and AgNPs induces a remarkable accumulation of autophagolysosomes. Activation of autophagy leads to dysfunction of mitochondria;84 Sal-treated cells showed various mitochondrial abnormalities and mitotic changes. Jangamreddy et al84 suggested that mitochondria are the sources of membranes for the formation of autophagosomes. The combination of Sal and AgNPs induces autophagy very strongly as shown by the number of lysosomes and formation of autophagolysosomes in the treated cells (Figure 12A). The autophagy induced by Sal was much stronger than that induced by AgNPs. The inset in Figure 12B shows lysosomes, phagosomes, autophagosomes, and autophagolysosomes. These observations suggest that autophagy could protect the cell initially; although it may kill cells at a later time.135,136 Overall, the combination of Sal and AgNPs enhances cell death via apoptosis by increasing the expression levels of p53, p21, Bax, and Bak and activation of caspases. Cell death could also occur by autophagy via enhanced expression of Atg3, Atg5, Atg6, Atg7, Atg12, and Atg17, which are responsible for the formation of autophagolysosomes.
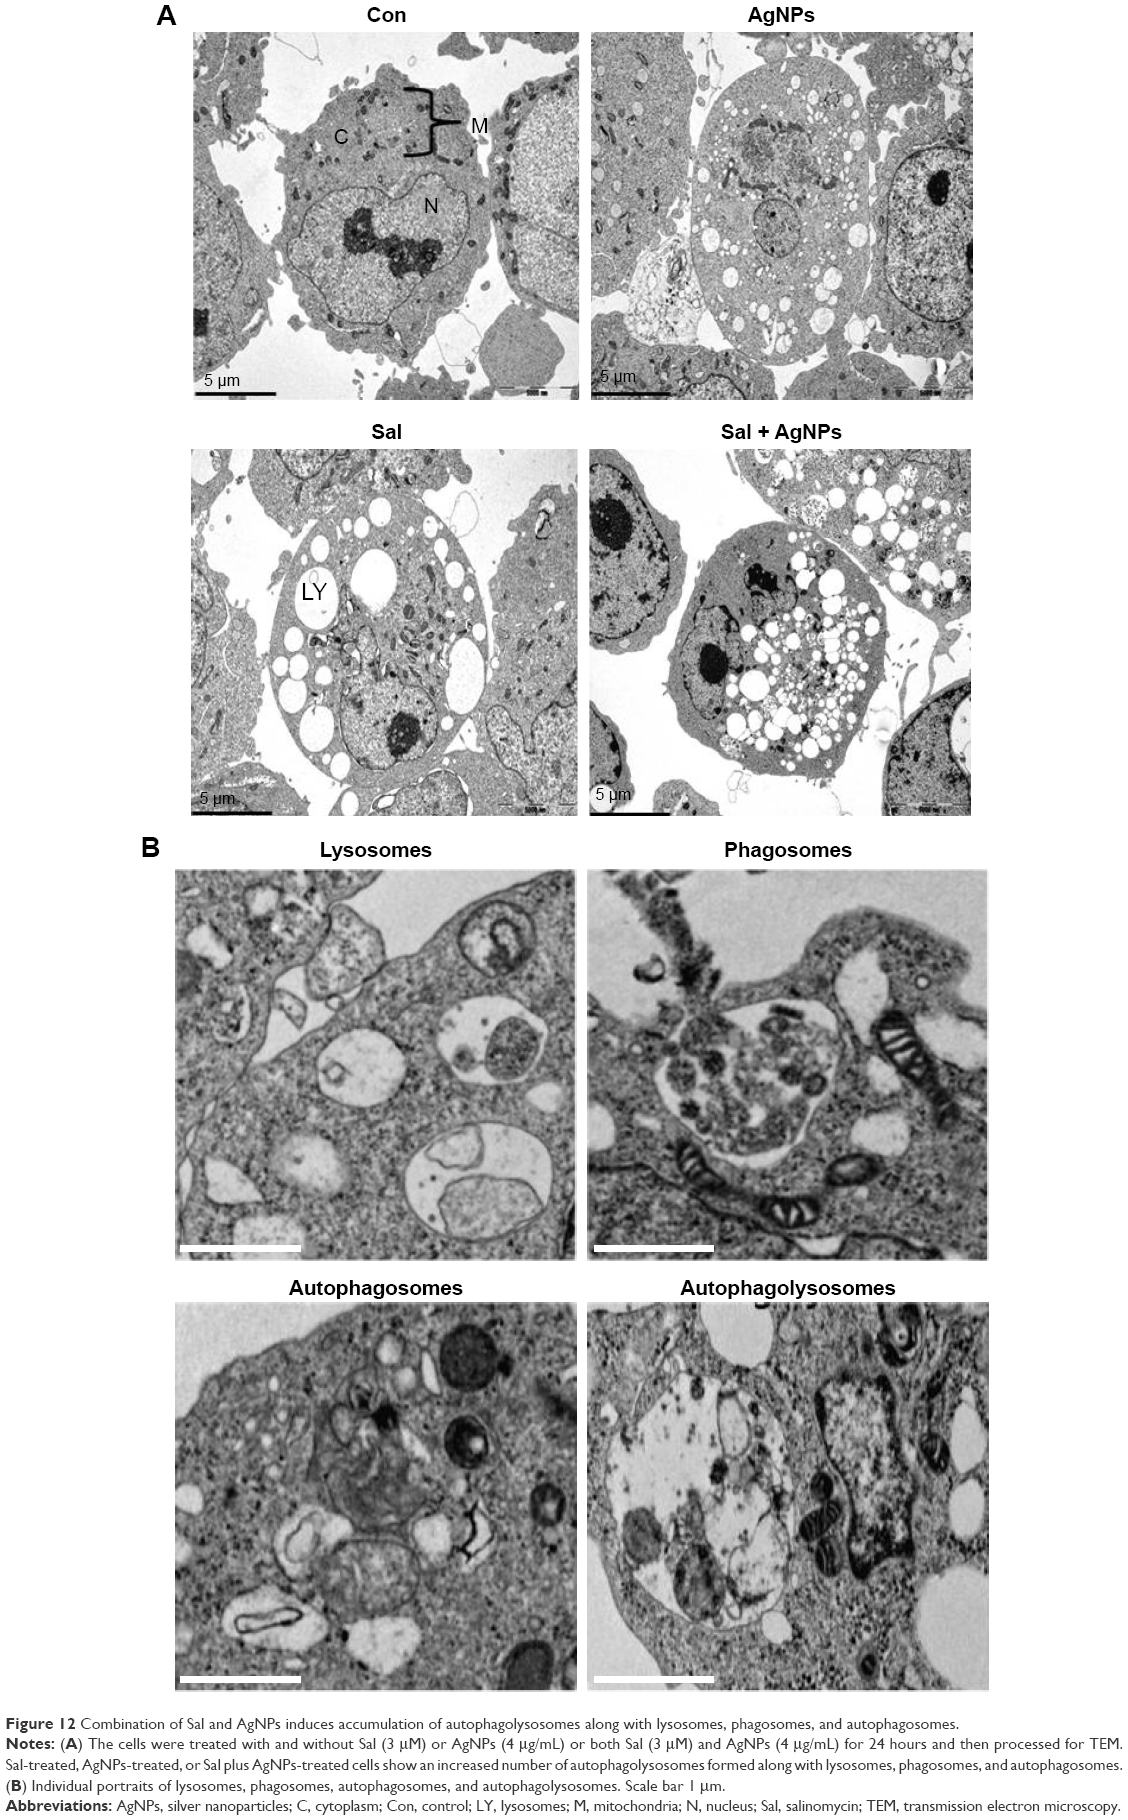 | Figure 12 Combination of Sal and AgNPs induces accumulation of autophagolysosomes along with lysosomes, phagosomes, and autophagosomes. |
Conclusion
Sal is widely used as an anticoccidial agent. AgNPs are known to induce cytotoxicity in several types of cancer cells by generation of ROS and mitochondrial dysfunction. Therefore, we hypothesized that Sal together with AgNPs may effectively inhibit cell viability. To investigate this, human ovarian cancer cells (A2780) were treated with Sal or AgNPs alone or with both Sal and AgNPs and assessed via a series of biochemical assays. The results demonstrated the enhancement of Sal-mediated cytotoxicity in the A2780 cells. Treatment of Sal and AgNPs induced exacerbated apoptosis in the human ovarian cancer cells, which may correlate with alteration of cell morphology, enhanced LDH release, ROS generation, oxidative stress, mitochondrial dysfunction, activation of caspase-3, and DNA fragmentation. Furthermore, the combination treatment shows enhanced caspase-3 activity, which can complete the apoptotic process in cells treated with Sal and AgNPs. Interestingly, both Sal and AgNPs induce massive autophagy, which in turn leads to mitochondrial dysfunction and cell death. This finding suggests that Sal plus AgNPs-treated cells experienced significantly higher toxicity than cells treated with Sal or AgNPs alone. Our data suggest a strong synergistic interaction between Sal and AgNPs in A2780 human ovarian cancer cells. The best strategy for cancer treatment is to eliminate both the differentiated cancer cells and the CSC population. Thus, the combination of Sal and AgNPs may be a suitable therapy, because together they have specific toxicity for CSCs and specifically target non-CSC populations within tumors. These characteristics of Sal make it a potential candidate to increasingly sensitize cells. These findings provide evidence that the combination treatment with Sal and AgNPs might be an effective therapeutic strategy for eliminating CSCs and cancer cells.
Acknowledgments
This paper was supported by the KU-Research Professor Program of Konkuk University. This study was also supported by the Science and Technology Research Program of the Department of Education of Hubei Province, China (D20151701).
Disclosure
The authors report no conflicts of interest in this work.
References
WHO, IARC GLOBOCAN [homepage on the Internet]. Cancer Incidence and Mortality Worldwide in 2008. Available from: http://globocan.iarc.fr/. Accessed December 3, 2015. | ||
U.S. Cancer Statistics Working Group. United States Cancer Statistics: 1999–2012 Incidence and Mortality Web-Based Report. Atlanta, GA: Department of Health and Human Services, Centers for Disease Control and Prevention, and National Cancer Institute; 2015. | ||
Smith LH, Morris CR, Yasmeen S, Parikh-Patel A, Cress RD, Romano PS. Ovarian cancer: can we make the clinical diagnosis earlier? Cancer. 2005;104(7):1398–1407. | ||
Kelland L. The resurgence of platinum-based cancer chemotherapy. Nat Rev Cancer. 2007;7(8):573–584. | ||
Gottesman MM, Fojo T, Bates SE. Multidrug resistance in cancer: role of ATP-dependent transporters. Nat Rev Cancer. 2002;2(1):48–58. | ||
Steg AD, Bevis KS, Katre AA, et al. Stem cell pathways contribute to clinical chemoresistance in ovarian cancer. Clin Cancer Res. 2012;18(3):869–881. | ||
Burgos-Ojeda D, Rueda BR, Buckanovich RJ. Ovarian cancer stem cell markers: prognostic and therapeutic implications. Cancer Lett. 2012;322(1):1–7. | ||
Dean M, Fojo T, Bates S. Tumour stem cells and drug resistance. Nat Rev Cancer. 2005;5(4):275–284. | ||
Li F, Tiede B, Massague J, Kang YB. Beyond tumorigenesis: cancer stem cells in metastasis. Cell Res. 2007;17(1):3–14. | ||
Sarkar B, Dosch J, Simeone DM. Cancer stem cells: a new theory regarding a timeless disease. Chem Rev. 2009;109(7):3200–3208. | ||
Ffrench B, Gasch C, O’Leary JJ, Gallagher MF. Developing ovarian cancer stem cell models: laying the pipeline from discovery to clinical intervention. Mol Cancer. 2014;13:262. | ||
Gupta PB, Onder TT, Jiang GZ, et al. Identification of selective inhibitors of cancer stem cells by high-throughput screening. Cell. 2009;138(4):645–659. | ||
Naujokat C, Fuchs D, Opelz G. Salinomycin in cancer: a new mission for an old agent. Mol Med Rep. 2010;3(4):555–559. | ||
Danforth HD, Ruff MD, Reid WM, Miller RL. Anticoccidial activity of salinomycin in battery raised broiler chickens. Poult Sci. 1977;56(3):926–932. | ||
Miyazaki Y, Shibuya M, Sugawara H, Kawaguchi O, Hirsoe C. Salinomycin, a new polyether antibiotic. J Antibiotics. 1974;27(11): 814–821. | ||
Yue W, Hamai A, Tonelli G, et al. Inhibition of the autophagic flux by salinomycin in breast cancer stem-like/progenitor cells interferes with their maintenance. Autophagy. 2013;9(5):714–729. | ||
Mitani M, Yamanishi T, Miyazaki Y. Salinomycin: a new monovalent cation ionophore. Biochem Biophys Res Commun. 1975;66(4):1231–1236. | ||
Fuchs D, Heinold A, Opelz G, Daniel V, Naujokat C. Salinomycin induces apoptosis and overcomes apoptosis resistance in human cancer cells. Biochem Biophys Res Commun. 2009;390(3):743–749. | ||
Lu DS, Choi MY, Yu J, Castro JE, Kipps TJ, Carson DA. Salinomycin inhibits Wnt signaling and selectively induces apoptosis in chronic lymphocytic leukemia cells. Proc Natl Acad Sci U S A. 2011;108(32):13253–13257. | ||
Ketola K, Hilvo M, Hyotylainen T, et al. Salinomycin inhibits prostate cancer growth and migration via induction of oxidative stress. Br J Cancer. 2012;106(1):99–106. | ||
Fuchs D, Daniel V, Sadeghi M, Opelz G, Naujokat C. Salinomycin overcomes ABC transporter-mediated multidrug and apoptosis resistance in human leukemia stem cell-like KG-1a cells. Biochem Biophys Res Commun. 2010;394(4):1098–1104. | ||
Riccioni R, Dupuis ML, Bernabei M, et al. The cancer stem cell selective inhibitor salinomycin is a p-glycoprotein inhibitor. Blood Cells Mol Dis. 2010;45(1):86–92. | ||
Kim JH, Yoo HI, Kang HS, Ro J, Yoon S. Salinomycin sensitizes antimitotic drugs-treated cancer cells by increasing apoptosis via the prevention of G2 arrest. Biochem Biophys Res Commun. 2012;418(1):98–103. | ||
Zhi QM, Chen XH, Ji J, et al. Salinomycin can effectively kill ALDH (high) stem-like cells on gastric cancer. Biomed Pharmacother. 2011;65(7):509–515. | ||
Wang Y. Effects of salinomycin on cancer stem cell in human lung adenocarcinoma A549 Cells. Med Chem. 2011;7(2):106–111. | ||
Oak PS, Kopp F, Thakur C, et al. Combinatorial treatment of mammospheres with trastuzumab and salinomycin efficiently targets HER2-positive cancer cells and cancer stem cells. Int J Cancer. 2012;131(12):2808–2819. | ||
Kim JH, Chae M, Kim WK, et al. Salinomycin sensitizes cancer cells to the effects of doxorubicin and etoposide treatment by increasing DNA damage and reducing p21 protein. Br J Pharmacol. 2011;162(3):773–784. | ||
Al Dhaheri Y, Attoub S, Arafat K, et al. Salinomycin induces apoptosis and senescence in breast cancer: upregulation of p21, downregulation of survivin and histone H3 and H4 hyperacetylation. Biochim Biophys Acta. 2013;1830(4):3121–3135. | ||
Arafat K, Iratni R, Takahashi T, et al. Inhibitory effects of salinomycin on cell survival, colony growth, migration, and invasion of human non-small cell lung cancer A549 and LNM35: involvement of NAG-1. PLoS One. 2013;8(6):e66931. | ||
Verdoodt B, Vogt M, Schmitz I, Liffers ST, Tannapfel A, Mirmohammadsadegh A. Salinomycin induces autophagy in colon and breast cancer cells with concomitant generation of reactive oxygen species. PLoS One. 2012;7(9):e44132. | ||
Yoon MJ, Kang YJ, Kim IY, et al. Monensin, a polyether ionophore antibiotic, overcomes TRAIL resistance in glioma cells via endoplasmic reticulum stress, DR5 upregulation and c-FLIP downregulation. Carcinogenesis. 2013;34(8):1918–1928. | ||
Chen X, Schluesener HJ. Nanosilver: a nanoproduct in medical application. Toxicol Lett. 2008;176(1):1–12. | ||
Reidy B, Haase A, Luch A, Dawson KA, Lynch I. Mechanisms of silver nanoparticle release, transformation and toxicity: a critical review of current knowledge and recommendations for future studies and applications. Materials. 2013;6(6):2295–2350. | ||
Gurunathan S, Lee KJ, Kalishwaralal K, Sheikpranbabu S, Vaidyanathan R, Eom SH. Antiangiogenic properties of silver nanoparticles. Biomaterials. 2009;30(31):6341–6350. | ||
Sriram MI, Kanth SBM, Kalishwaralal K, Gurunathan S. Antitumor activity of silver nanoparticles in Dalton’s lymphoma ascites tumor model. Int J Nanomedicine. 2010;5:753–762. | ||
Gurunathan S, Han JW, Eppakayala V, Jeyaraj M, Kim JH. Cytotoxicity of biologically synthesized silver nanoparticles in MDA-MB-231 human breast cancer cells. Biomed Res Int. 2013;2013:535796. | ||
Park MV, Neigh AM, Vermeulen JP, et al. The effect of particle size on the cytotoxicity, inflammation, developmental toxicity and genotoxicity of silver nanoparticles. Biomaterials. 2011;32(36):9810–9817. | ||
Hsin YH, Chena CF, Huang S, Shih TS, Lai PS, Chueh PJ. The apoptotic effect of nanosilver is mediated by a ROS- and JNK-dependent mechanism involving the mitochondrial pathway in NIH3T3 cells. Toxicol Lett. 2008;179(3):130–139. | ||
AshaRani PV, Mun GLK, Hande MP, Valiyaveettil S. Cytotoxicity and genotoxicity of silver nanoparticles in human cells. ACS Nano. 2009;3(2):279–290. | ||
Franco-Molina MA, Mendoza-Gamboa E, Sierra-Rivera CA, et al. Antitumor activity of colloidal silver on MCF-7 human breast cancer cells. J Exp Clin Cancer Res. 2010;29:148. | ||
Sanpui P, Chattopadhyay A, Ghosh SS. Induction of apoptosis in cancer cells at low silver nanoparticle concentrations using chitosan nanocarrier. ACS Appl Mater Interfaces. 2011;3(2):218–228. | ||
Gurunathan S, Park JH, Han JW, Kim JH. Comparative assessment of the apoptotic potential of silver nanoparticles synthesized by Bacillus tequilensis and Calocybe indica in MDA-MB-231 human breast cancer cells: targeting p53 for anticancer therapy. Int J Nanomedicine. 2015;10:4203–4222. | ||
Gurunathan S. Rapid biological synthesis of silver nanoparticles and their enhanced antibacterial effects against Escherichia fergusonii and Streptococcus mutans. Arab J Chem. In press 2014. | ||
Satapathy SR, Mohapatra P, Preet R, et al. Silver-based nanoparticles induce apoptosis in human colon cancer cells mediated through p53. Nanomedicine (Lond). 2013;8(8):1307–1322. | ||
Jangamreddy JR, Jain MV, Hallbeck AL, Roberg K, Lotfi K, Los MJ. Glucose starvation-mediated inhibition of salinomycin induced autophagy amplifies cancer cell specific cell death. Oncotarget. 2015;6(12):10134–10145. | ||
Gurunathan S, Kalishwaralal K, Vaidyanathan R, et al. Biosynthesis, purification and characterization of silver nanoparticles using Escherichia coli. Colloids Surf B Biointerfaces. 2009;74(1):328–335. | ||
White RJ, Reynolds IJ. Mitochondrial depolarization in glutamate-stimulated neurons: an early signal specific to excitotoxin exposure. J Neurosci. 1996;16(18):5688–5697. | ||
Sareen D, van Ginkel PR, Takach JC, et al. Mitochondria as the primary target of resveratrol-induced apoptosis in human retinoblastoma cells. Invest Ophthalmol Vis Sci. 2006;47(9):3708–3716. | ||
Han JW, Gurunathan S, Jeong JK, et al. Oxidative stress mediated cytotoxicity of biologically synthesized silver nanoparticles in human lung epithelial adenocarcinoma cell line. Nanoscale Res Lett. 2014;9(1):459. | ||
Gurunathan S, Jeong JK, Han JW, Zhang XF, Park JH, Kim JH. Multidimensional effects of biologically synthesized silver nanoparticles in Helicobacter pylori, Helicobacter felis, and human lung (L132) and lung carcinoma A549 cells. Nanoscale Res Lett. 2015;10:35. | ||
Sastry CS, Srinivas Y, Rao PV. Assay of cisapride in pharmaceutical formulations by extraction spectrophotometry. Talanta. 1997;44(4):517–526. | ||
Sathiya CK, Akilandeswari S. Fabrication and characterization of silver nanoparticles using Delonix elata leaf broth. Spectrochim Acta A Mol Biomol Spectrosc. 2014;128:337–341. | ||
Shankar SS, Rai A, Ahmad A, Sastry M. Rapid synthesis of Au, Ag, and bimetallic Au core-Ag shell nanoparticles using neem (Azadirachta indica) leaf broth. J Colloid Interface Sci. 2004;275(2):496–502. | ||
Mukherjee S, Chowdhury D, Kotcherlakota R, et al. Potential theranostics application of bio-synthesized silver nanoparticles (4-in-1 system). Theranostics. 2014;4(3):316–335. | ||
Gurunathan S, Han JW, Kwon DN, Kim JH. Enhanced antibacterial and anti-biofilm activities of silver nanoparticles against Gram-negative and Gram-positive bacteria. Nanoscale Res Lett. 2014;9(1):373. | ||
Zhang XF, Gurunathan S, Kim JH. Effects of silver nanoparticles on neonatal testis development in mice. Int J Nanomedicine. 2015;10:6243–6256. | ||
Zhang XF, Choi YJ, Han JW, et al. Differential nanoreprotoxicity of silver nanoparticles in male somatic cells and spermatogonial stem cells. Int J Nanomedicine. 2015;10:1335–1357. | ||
Zhang GN, Liang Y, Zhou LJ, et al. Combination of salinomycin and gemcitabine eliminates pancreatic cancer cells. Cancer Lett. 2011;313(2):137–144. | ||
Zhang B, Wang XY, Cai FF, Chen WJ, Loesch U, Zhong XY. Antitumor properties of salinomycin on cisplatin-resistant human ovarian cancer cells in vitro and in vivo: involvement of p38 MAPK activation. Oncol Rep. 2013;29(4):1371–1378. | ||
Kim KY, Kim SH, Yu SN, et al. Salinomycin enhances doxorubicin-induced cytotoxicity in multidrug resistant MCF-7/MDR human breast cancer cells via decreased efflux of doxorubicin. Mol Med Rep. 2015;12(2):1898–1904. | ||
Zhou S, Wang FF, Wong ET, et al. Salinomycin: a novel anti-cancer agent with known anti-coccidial activities. Curr Med Chem. 2013;20(33):4095–4101. | ||
Wang F, Dai WQ, Wang YG, et al. The synergistic in vitro and in vivo antitumor effect of combination therapy with salinomycin and 5-fluorouracil against hepatocellular carcinoma. PLoS One. 2014;9(5): e97414. | ||
Calzolari A, Saulle E, De Angelis ML, et al. Salinomycin potentiates the cytotoxic effects of TRAIL on glioblastoma cell lines. PLoS One. 2014;9(4):e94438. | ||
Kim JH, Kim TY, Kim HS, Hong S, Yoon S. Lower salinomycin concentration increases apoptotic detachment in high-density cancer cells. Int J Mol Sci. 2012;13(10):13169–13182. | ||
Lieke T, Ramackers W, Bergmann S, Klempnauer J, Winkler M, Klose J. Impact of salinomycin on human cholangiocarcinoma: induction of apoptosis and impairment of tumor cell proliferation in vitro. BMC Cancer. 2012;12:466. | ||
Qin LS, Jia PF, Zhang ZQ, Zhang SM. ROS-p53-cyclophilin-D signaling mediates salinomycin-induced glioma cell necrosis. J Exp Clin Cancer Res. 2015;34:57. | ||
Kim S, Choi JE, Choi J, et al. Oxidative stress-dependent toxicity of silver nanoparticles in human hepatoma cells. Toxicol In Vitro. 2009;23(6):1076–1084. | ||
Suzuki-Karasaki Y, Suzuki-Karasaki M, Uchida M, Ochiai T. Depolarization controls TRAIL-sensitization and tumor-selective killing of cancer cells: crosstalk with ROS. Front Oncol. 2014;4:128. | ||
Legrand C, Bour JM, Jacob C, et al. Lactate dehydrogenase (LDH) activity of the number of dead cells in the medium of cultured eukaryotic cells as marker. J Biotechnol. 1992;25(3):231–243. | ||
Burd JF, Usategui-Gomez M. A colorimetric assay for serum lactate dehydrogenase. Clin Chim Acta. 1973;46(3):223–227. | ||
Zhou J, Li P, Xue XF, et al. Salinomycin induces apoptosis in cisplatin-resistant colorectal cancer cells by accumulation of reactive oxygen species. Toxicol Lett. 2013;222(2):139–145. | ||
Martinez-Reyes I, Cuezva JM. The H+-ATP synthase: a gate to ROS-mediated cell death or cell survival. Biochim Biophys Acta. 2014; 1837(7):1099–1112. | ||
Traverso N, Ricciarelli R, Nitti M, et al. Role of glutathione in cancer progression and chemoresistance. Oxid Med Cell Longev. 2013;2013:972913. | ||
Kim KY, Yu SN, Lee SY, et al. Salinomycin-induced apoptosis of human prostate cancer cells due to accumulated reactive oxygen species and mitochondrial membrane depolarization. Biochem Biophys Res Commun. 2011;413(1):80–86. | ||
Nel A, Xia T, Madler L, Li N. Toxic potential of materials at the nanolevel. Science. 2006;311(5761):622–627. | ||
Gurunathan S, Han JW, Dayem AA, Eppakayala V, Kim JH. Oxidative stress-mediated antibacterial activity of graphene oxide and reduced graphene oxide in Pseudomonas aeruginosa. Int J Nanomedicine. 2012;7:5901–5914. | ||
Porter NA, Caldwell SE, Mills KA. Mechanisms of free radical oxidation of unsaturated lipids. Lipids. 1995;30(4):277–290. | ||
Liu D, Pei ZF, Naeem MS, et al. 5-aminolevulinic acid activates antioxidative defence system and seedling growth in Brassica napus L. under Water-deficit stress. J Agron Crop Sci. 2011;197(4): 284–295. | ||
Andon FT, Fadeel B. Programmed cell death: molecular mechanisms and implications for safety assessment of nanomaterials. Acc Chem Res. 2013;46(3):733–742. | ||
Maharjan S, Oku M, Tsuda M, Hoseki J, Sakai Y. Mitochondrial impairment triggers cytosolic oxidative stress and cell death following proteasome inhibition. Sci Rep. 2014;4:5896. | ||
Wang XD. The expanding role of mitochondria in apoptosis. Gene Dev. 2001;15(22):2922–2933. | ||
Wen CY, Huang LL, Chen JX, et al. Gambogic acid inhibits growth, induces apoptosis, and overcomes drug resistance in human colorectal cancer cells. Int J Oncol. 2015;47(5):1663–1671. | ||
Mancini M, Anderson BO, Caldwell E, Sedghinasab M, Paty PB, Hockenbery DM. Mitochondrial proliferation and paradoxical membrane depolarization during terminal differentiation and apoptosis in a human colon carcinoma cell line. J Cell Biol. 1997;138(2):449–469. | ||
Jangamreddy JR, Ghavami S, Grabarek J, et al. Salinomycin induces activation of autophagy, mitophagy and affects mitochondrial polarity: differences between primary and cancer cells. Biochim Biophys Acta. 2013;1833(9):2057–2069. | ||
Braydich-Stolle L, Hussain S, Schlager JJ, Hofmann MC. In vitro cytotoxicity of nanoparticles in mammalian germline stem cells. Toxicol Sci. 2005;88(2):412–419. | ||
Hussain SM, Hess KL, Gearhart JM, Geiss KT, Schlager JJ. In vitro toxicity of nanoparticles in BRL 3A rat liver cells. Toxicol In Vitro. 2005;19(7):975–983. | ||
Vogelstein B, Lane D, Levine AJ. Surfing the p53 network. Nature. 2000;408(6810):307–310. | ||
Xia M, Knezevic D, Vassilev LT. p21 does not protect cancer cells from apoptosis induced by nongenotoxic p53 activation. Oncogene. 2011;30(3):346–355. | ||
Gartel AL, Tyner AL. Transcriptional regulation of the p21 (WAF1/CIP1) gene. Exp Cell Res. 1999;246(2):280–289. | ||
Abbas T, Dutta A. p21 in cancer: intricate networks and multiple activities. Nat Rev Cancer. 2009;9(6):400–414. | ||
McIlwain DR, Berger T, Mak TW. Caspase functions in cell death and disease. Cold Spring Harb Perspect Biol. 2013;5(4):a008656. | ||
Nicholson DW, Thornberry NA. Caspases: killer proteases. Trends Biochem Sci. 1997;22(8):299–306. | ||
Cryns V, Yuan JY. Proteases to die for. Gene Dev. 1998;12(11):1551–1570. | ||
Porter AG, Janicke RU. Emerging roles of caspase-3 in apoptosis. Cell Death Differ. 1999;6(2):99–104. | ||
Lee HG, Lee JM, Shin SJ, et al. Salinomycin inhibited cell proliferation and induced apoptosis in human uterine leiomyoma cells. Obstet Gynecol Sci. 2014;57(6):501–506. | ||
Gurunathan S, Han JW, Park JH, et al. Reduced graphene oxide-silver nanoparticle nanocomposite: a potential anticancer nanotherapy. Int J Nanomedicine. 2015;10:6257–6276. | ||
Allen DL, Linderman JK, Roy RR, et al. Apoptosis: a mechanism contributing to remodeling of skeletal muscle in response to hindlimb unweighting. Am J Physiol. 1997;273(2 pt 1):C579–C587. | ||
Kitazumi I, Tsukahara M. Regulation of DNA fragmentation: the role of caspases and phosphorylation. FEBS J. 2011;278(3):427–441. | ||
Thompson CB. Apoptosis in the pathogenesis and treatment of disease. Science. 1995;267(5203):1456–1462. | ||
Jacobson MD, Weil M, Raff MC. Programmed cell death in animal development. Cell. 1997;88(3):347–354. | ||
Taatjes DJ, Sobel BE, Budd RC. Morphological and cytochemical determination of cell death by apoptosis. Histochem Cell Biol. 2008;129(1):33–43. | ||
Li J, Yuan J. Caspases in apoptosis and beyond. Oncogene. 2008;27(48):6194–6206. | ||
Alvarez-Gonzalez R, Spring H, Muller M, Burkle A. Selective loss of poly(ADP-ribose) and the 85-kDa fragment of poly(ADP-ribose) polymerase in nucleoli during alkylation-induced apoptosis of HeLa cells. J Biol Chem. 1999;274(45):32122–32126. | ||
Mroz RM, Schins RP, Li H, et al. Nanoparticle-driven DNA damage mimics irradiation-related carcinogenesis pathways. Eur Respir J. 2008;31(2):241–251. | ||
Al Dhaheri Y, Eid A, AbuQamar S, et al. Mitotic arrest and apoptosis in breast cancer cells induced by Origanum majorana extract: upregulation of TNF-alpha and downregulation of survivin and mutant p53. PLoS One. 2013;8(2):e56649. | ||
Kim JS, Sung JH, Ji JH, et al. In vivo genotoxicity of silver nanoparticles after 90-day silver nanoparticle inhalation exposure. Saf Health Work. 2011;2(1):34–38. | ||
Foldbjerg R, Dang DA, Autrup H. Cytotoxicity and genotoxicity of silver nanoparticles in the human lung cancer cell line, A549. Arch Toxicol. 2011;85(7):743–750. | ||
Awasthi KK, Awasthi A, Kumar N, Roy P, Awasthi K, John PJ. Silver nanoparticle induced cytotoxicity, oxidative stress, and DNA damage in CHO cells. J Nanopart Res. 2013;15(9):1898. | ||
Kim HR, Shin DY, Park YJ, Park CW, Oh SM, Chung KH. Silver nanoparticles induce p53-mediated apoptosis in human bronchial epithelial (BEAS-2B) cells. J Toxicol Sci. 2014;39(3):401–412. | ||
Stromhaug PE, Klionsky DJ. Approaching the molecular mechanism of autophagy. Traffic. 2001;2(8):524–531. | ||
Wang CW, Klionsky DJ. The molecular mechanism of autophagy. Mol Med. 2003;9(3–4):65–76. | ||
Botti J, Djavaheri-Mergny M, Pilatte Y, Codogno P. Autophagy signaling and the cogwheels of cancer. Autophagy. 2006;2(2):67–73. | ||
Suzuki K, Kirisako T, Kamada Y, Mizushima N, Noda T, Ohsumi Y. The pre-autophagosomal structure organized by concerted functions of APG genes is essential for autophagosome formation. EMBO J. 2001;20(21):5971–5981. | ||
Klionsky DJ, Cregg JM, Dunn WA, et al. A unified nomenclature for yeast autophagy-related genes. Dev Cell. 2003;5(4):539–545. | ||
Mizushima N, Yamamoto A, Matsui M, Yoshimori T, Ohsumi Y. In vivo analysis of autophagy in response to nutrient starvation using transgenic mice expressing a fluorescent autophagosome marker. Mol Biol Cell. 2004;15(3):1101–1111. | ||
Reggiori F, Klionsky DJ. Autophagosomes: biogenesis from scratch? Curr Opin Cell Biol. 2005;17(4):415–422. | ||
Liang XH, Jackson S, Seaman M, et al. Induction of autophagy and inhibition of tumorigenesis by beclin 1. Nature. 1999;402(6762): 672–676. | ||
Gozuacik D, Kimchi A. Autophagy as a cell death and tumor suppressor mechanism. Oncogene. 2004;23(16):2891–2906. | ||
Mathew R, White E. Why sick cells produce tumors – the protective role of autophagy. Autophagy. 2007;3(5):502–505. | ||
Degenhardt K, Mathew R, Beaudoin B, et al. Autophagy promotes tumor cell survival and restricts necrosis, inflammation, and tumorigenesis. Cancer Cell. 2006;10(1):51–64. | ||
Chen N, Debnath J. Autophagy and tumorigenesis. FEBS Lett. 2010;584(7):1427–1435. | ||
Radoshevich L, Murrow L, Chen N, et al. ATG12 conjugation to ATG3 regulates mitochondrial homeostasis and cell death. Cell. 2010;142(4):590–600. | ||
Rubinsztein DC, Codogno P, Levine B. Autophagy modulation as a potential therapeutic target for diverse diseases. Nat Rev Drug Discov. 2012;11(9):709–730. | ||
Yoo BH, Zagryazhskaya A, Li YL, et al. Upregulation of ATG3 contributes to autophagy induced by the detachment of intestinal epithelial cells from the extracellular matrix, but promotes autophagy-independent apoptosis of the attached cells. Autophagy. 2015;11(8):1230–1246. | ||
Klionsky DJ. Autophagy: from phenomenology to molecular understanding in less than a decade. Nat Rev Mol Cell Biol. 2007;8(11):931–937. | ||
Nishida K, Kyoi S, Yamaguchi O, Sadoshima J, Otsu K. The role of autophagy in the heart. Cell Death Differ. 2009;16(1):31–38. | ||
Yousefi S, Perozzo R, Schmid I, et al. Calpain-mediated cleavage of Atg5 switches autophagy to apoptosis. Nat Cell Biol. 2006;8(10):1124–1132. | ||
Pyo JO, Jang MH, Kwon YK, et al. Essential roles of Atg5 and FADD in autophagic cell death – dissection of autophagic cell death into vacuole formation and cell death. J Biol Chem. 2005;280(21):20722–20729. | ||
Espert L, Denizot M, Grimaldi M, et al. Autophagy is involved in T cell death after binding of HIV-1 envelope proteins to CXCR4. J Clin Invest. 2006;116(8):2161–2172. | ||
Nemoto T, Tanida I, Tanida-Miyake E, et al. The mouse APG10 homologue, an E2-like enzyme for Apg12p conjugation, facilitates MAP-LC3 modification. J Biol Chem. 2003;278(41):39517–39526. | ||
Zois CE, Koukourakis MI. Radiation-induced autophagy in normal and cancer cells towards novel cytoprotection and radio-sensitization policies? Autophagy. 2009;5(4):442–450. | ||
Mizushima N, Kuma A, Kobayashi Y, et al. Mouse Apg16L, a novel WD-repeat protein, targets to the autophagic isolation membrane with the Apg12-Apg5 conjugate. J Cell Sci. 2003;116(pt 9):1679–1688. | ||
Xie ZP, Klionsky DJ. Autophagosome formation: core machinery and adaptations. Nat Cell Biol. 2007;9(10):1102–1109. | ||
Klose J, Stankov MV, Kleine M, et al. Inhibition of autophagic flux by salinomycin results in anti-cancer effect in hepatocellular carcinoma cells. PLoS One. 2014;9(5):e95970. | ||
Wirawan E, Berghe TV, Lippens S, Agostinis P, Vandenabeele P. Autophagy: for better or for worse. Cell Res. 2012;22(1):43–61. | ||
Chaabane W, User SD, El-Gazzah M, et al. Autophagy, apoptosis, mitoptosis and necrosis: interdependence between those pathways and effects on cancer. Arch Immunol Ther Exp (Warsz). 2013;61(1):43–58. |
 © 2016 The Author(s). This work is published and licensed by Dove Medical Press Limited. The
full terms of this license are available at https://www.dovepress.com/terms
and incorporate the Creative Commons Attribution
- Non Commercial (unported, 3.0) License.
By accessing the work you hereby accept the Terms. Non-commercial uses of the work are permitted
without any further permission from Dove Medical Press Limited, provided the work is properly
attributed. For permission for commercial use of this work, please see paragraphs 4.2 and 5 of our Terms.
© 2016 The Author(s). This work is published and licensed by Dove Medical Press Limited. The
full terms of this license are available at https://www.dovepress.com/terms
and incorporate the Creative Commons Attribution
- Non Commercial (unported, 3.0) License.
By accessing the work you hereby accept the Terms. Non-commercial uses of the work are permitted
without any further permission from Dove Medical Press Limited, provided the work is properly
attributed. For permission for commercial use of this work, please see paragraphs 4.2 and 5 of our Terms.