Back to Journals » Psychology Research and Behavior Management » Volume 12
Cognitive biases resulting from the representativeness heuristic in operations management: an experimental investigation
Authors AlKhars M, Evangelopoulos N ![]() , Pavur R
, Pavur R ![]() , Kulkarni S
, Kulkarni S
Received 5 November 2018
Accepted for publication 4 February 2019
Published 10 April 2019 Volume 2019:12 Pages 263—276
DOI https://doi.org/10.2147/PRBM.S193092
Checked for plagiarism Yes
Review by Single anonymous peer review
Peer reviewer comments 2
Editor who approved publication: Professor Mei-Chun Cheung
Mohammed AlKhars,1 Nicholas Evangelopoulos,2 Robert Pavur,2 Shailesh Kulkarni2,†
1Department of Management & Marketing, College of Industrial Management, King Fahd University of Petroleum and Minerals, Dhahran, Kingdom of Saudi Arabia; 2Department of Information Technology and Decision Sciences, G. Brint Ryan College of Business, University of North Texas, Denton, TX, USA
†Shailesh Kulkarni passed away on July 6, 2018
Purpose: Operations managers are subjected to various cognitive biases, which may lead them to make less optimal decisions as suggested by the normative models. In their seminal work, Tversky and Kahneman introduced three heuristics based on which people make decisions: representativeness, availability, and anchoring. This paper aims to investigate the six cognitive biases resulting from the use of the representativeness heuristic, namely, insensitivity to prior probability of outcomes, insensitivity to sample size, misconception of chance, insensitivity to predictability, the illusion of validity, and misconception of regression. Specifically, the paper examines how cognitive reflection and training affect these six cognitive biases in the operations management context.
Methods: For each cognitive bias, a scenario related to operations management was developed. The participants of the experimental study are asked to select among three responses, where one response is correct and the other two are biased. A total of 315 students from the University of North Texas participated in this study and 302 valid responses were used in the analysis.
Results: The results show that in all six scenarios, >50% of the respondents make biased decisions. However, using simple training, the bias is significantly reduced. Regarding the relationship between cognitive biases and cognitive reflection, the results partially support the hypothesis that people with high cognitive reflection ability tend to make less biased decisions. Regarding the effect of training on making biased decisions, the results show that making people aware of the existence of cognitive biases helps them partially to avoid making biased decisions.
Conclusion: Overall, our study demonstrates the value of training in helping operations managers make less biased decisions. Our discussion section offers some related guidelines for creating a professional environment where the effect of the representativeness heuristic is minimized.
Keywords: behavioral operations management, cognitive reflection, training, logistic regression
Introduction
Recent research in behavioral operations management (BOM) shows that operations managers make suboptimal decisions, and are prone to different cognitive biases and decision errors.1,2 For example, the newsvendor problem is a model used to study inventory management under demand uncertainty. Normative models in operations management identify an optimal solution to this problem. However, experimental research involving decision makers revealed that the decisions made were suboptimal. Anchoring and insufficient bias and ex post inventory error minimization were shown to explain the suboptimal behavior in inventory management.3 Subsequent behavioral research in newsvendor and other inventory management settings were conducted to shed light on different aspects such as adaptive learning,4 the role of experience and feedback,5 bounded rationality,2 durability and transit lags,6 the effect of review periods,7 and observation bias.8
Recent reviews in BOM have encouraged researchers to conduct studies where optimal solutions are known and comparisons with the decisions made by participants are performed.9–15 The current paper aims to expand studying cognitive biases occurring in operations management contexts. Six scenarios were developed to study the six cognitive biases resulting from the representativeness heuristic proposed by Tversky and Kahneman.16 These six biases include insensitivity to prior probability of outcomes, insensitivity to sample size, misconception of chance, insensitivity to predictability, the illusion of validity, and misconception of regression.
The present study is significant for three reasons. First, we identify a certain important group of cognitive biases in the OM context. Since operations managers are prone to cognitive biases, the first step in counteracting their negative impact is to identify these biases and increase awareness of their existence at the OM workplace. In their seminal work, Tversky and Kahneman discuss three heuristics and 13 cognitive biases.16 Our review of the OM literature revealed papers that investigate the anchoring and adjustment bias2–8 or the anchoring in the assessment of subjective probability distributions bias.17 To the best of our knowledge, our paper is the first to study the specific six cognitive biases that result from the representative heuristic in the OM context. These will be discussed in detail in the literature review section.
Second, we shed some light onto approaches that can be used to counteract the negative impact of cognitive biases. One effective way is to make people aware of these biases and therefore helps them make more rational decisions. To determine the influence of training on cognitive biases, we designed an experiment where one group of participants received training while the other group did not. By comparing the performance of these two groups, we are able to establish the effectiveness of training in reducing cognitive biases. Experimental studies are widely used in behavioral research. For example, Ancarani et al17 conducted an experiment to study inventory decisions under supply uncertainty.
Third, we investigate how individual differences in cognitive reflection are linked to the six cognitive biases. Dual process theory is a well-known psychological theory used to explain individual differences in rational thinking.18 In this theory, rapid autonomous processes (Type1) are assumed to provide intuitive answers unless intervened by higher order reasoning processes (Type2). The cognitive reflection test (CRT)19 is used to operationalize the cognitive reflection construct. The results of this paper show that people who are high in cognitive reflection tend to make less biased decisions.
The rest of the paper proceeds in the following order. The second section reviews the literature about cognitive biases, debiasing strategies, and cognitive reflection. The third section discusses our methods. The fourth section presents the results from our experimental study. The final section provides a general discussion of the results obtained from the study, contributions of this paper, limitations, and future research.
Literature review
Research in operations management can be categorized into four approaches: 1) case study, 2) empirical, 3) analytical modeling, and 4) behavioral research. Each approach serves a different purpose. The case study approach helps increase the awareness of a new phenomenon by collecting facts or reporting on the organizational context. The empirical approach develops research questions based on existing theories and frameworks. The analytical modeling approach uses mathematical optimization methods to solve complex operations management problems. Behavioral research uses psychological theories and experiments to validate results obtained by analytical models.20 This paper falls in the behavioral category.
Tversky and Kahneman16 extensively studied heuristics used by humans, particularly when they gamble. They argued that, although heuristics, defined as rules of thumb used by people to make decisions, are useful in decision making, they sometimes lead to biases, defined as observed systematic deviations in decision making.16 Tversky and Kahneman identified three widely used heuristics: representativeness, availability, and adjusting and anchoring. Each heuristic may lead to a set of cognitive biases. This paper is going to discuss the six cognitive biases that result from the representativeness heuristic. The following paragraphs briefly discuss these six biases. A more comprehensive discussion can be found in Tversky and Kahneman.16
Representativeness heuristic and the resulting six cognitive biases
As part of the rapid, autonomous type 1 process, decision makers invoke heuristics that may lie outside of conscious awareness. The representativeness heuristic is used to solve problems such as “what is the probability that item A belongs to category B?” or “what is the probability that event A results from process B?” In such cases, people may estimate the extent to which item A represents or resembles category B. If item A is highly representative of category B, then item A is usually rated as a highly probable result of B. However, if item A does not represent category B, or represents category B only slightly, then it is assigned a low probability as a result of B. The representativeness heuristic may lead to six cognitive biases.16 These biases are:
- Insensitivity to prior probability of outcomes
- Insensitivity to sample size
- Misconception of chance
- Insensitivity to predictability
- The illusion of validity
- Misconception of regression
Insensitivity to prior probability of outcomes
Prior probability or the base rate of an outcome is a critical component that a decision maker should consider when evaluating the probability of such an outcome. However, since some people may use the representativeness heuristic, they may ignore the prior probability information. A classic example of this bias is presented by Tversky and Kahneman.16
Steve is very shy and withdrawn, invariably helpful, but with little interest in people, or in the world of reality. A meek and tidy soul, he has a need for order and structure, and a passion for detail.
Subjects are presented with this description and asked whether Steve is more probable to be a farmer or a librarian. Since the description of Steve is a stereotypical representation of a librarian, most people respond that Steve is more likely to be a librarian. However, to answer the question correctly, the decision maker should consider the prior probability, or base rate. In this case, there are ~20 farmers for each librarian in American society, where the original studies occurred. Therefore, although the description of Steve represents a librarian well, he is more likely to be a farmer.16
Insensitivity to sample size
Representativeness heuristic is also employed when subjects estimate the probability of a specific parameter of a sample. If the parameter highly represents the population, the parameter is often given a high probability. This estimation process usually ignores the impact of the sample size. To illustrate this concept, Tversky and Kahneman provided the example of two hospitals. About 45 babies are born in the large hospital while 15 babies are born in the small hospital. Half (50%) of all babies are boys. However, the percentage changes from 1 day to another. For a 1-year period, each hospital recorded the days on which >60% of the babies born were boys. The question was: Which hospital do you think recorded more such days?
- The larger hospital (21)
- The smaller hospital (21)
- About the same (that is, within 5% of each other) (53)
The values shown in parentheses are the number of students choosing each answer.
The results show that more than half the respondents selected the wrong answer (third option). These respondents selected this option because the same statistic represents both the large and small hospitals. However, these respondents ignored the effect of sample size. According to statistical theory, a small sample size allows the statistical parameter to deviate considerably compared to a large sample. Therefore, the large hospital should have a higher probability to stay close to the nominal value of 50%.16
Misconception of chance
This bias occurs when a random process is assumed to produce random outcomes both globally and locally. For example, when tossing a fair coin six consecutive times, the outcome H-T-H-T-T-H is perceived more probable than the outcome H-H-H-T-T-T. This is because the first outcome represents, in a small scale, the randomness we would observe if we tossed a coin on a much larger scale. Moreover, the first outcome is perceived more probable than the outcome H-H-H-T-T-T because this last outcome lacks the fairness representation of the coin tossing process.16 Hahn and Warren21 questioned the validity of this bias. They argued that human experience is finite and that short-term memory has a limited capacity. Taking these two assumptions into consideration, they concluded that the so-called “misconception” of chance has probabilistic support. They differentiate whether the sample from which the sequences are drawn is finite or infinite. If the sample is infinite, then there is a bias. However, if the sample is finite then there is no bias.21 In our paper the sample is assumed to be infinite, therefore we expect a bias.
Gambler’s fallacy is one common manifestation of this bias. When a gambler is faced with a set of red appearing on roulette wheels, he will continue playing, assuming that a black is due to balance the outcomes of this random process.16
Insensitivity to predictability
Predicting future events is a common business practice. Analytics’ professionals predict events such as the price of a stock or the demand of a product. Quite often, the representativeness heuristic is used to provide such predictions. For example, when asked to predict the profitability of a company, the forecasting team may use the description of the company as a predictor of its profit. A company with a positive description is usually assigned to a higher profit compared with a company with a less positive description. The favorability of the description should not be used in the prediction process since it is not a reliable source of predictability. According to normative statistics theory, the extremeness and range of predicted values should depend on predictability. If predictability is zero, the same value such as the average profit should be given to all companies regardless of their descriptions. On the other hand, if the predictability is perfect, then the predicted values should match the actual values, and the ranges of the predicted values should be equal to the range of outcomes. Overall, the higher the predictability, the wider the range of the predicted values.16
The illusion of validity
The illusion of validity or overconfidence is a serious bias that results from the use of the representativeness heuristic. Overconfidence means that people exaggerate the accuracy of their prediction of an outcome although there are other important factors that affect the accuracy of prediction. In the Steve example presented above, participants indicated high confidence level on their wrong answer that Steve is a librarian.16 Recent research classified overconfidence into three categories: overestimation, overplacement, and overprecision. Overestimation occurs when people think they are better than they truly are. Overplacement occurs when people believe they are better than others. Overprecision occurs when people have exaggerated faith that they know the truth.22 In this paper, overprecision is the facet of overconfidence that will be considered.
Misconception of regression
If an extreme outcome (ie, highly positive or highly negative) occurs, then people expect the same outcome to repeat subsequently. Statistically, this is not the case. Extreme outcomes usually regress toward the mean in subsequent trails. Galton extensively studied the phenomenon of regression toward the mean about 130 years ago. In this phenomenon, a group performance usually deviates around the mean value over time. Therefore, within a group of students who took a test, if 10 students are hand-picked because they scored high on the test, those students tend to score lower in a comparable test taken some time later. Similarly, if 10 other students are hand-picked because they scored low on the first test, they tend to score higher on the second, comparable test. This concept of regression toward the mean is not intuitive to many people. Therefore, if a child scores low on a test, and if her parents punish her, when they observe her performance increasing on the next test, they may draw the conclusion that punishment worked. On another occasion, if the child does well and gets praised for her excellent performance, when the parents observe a performance deterioration on the next test, they may erroneously conclude that, while punishment improves performance, praising brings about performance deterioration. The key here is that parents should realize the important impact of regression toward the mean.16
Debiasing strategies
Since people are prone to cognitive biases, research was conducted to suggest various intervention strategies designed to reduce them.23 The intervention strategies can be classified into three categories: incentives, optimizing choice architecture and training.24 Morewedge et al24 conducted two longitudinal experiments to determine the immediate and long-term effect of training on six cognitive biases. Experiment 1 addressed three biases: bias blind spot, fundamental attribution error, and confirmation bias. Experiment 2 addressed three other biases: anchoring, representativeness, and social projection. They found that one-shot debiasing training interventions resulted in persistent reduction in these six cognitive biases. They concluded that training is an effective debiasing strategy that can be added to the other strategies such as improvement in incentives and choice architecture. Nisbett et al25 proposed that when people are trained about the law of large numbers, they can apply the rule correctly in other situations for which it is applicable. They investigated the effects of given abstract instruction as well as examples about the law of large numbers. To test this proposition, they ran a laboratory experiment in which subjects received four versions of the survey: no training, abstract rule training only, some examples training only, and both rule and examples training. Results showed that, compared with the group that received no training, there was a significant improvement in understanding the law of large numbers in the training group. Within supply chain management, Kaufmann et al26 discuss strategies that could counter the negative impact of the cognitive biases. They defined debiasing strategies as “the approaches and sets of actions aimed at reducing the detrimental influence of decision biases and as such to enhance the rationality and effectiveness of decisions.” The three proposed strategies are: 1) expanding the rational boundary of decision makers, 2) minimizing the decision-making environmental dynamics, and 3) minimizing the decision-making environmental complexity. Expanding the bound of rationality of decision makers can be done through 1) creating awareness of cognitive biases, 2) decomposing a decision task into simpler subtasks, and/or 3) looking at the situation from different perspectives.26 The first strategy calls for helping decision makers make a more rational decision at a given level of uncertainty. By training people about such possible biases, their rational boundary will expand, and they will make less biased decisions. The second and third strategies deal with the environment in which decisions are made. By minimizing the dynamics and complexity of the environment, the decision maker tends to make more rational and informed decisions. However, since it is difficult to control the environment,27 reducing the cognitive biases using the second and third strategy will not be discussed further in this paper. Instead, the first strategy of expanding the rational boundary of the decision maker will be adopted.
The obvious way to expand the rational boundary is to make people aware of their own cognitive biases. Providing training seems to be an effective way to achieve this goal.27 There are many forms of training. One form is to use games to counter the negative impact of cognitive biases.28 Another possible form is to provide simple training programs identifying the cognitive biases and examples of such biases.25
Based on this discussion, the following six hypotheses are proposed:
H1:Given a scenario that elicits the representativeness heuristic, providing training will decrease the likelihood that subjects are prone to the “Insensitivity to Prior Probability” bias.
H2:Given a scenario that elicits the representativeness heuristic, providing training will decrease the likelihood that subjects are prone to the “Insensitivity to Sample Size” bias.
H3:Given a scenario that elicits the representativeness heuristic, providing training will decrease the likelihood that subjects are prone to the “Misconception of Chance” bias.
H4:Given a scenario that elicits the representativeness heuristic, providing training will decrease the likelihood that subjects are prone to the “Insensitivity to Predictability” bias.
H5:Given a scenario that elicits the representativeness heuristic, providing training will decrease the likelihood that subjects are prone to the “The Illusion of Validity” bias.
H6:Given a scenario that elicits the representativeness heuristic, providing training will decrease the likelihood that subjects are prone to the “Misconception of Regression” bias.
Cognitive reflection and dual-process theory
The dual-process theory is used as a theoretical framework to explain the individual differences observed in answering the scenarios presented in this research. This theory proposed two types of reasoning processes. When faced with a novel situation, Type 1 generates a default response. This default answer may or may not change depending on the intervention of Type 2 process. Type 1 process usually correlates with attributes such as being fast, parallel, nonconscious, and contextualized, while Type 2 usually correlates with attributes such as being slow, serial, consciou,s and abstract. Moreover, biased responses typically correlate with Type 1 while normative responses typically correlate with Type 2 process.18
Cognitive reflection is defined as the tendency of an individual to allow his/her Type 2 process to override the intuitive responses suggested by Type 1.29 Cesarini et al30 showed that people scoring high in cognitive reflection tend not to exhibit the cognitive biases of illusion of control, insensitivity to sample size, and representativeness. Moreover, for the newsvendor problem, cognitive reflection is a better predictor of performance than college major, years of experience, and managerial position.29
To measure the cognitive reflection of an individual, the CRT has been proposed.19 This is a simple test with three questions. The three questions are shown in Table 1.
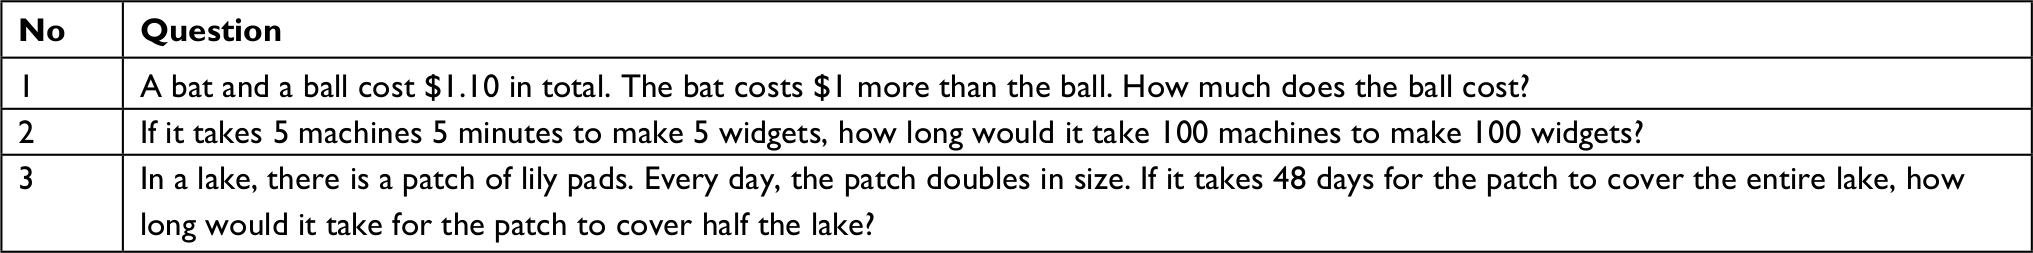 | Table 1 The cognitive reflection test |
For each question, there is an intuitive but wrong answer, and a reflective and correct answer. The intuitive answer to question 1 is 10 cents while the reflective answer is 5 cents. For question 2, the intuitive answer is 100 minutes while the correct answer is 5 minutes. Finally, the intuitive answer for question 3 is 24 days while the valid answer is 47 days. Frederick defines the score of CRT as the sum of the correct answers to the three questions.19 Therefore, the possible values of the CRT are 0, 1, 2, and 3. If a respondent answers all questions right, their score is 3. On the other hand, if another respondent answers all questions wrong, their CRT score is 0.
Based on the previous discussion, six additional hypotheses are proposed:
H7:Given a scenario that elicits the representativeness heuristic, subjects with a high score of CRT are less prone to the “Insensitivity to Prior Probability” bias.
H8:Given a scenario that elicits the representativeness heuristic, subjects with a high score of CRT are less prone to the “Insensitivity to Sample Size” bias.
H9:Given a scenario that elicits the representativeness heuristic, subjects with a high score of CRT are less prone to the “Misconception of Chance” bias.
H10:Given a scenario that elicits the representativeness heuristic, subjects with a high score of CRT are less prone to the “Insensitivity to Predictability” bias.
H11:Given a scenario that elicits the representativeness heuristic, subjects with a high score of CRT are less prone to the “The Illusion of Validity” bias.
H12:Given a scenario that elicits the representativeness heuristic, subjects with a high score of CRT are less prone to the “Misconception of Regression” bias.
Methodology
Experimental design
Surveys and designed experiments are used to conduct this research. Designed experiments are typically used in behavioral studies in operations management and supply chain management to determine cause and effect relationship.31 The two main independent variables are the cognitive reflection and the training given to participants about cognitive biases. The dependent variable is whether the decision selected by a participant is biased. One group of participants was given the scenarios with training, and the other group was given the scenarios without training. The main goal of using experimental design is to investigate the effect of training on making less biased decisions.
The survey included six scenarios. Each scenario addressed one cognitive bias. Table 2 shows the names of the scenarios and their corresponding biases. The authors selected the scenarios that cover different aspects of operations management. For example, the restaurant scenario is related to quality control. This scenario is based on actual collaboration between one of the authors and a store manager of a restaurant chain in California. The gas station addresses short-term forecasting and inventory management of gasoline and diesel. This scenario was developed completely by the authors of this paper. Similarly, the truck scenario, considered as a transportation problem, was completely developed by the authors. The sports scenario belonging to purchasing and supply chain partnering, and the copy centers’ scenarios, belonging to forecasting, were based on case studies by Simpson and Hancock.32 These case studies were simplified to focus primarily on cognitive biases. Finally, the forecasting scenario was based on a case study by Kahneman.33 Three rounds of data collection were conducted. In each round the data were analyzed, comments and feedback from participants were reviewed, and peer researchers’ ideas were incorporated to ensure that descriptions of the scenarios were understandable by participants.
 | Table 2 Scenarios used to study the cognitive biases associated with the representativeness heuristic |
After each scenario, a question is presented, and the respondent has to select one answer. Only one answer is correct according to normative statistical theory. The other answers are wrong although some of them are intuitively correct. The six scenarios along with the justification of the correct answers are available at Mendeley Data; doi: 10.17632/8jcwbmzpnt.1.
Covariates
In addition to training and CRT as the main independent variables, the study considered two covariates. The first is gender. The other covariate is risk-taking attitude. Risk exists in many situations such as demand and supply.34 There has been a big debate on whether to consider risk-taking as a personal trait or to consider it as a situational factor. In one extreme, those who advocate the personality trait option assume that risk preference is fixed across all situations. Thus, if a person is risk seeking, he/she will exhibit this attitude in all situations. However, research shows that this is not true in all cases. Some studies compared how managers deal with their own money and the money of their companies. These studies show the risk attitude for those managers are different in dealing with the two sources of money. This suggests that risk is not completely a personality trait. Now, there is a trend to accept that risk is affected by both personal traits and situational factors.34 Since life has diverse situations, risk should not be evaluated using only the financial domain. A scale called domain-specific risk-taking (DOSPERT) has been devised to measure risk in five domains.34 These five domains are ethical, financial, health/safety, recreational, and social. Each domain is assessed using six questions. A 7-point Likert scale is used to measure the risk perception of the participants. The scale is shown in the Supplementary materials online.
Survey instrument
A paper-based survey was distributed to the participants of the study. Two points should be emphasized in designing the survey. The first addresses the ordering effect of the six scenarios. If all six scenarios are presented in the same order, some participants may pay attention to the first scenarios and less to the last ones. This may lead to higher rates of correct responses toward the beginning of the survey. To counteract this effect, the scenarios were placed following a balanced Latin square design.35 Since there were six scenarios, a 6×6 design was adopted.
The second point is regarding the impact of training on reducing cognitive bias. To achieve this goal, one group of participants received a treatment that did not include training. This is the control group. The other group (experimental group) received a treatment with training. By comparing the performance of these two groups, the impact of training can be established.
Based on these design considerations, 12 versions of the survey were developed. The order of the scenarios and the presence or absence of training are shown in Table 3. Only one of these versions was given to each participant in the study.
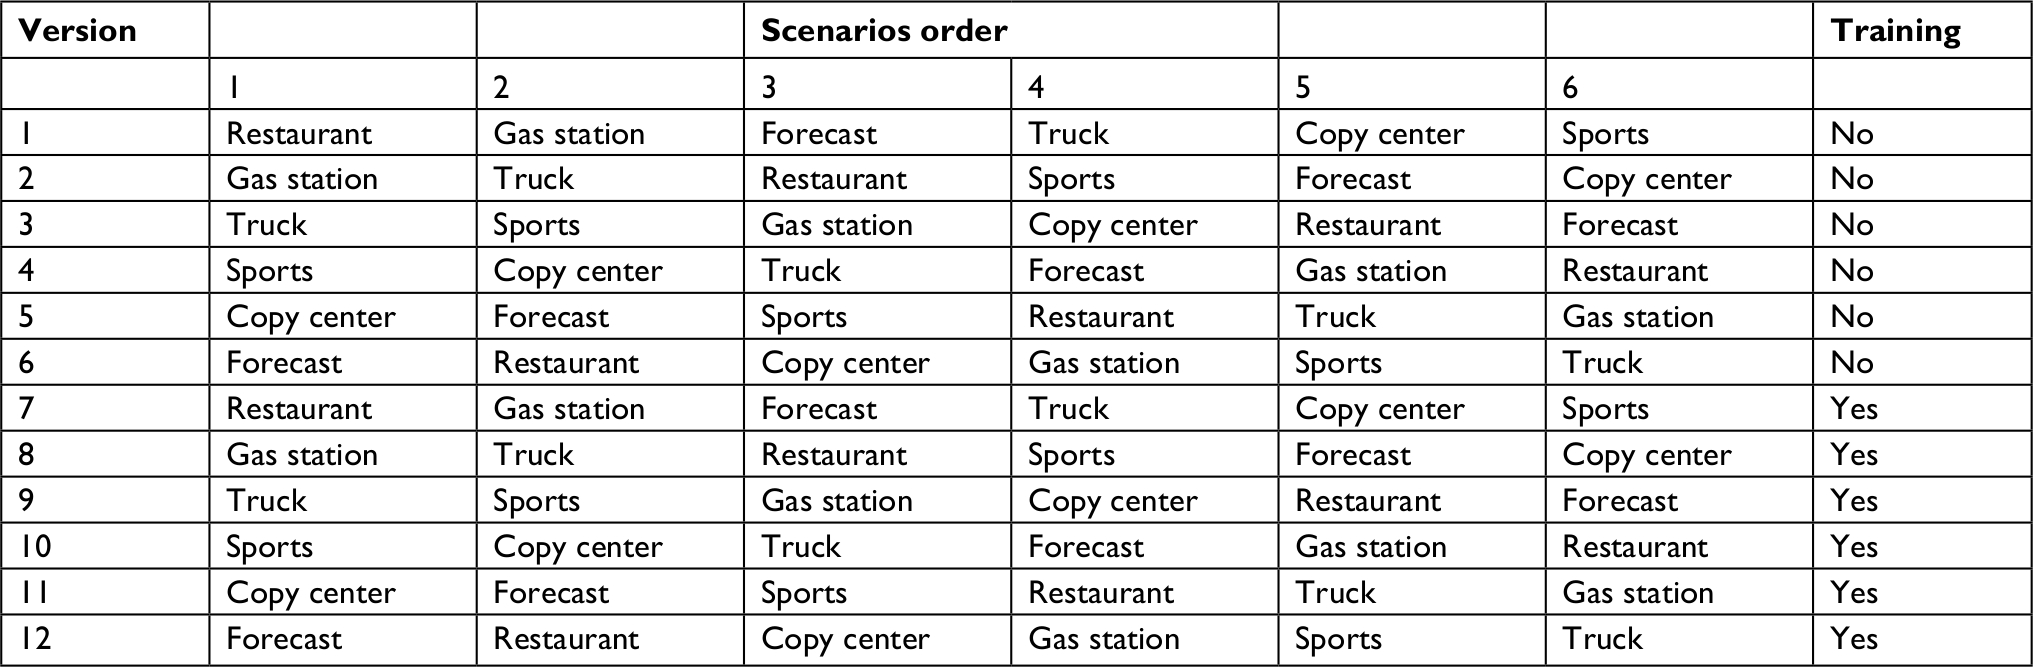 | Table 3 Order of the six scenarios and presence of training in the 12 versions of the survey |
Target population and study sample
The participants were graduate and undergraduate students enrolled in business statistics and operations management courses offered in the College of Business at University of North Texas, a large public university in the United States. The participants were a good proxy for the operations manager population, since most of them were either graduating soon and expected to obtain a business job, or already had some business experience, including experience in operations or service. Moreover, all participants had taken quantitative courses that should have prepared them for the situations addressed in the scenarios and help them avoid the cognitive biases studied in this paper. They were given bonus points in their courses in exchange for participation in this survey.
Data analysis
The total number of responses received in this study was 315. Among them, 13 responses were considered invalid because they either left parts of the survey unanswered or answered by providing identical responses to large groups of questions. Therefore, 302 responses, among which 136 obtained from female respondents, were used in the analysis. The original data are available at Mendeley Data doi:10.17632/nrfgybx3f2.1.
Results
CRT
The results of the CRT are shown in Table 4. The table shows that the group that answered all three questions wrong had the highest percentage, equal to 43%. The percentage decreases gradually with increasing scores of CRT. Only 15% of the participants answered all three questions correctly.
 | Table 4 CRT score distribution Abbreviation: CRT, cognitive reflection test. |
Table 5 shows the relationship between CRT scores and providing biased or incorrect answers. The last row of the table shows that in all six scenarios, >50% of the responses are biased. Moreover, for the first four scenarios, there is an inverse relationship between the CRT score and making biased decisions. This inverse relationship is not shown in the copy center and forecast scenarios.
 | Table 5 Relationship between CRT and biased decisions Abbreviation: CRT, cognitive reflection test. |
Training
One main objective of this study paper was to study the effect of providing training about cognitive biases on making more rational decisions. To achieve this objective, half of the respondents were given the scenarios with training, while the other half received the scenarios without training. The relationship between training and making biased decisions is shown in Table 6. In all six scenarios, providing training reduced the probability of making biased decisions. However, the effectiveness of training is not equal for all scenarios. The drop in the percentage of biased decisions is more in the first four scenarios compared with the last two.
 | Table 6 Relationship between training and biased decisions |
Risk-taking
The risk-taking attitude of the respondents was assessed across five domains: ethical (E), financial (F), health/safety (H/S), recreational (R), and social (S). Each domain is measured using six questions with a total of 30 questions. Missing data have been replaced using rounded average for respective question. Factor analysis using principal component with varimax rotation was used to analyze the 30 questions. Four factors had loading of only one question on them; therefore, the corresponding questions were excluded from further analysis. The remaining factors included questions in the financial, the social, and the recreational domain.
Cronbach’s alpha for the first factor was 0.806, which is considered high in reliability. Cronbach’s alphas for the other four factors were moderate. However, they will be retained in the analysis because they are >0.50.
Logistic regression results
To analyze the data in this study, logistic regression was used. It has been selected because the dependent variable in each scenario is binary. Whenever a certain answer was correct, the value of the dependent variable was set to 0, indicating that there is no cognitive bias. Whenever the answer was wrong, the value of the dependent variable was set to 1, indicating that there is a bias. There are two main independent variables, CRT and training, and nine more independent variables, including covariate and interaction terms. The full list is shown in Table 7. Because of space limitations, only significant variables (at 0.10 significance level) for each scenario are reported here.
 | Table 7 Dependent and independent variables Note: *An interaction term between two independent variables. Abbreviations: CRT, cognitive reflection test; RT, risk-taking. |
Restaurant
Four factors are significant in the restaurant scenario. The results are shown in Table 8. Training is significant with a negative sign as expected. The two financial factors of risk-taking are significant but with opposite signs. RT_financial 1 has a positive sign while RT_financial 2 has a negative sign. Finally, gender is a significant factor with a negative sign.
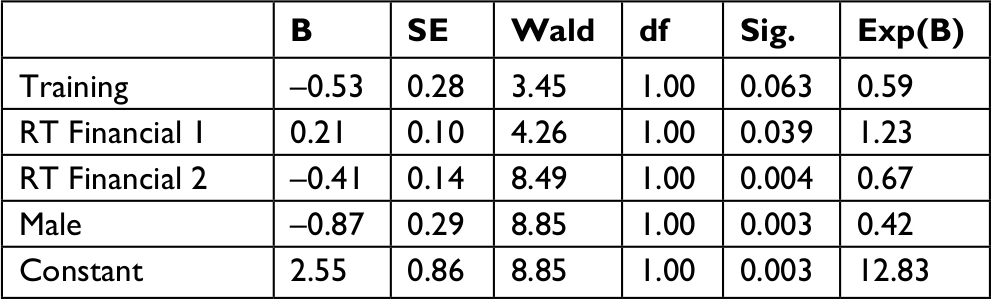 | Table 8 Logistic regression for the restaurant scenario (only significant variables) Abbreviation: RT, risk-taking. |
Gas station
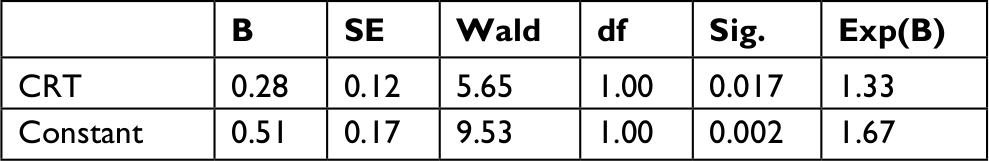
The results for the Gas station scenario are shown in Table 9. CRT and RT_Financial 2 are the only significant factors in the gas station scenario. CRT has a negative sign as expected while RT_financial 2 has a positive sign.
 | Table 9 Logistic regression for the gas station scenario (only significant variables) Abbreviations: CRT, cognitive reflection test; RT, risk-taking. |
Truck
The results for the Truck scenario are shown in Table 10. The two main independent variables, CRT and training, are significant at 10%. Their signs are negative, which is consistent with the theory of this paper.
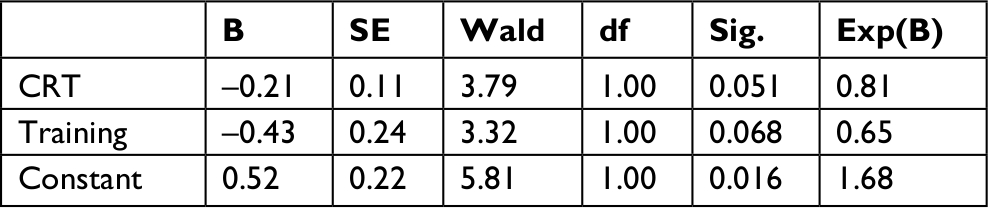 | Table 10 Logistic regression for the truck scenario (only significant variables) Abbreviation: CRT, cognitive reflection test. |
Sports
The results for the Sports scenario are shown in Table 11. CRT is not significant in this scenario. However, it is included in the table of significant factors because the interaction term between CRT and gender is significant. Training is significant with a negative sign as expected. RT_financial 2 is significant with a positive sign. RT_social 1 is significant at the 10% level with a positive sign. Gender has a positive sign and is significant at 10%. Finally, the interaction term between CRT and gender is significant at the 10% level with a negative sign.
 | Table 11 Logistic regression for the sport scenario (only significant variables) Note: *An interaction term between two independent variables. Abbreviations: CRT, cognitive reflection test; RT, risk-taking. |
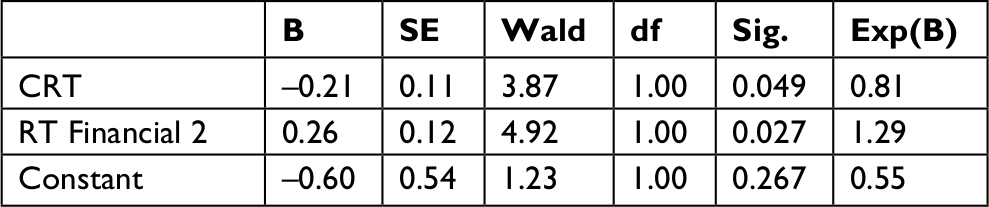
Copy center
The results for the Copy center scenario are shown in Table 12. CRT is the only significant factor. However, the sign of CRT is positive, which contradicts the theory. This indicates that there is no significant factor in this scenario.
 | Table 12 Logistic regression for the copy center scenario (only significant variables) Abbreviation: CRT, cognitive reflection test. |
Forecast
There are no significant factors in the Forecast scenario.
Table 13 summarizes the significant factors for all six scenarios. The signs in parentheses indicate whether the coefficient is positive or negative.
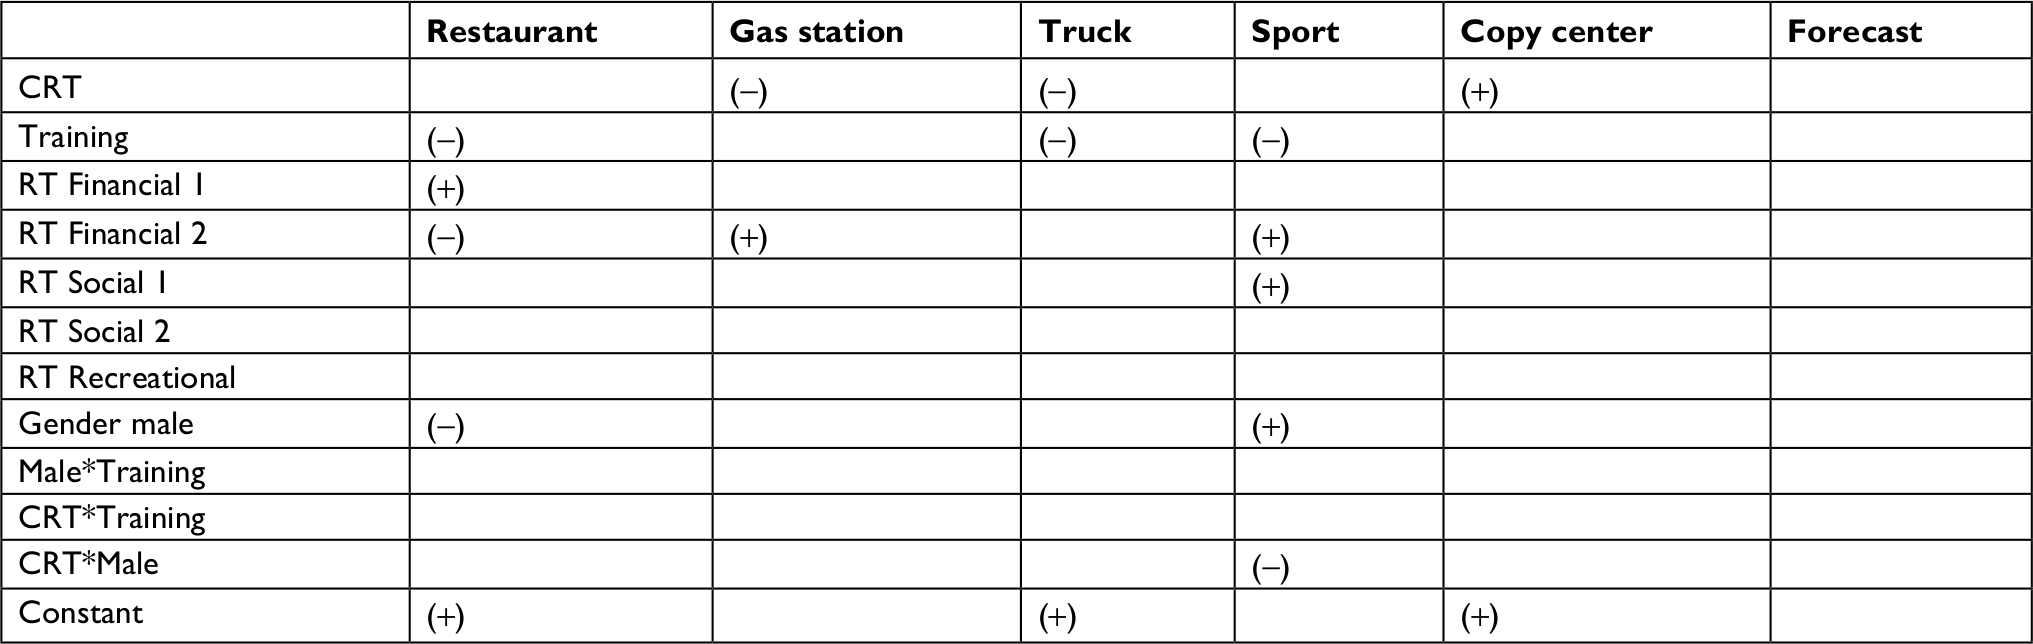 | Table 13 Summary of significant factors for all scenarios Note: *An interaction term between two independent variables. Abbreviations: CRT, cognitive reflection test; RT, risk-taking. |
To get the overall picture of the effect of the CRT and training as well as other independent variables, the data for all six scenarios were analyzed together. The results are shown in Table 14. The results indicate that both CRT and training are significant factors while other covariates and interaction terms are not significant.
 | Table 14 Logistic regression for all scenarios combined (only significant variables) Abbreviation: CRT, cognitive reflection test. |
Discussion
This study employed experimental scenarios derived from real-world problems in operations management contexts. The findings establish that the subjects exhibited systematic deviations from expected rational decisions. Although Tversky and Kahneman did their research studies in economic and financial contexts, this paper shows that cognitive biases also occur in operations management contexts. In all six scenarios included in this study, >50% of the responses are biased. However, there are differences in the percentages of biased decisions across the six scenarios. In the copy center scenario, it seems difficult for participants to resist the intuition that sales of BA courses are higher than sales of EC courses. It takes the participant a long time and some deep thinking to realize that the important factors to consider in solving this problem are the number of enrolled students and whether the course is required or optional. In such cases, better decision support tools, if available, may need to be provided to the decision maker in order to overcome this cognitive bias.
For the forecast scenario, Kahneman states that the concept of regression toward the mean is particularly difficult.33 Sir Francis Galton, the pioneer of regression analysis, had studied this concept for a long time until he was able to fully comprehend it. It seems that simple training is not enough to counteract this cognitive bias.
For the other four scenarios, CRT and training are moderately significant in predicting the occurrence of cognitive biases. People who score high on CRT tend to make less biased decisions. Moreover, providing even some very simple training can be useful in reducing cognitive biases. The following paragraphs will discuss in detail the effects of CRT, training, risk-taking, and gender on cognitive biases.
The CRT results are consistent with the literature. The highest percentage of students scored a 0 in CRT while the lowest percentage scored a 3. This supports the dual-process theory. Intuitive answers are proposed by a Type 1 reasoning process. After reflective thinking, a Type 2 process may or may not override the intuitive answers. The study shows that CRT is a significant predictor in the performance of the gas station and truck scenarios. In practice, CRT can be used by companies to evaluate the cognitive reflection of their potential employees. Employees scoring high in cognitive reflection are expected to make less biased decisions. However, companies should not overly depend on this test alone, since it is not predicting all cognitive biases in all scenarios.
Training was effective in reducing the cognitive biases in three scenarios: restaurant, truck, and sport. The percentage of biased decisions dropped the most for the sports scenario, which draws from purchasing and supply chain partnering. One explanation for the success of training in this scenario may be that the respondents may have had a greater interest in this type of problem as it is a supply chain management scenario and many students have studied problems on this topic. This study presents the simplest form of training including a description of the bias and an example of its occurring. This simple training helps participants to avoid some of the cognitive biases and make rational choices. Companies may provide their employees with an extensive course about cognitive biases for, say, 1 week. The course may include elaborate discussions on the cognitive biases. The attendees may be asked to provide and share examples of such cognitive biases in their area of work. This may help to clarify the concept better by linking it to examples of real problems the trainees have already experienced.
Risk-taking was measured across five domains. However, only three domains showed reliable results: financial, social, and recreational. In the financial domain, two factors emerged. The first factor is related to betting behavior while the second factor is related to investment behavior. The betting factor is significant only in the restaurant scenario with a positive sign. This means that people who see betting as risky, tend to make more biased decisions. For the investment factor, it is significant in three scenarios: restaurant, gas station, and sports. The sign is negative in the restaurant scenario, while it is positive in the gas station and sports scenarios. Similarly, the first factor of the social domain is significant and positive in the sports scenario. It seems that people who are risky in their attitude tend to make more biased decisions. This can be linked to dual process theory. A person who is risky may use his/her intuition more often, which leads them to more biased decisions. Therefore, companies may use the DOSPERT test to assess the risk-taking perception of the individual. If a person scores high on this test, this is an indication that she may use her intuition more and may make more biased decisions. Again, this test should be used cautiously because it cannot predict cognitive biases in all scenarios.
Gender is significant in only two scenarios. In the restaurant scenario, the sign of the coefficient is negative while it is positive in the sports scenario. This implies that males make less biased decisions in the restaurant scenario and more biased decisions in the sports scenario. The study results indicate that gender is not a strong predictor of cognitive biases, and males and females are not different in this aspect.
In this study, six hypotheses were related to CRT, and the other six were related to training. Table 15 summarizes the hypothesis testing results. Three hypotheses were supported in the training construct. The corresponding scenarios were restaurant, truck, and sports. For the CRT construct, two hypotheses are supported in the gas station and truck scenarios.
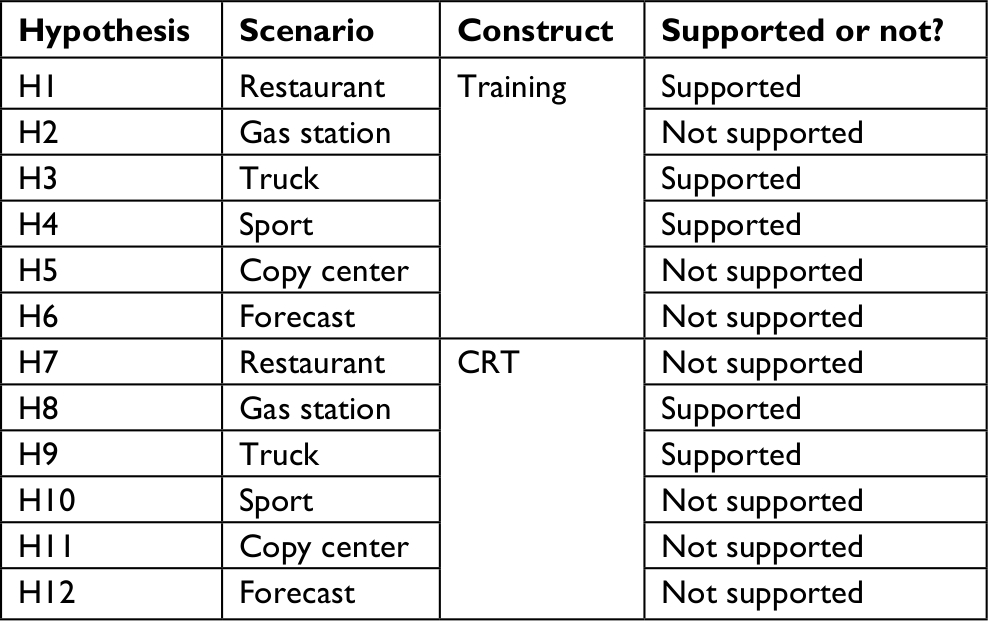 | Table 15 Summary of hypothesis testing results Abbreviation: CRT, cognitive reflection test. |
Conclusion
Contributions
This study contributes to the literature in three main aspects. The first is that the study addresses an under-researched area in the operations management field. Schweitzer and Cachon3 started investigating cognitive biases in inventory management using the newsvendor problem, and much of the subsequent research in cognitive biases studied the newsvendor problem from various aspects. Our study presents six scenarios in different areas of operations management. The restaurant scenario represents the quality control area. The gas station, copy center, and forecast scenarios address different forecasting issues. The truck scenario can be considered a transportation problem. The sports scenario represents purchasing and supply chain partnering. This research shows that cognitive biases could occur in a wide range of OM contexts.
The second aspect is related to the research design of this study. Experimental design is time-consuming, yet its results can be interpreted in terms of cause and effect. In this study, since the group receiving training performed better than the group receiving no training in many scenarios, it can be concluded that cognitive biases can be counteracted through training. This result suggests that companies could benefit from providing their OM managers and professionals with some regular simple training about cognitive biases to help them make rational decisions.
Finally, this study uses CRT to measure cognitive reflection and DOSPERT to measure the risk-taking attitude of participants. The study shows that these tests can be used by companies to predict, to some extent, their employee’s propensity in making biased decisions. However, companies should be cautious not to over depend on these two tests and should use them in conjunction with other tools.
Limitations
There are three main limitations in this study. The first is related to the external validity. The study was conducted among students enrolled in the College of Business at the University of North Texas. Although most of these students are expected to work as business professionals after their graduation, they are still in the study period of their life. Therefore, the results are difficult to generalize to other situations. As a follow-up study, these scenarios can be distributed to OM professionals, and the results should be compared with the results of this study to improve the external validity.
The second limitation is that each student received all six scenarios. Since these scenarios need deep thinking, it is possible that the students became tired. The copy center and forecast scenarios are particularly difficult to solve. In subsequent research, not more than three or four scenarios should be given to each participant, to allow him or her enough time for careful consideration.
The third limitation was the form of provided training. In the present study, one group received no training while the other group received training consisting of a definition of the cognitive bias along with an example. Additional forms of training, as well as training sessions that occur at points in time that are independent of the scenarios are needed to produce more generalizable results.
Future research
An obvious direction for future research is to develop scenarios that cover the other seven cognitive biases proposed by Tversky and Kahneman.16 This paper studied the six cognitive biases related to the representativeness heuristic. There are four additional cognitive biases related to the availability heuristic and three more related to the anchoring and adjustment heuristic. By studying the remaining cognitive biases, researchers may be able to show that all 13 cognitive biases are applicable to OM contexts.
A second direction for future research would be to investigate how decision making in OM is related to non-cognitive abilities of the decision makers. For example, big-five theory can be used to predict cognitive biases in these scenarios.
A third direction would be to focus on one cognitive bias and create multiple scenarios to test this bias. For example, the restaurant scenario has been used to study the insensitivity to prior probability of outcome bias. By creating additional scenarios to study this bias, the scenario as a source of variation can be taken into account.
A fourth direction is to adopt an ecological rationality research strategy instead of logical rationality research strategy.36 This paper used the logical rationality in which a single answer to a scenario is considered correct based on a normative theory. The responses of participants are compared with this single answer. Individuals whose answers are identical to the correct answers are considered rational. Otherwise, they are considered irrational. On the other hand, ecological rationality investigates whether the strategy used by an individual matches his/her goals within the structural properties of the environment in which the strategy is applied. The individual is considered rational if he/she uses a strategy that leads him/her to the goals within the environment. For example, our study participants may have decided to provide quick answers because saving time was more important to them than providing correct answers. Given a different environment, such as a professional setting where their livelihood and their career may be at stake, the same individuals may have behaved differently. Future research can use this ecological rationality to evaluate the responses of individuals in OM contexts.
Ethical statement
This research was conducted in accordance with the ethical guidelines provided by the University of North Texas, and approved by the IRB of the university. Each participant signed an informed consent form. To ensure confidentiality of each participant, the signed consent form was removed from the responses so that the participant was given bonus points and the anonymous responses were used for the research purpose. Each participant was informed in the consent form that their participation is voluntary and there is no harm in their participation in the study. Our research was conducted with the standard research principles. Therefore, we believe it is independent and impartial.
Acknowledgments
This article reports findings from a dissertation in partial fulfillment of the requirements for Doctor of Philosophy for Mohammed AlKhars. We thank Professor Mei-chun Cheung, Associate Editor-in-Chief of the Journal of Psychology Research and Behavior Management, for his constructive comments. We thank also the two anonymous reviewers for their comments which have improved the manuscript.
Disclosure
The authors report no conflicts of interest in this work.
References
Loch CH, Wu Y. Behavioral operations management. Found Trends® Technol Inform Operat Manage. 2007;1(3):121–232. | ||
Su X. Bounded rationality in Newsvendor models. M&SOM. 2008;10(4):566–589. | ||
Schweitzer ME, Cachon GP. Decision bias in the newsvendor problem with a known demand distribution: experimental evidence. Manage Sci. 2000;46(3):404–420. | ||
Bostian AJA, Holt CA, Smith AM. Newsvendor “pull-to-center” effect: adaptive learning in a laboratory experiment. M&SOM. 2008;10(4):590–608. | ||
Bolton GE, Katok E. Learning by doing in the Newsvendor problem: a laboratory investigation of the role of experience and feedback. M&SOM. 2008;10(3):519–538. | ||
Bloomfield RJ, Kulp SL. Durability, transit lags, and optimality of inventory management decisions. Prod Oper Manag. 2013;22(4):826–842. | ||
Katok E, Thomas D, Davis A. Inventory service-level agreements as coordination mechanisms: the effect of review periods. M&SOM. 2008;10(4):609–624. | ||
Rudi N, Drake D. Observation bias: the impact of demand censoring on newsvendor level and adjustment behavior. Manag Sci. 2014;60(5):1334–1345. | ||
Boudreau J, Hopp W, McClain JO, Thomas LJ. On the interface between operations and human resources management. M&SOM. 2003;5(3):179–202. | ||
Chopra S, Lovejoy W, Yano C. Five decades of operations management and the prospects ahead. Manag Sci. 2004;50(1):8–14. | ||
Bendoly E, Donohue K, Schultz KL. Behavior in operations management: assessing recent findings and revisiting old assumptions. J Oper Manage. 2006;24(6):737–752. | ||
Gino F, Pisano G. Toward a theory of behavioral operations. M&SOM. 2008;10(4):676–691. | ||
Bendoly E, Croson R, Goncalves P, Schultz K. Bodies of knowledge for research in behavioral operations. Prod Oper Manag. 2010;19(4):434–452. | ||
Croson R, Schultz K, Siemsen E, Yeo ML. Behavioral operations: the state of the field. J Oper Manag. 2013;31(1-2):1–5. | ||
Katsikopoulos KV, Gigerenzer G. Behavioral operations management: a blind spot and a research program. J Supply Chain Manag. 2013;49(1):3–7. | ||
Tversky A, Kahneman D. Judgment under uncertainty: heuristics and biases. Science. 1974;185(4157):1124–1131. | ||
Ancarani A, Di Mauro C, D’Urso D. A human experiment on inventory decisions under supply uncertainty. Intl J Prod Econ. 2013;142(1):61–73. | ||
Evans JSBT, Stanovich KE. Dual-process theories of higher cognition: advancing the debate. Perspect Psychol Sci. 2013;8(3):223–241. | ||
Frederick S. Cognitive reflection and decision making. J Econ Perspect. 2005;19(4):25–42. | ||
Sodhi MS, Tang CS. Guiding the next generation of doctoral students in operations management. Int J Prod Econ. 2014;150:28–36. | ||
Hahn U, Warren PA. Perceptions of randomness: why three heads are better than four. Psychol Rev. 2009;116(2):454–461. | ||
Moore DA, Schatz D. The three faces of overconfidence. Soc Personal Psychol Compass. 2017;11(8):e12331. | ||
Fischhoff B. Debiasing. In: Judgment Under Uncertainty: Heuristics and Biases Kahneman D, Slovic P, Tversky A, editors. Cambridge, UK: Cambridge University Press; 1982:422–444. | ||
Morewedge CK, Yoon H, Scopelliti I, Symborski CW, Korris JH, Kassam KS. Debiasing decisions: improved decision making with a single training intervention. Policy Insights Behav Brain Sci. 2015;2(1):129–140. | ||
Nisbett RE, Fong GT, Lehman DR, Cheng PW. Teaching reasoning. Science. 1987;238(4827):625–631. | ||
Kaufmann L, Michel A, Carter CR. Debiasing strategies in supply management decision-making. J Bus Logist. 2009;30(1):85–106. | ||
Graf L, König A, Enders A, Hungenberg H. Debiasing competitive irrationality: how managers can be prevented from trading off absolute for relative profit. Eur Manage J. 2012;30(4):386–403. | ||
Dunbar NE, Jensen ML, Miller CH. Mitigating cognitive bias through the use of serious games: effects of feedback. International Conference on Persuasive Technology: Springer, Cham; 2014:92–105. | ||
Moritz BB, Hill AV, Donohue KL. Individual differences in the newsvendor problem: behavior and cognitive reflection. J Oper Manag. 2013;31(1-2):72–85. | ||
Cesarini D, Johannesson M, Magnusson PKE, Wallace B. The behavioral genetics of behavioral anomalies. Manag Sci. 2012;58(1):21–34. | ||
Croson R, Donohue K. Experimental economics and supply-chain management. Interfaces. 2002;32(5):74–82. | ||
Simpson N, Hancock P. Practical Operations Management. Naperville, IL: Hercher Publishing Incorporated; 2013. | ||
Kahneman D. Thinking, Fast and Slow. New York, NY: Farrar, Straus and Giroux. 2013. | ||
Blais A-R, Weber EU. A domain-specific risk-taking (DOSPERT) scale for adult populations. Judgment Decis Making. 2006;1(1):33–47. | ||
MacKenzie IS, Human-Computer Interaction: An Empirical Research Perspective. Burlington, MA: Morgan Kaufmann. 2013; 175-176. | ||
Arkes HR, Gigerenzer G, Hertwig R. How bad is incoherence? Decision. 2016;3(1):20–39. |
 © 2019 The Author(s). This work is published and licensed by Dove Medical Press Limited. The
full terms of this license are available at https://www.dovepress.com/terms
and incorporate the Creative Commons Attribution
- Non Commercial (unported, 3.0) License.
By accessing the work you hereby accept the Terms. Non-commercial uses of the work are permitted
without any further permission from Dove Medical Press Limited, provided the work is properly
attributed. For permission for commercial use of this work, please see paragraphs 4.2 and 5 of our Terms.
© 2019 The Author(s). This work is published and licensed by Dove Medical Press Limited. The
full terms of this license are available at https://www.dovepress.com/terms
and incorporate the Creative Commons Attribution
- Non Commercial (unported, 3.0) License.
By accessing the work you hereby accept the Terms. Non-commercial uses of the work are permitted
without any further permission from Dove Medical Press Limited, provided the work is properly
attributed. For permission for commercial use of this work, please see paragraphs 4.2 and 5 of our Terms.