Back to Journals » Clinical Epidemiology » Volume 12
Co-Morbidity Patterns Identified Using Latent Class Analysis of Medications Predict All-Cause Mortality Independent of Other Known Risk Factors: The COPDGene® Study
Authors Li Y ![]() , Ragland M, Austin E, Young K
, Ragland M, Austin E, Young K ![]() , Pratte K, Hokanson JE, Beaty TH
, Pratte K, Hokanson JE, Beaty TH ![]() , Regan EA, Rennard SI, Wern C
, Regan EA, Rennard SI, Wern C ![]() , Jacobs MR, Tal-Singer R, Make BJ
, Jacobs MR, Tal-Singer R, Make BJ ![]() , Kinney GL
, Kinney GL
Received 3 September 2020
Accepted for publication 6 October 2020
Published 27 October 2020 Volume 2020:12 Pages 1171—1181
DOI https://doi.org/10.2147/CLEP.S279075
Checked for plagiarism Yes
Review by Single anonymous peer review
Peer reviewer comments 2
Editor who approved publication: Professor H Sorensen
Yisha Li,1 Margaret Ragland,1 Erin Austin,2 Kendra Young,1 Katherine Pratte,3 John E Hokanson,1 Terri H Beaty,4 Elizabeth A Regan,3 Stephen I Rennard,5 Christina Wern,6 Michael R Jacobs,7 Ruth Tal-Singer,8 Barry J Make,3 Gregory L Kinney1 On Behalf of theCOPDGene investigators
1Department of Epidemiology, Colorado School of Public Health, University of Colorado Anschutz Medical Campus, Aurora, CO, USA; 2Mathematical and Statistical Sciences, University of Colorado Denver, Denver, CO, USA; 3National Jewish Health, Denver, CO, USA; 4Bloomberg School of Public Health, University of John Hopkins, Baltimore, MD, USA; 5Department of Internal Medicine, University of Nebraska Medical Center, Omaha, NB, USA; 6Department of Clinical Pharmacy, Skaggs School of Pharmacy and Pharmaceutical Sciences, University of Colorado Anschutz Medical Campus, Aurora, Colorado, USA; 7School of Pharmacy, Temple University, PA, Pennsylvania, USA; 8COPD Foundation, Washington, D.C., USA
Correspondence: Gregory L Kinney
Department of Epidemiology, Colorado School of Public Health, University of Colorado Anschutz Medical Campus, Aurora, CO, USA
Tel +1 303-724-4437
Email [email protected]
Purpose: Medication patterns include all medications in an individual’s clinical profile. We aimed to identify chronic co-morbidity treatment patterns through medication use among COPDGene participants and determine whether these patterns were associated with mortality, acute exacerbations of chronic obstructive pulmonary disease (AECOPD) and quality of life.
Materials and Methods: Participants analyzed here completed Phase 1 (P1) and/or Phase 2 (P2) of COPDGene. Latent class analysis (LCA) was used to identify medication patterns and assign individuals into unobserved LCA classes. Mortality, AECOPD, and the St. George’s Respiratory Questionnaire (SGRQ) health status were compared in different LCA classes through survival analysis, logistic regression, and Kruskal–Wallis test, respectively.
Results: LCA identified 8 medication patterns from 32 classes of chronic comorbid medications. A total of 8110 out of 10,127 participants with complete covariate information were included. Survival analysis adjusted for covariates showed, compared to a low medication use class, mortality was highest in participants with hypertension+diabetes+statin+antiplatelet medication group. Participants in hypertension+SSRI+statin medication group had the highest odds of AECOPD and the highest SGRQ score at both P1 and P2.
Conclusion: Medication pattern can serve as a good indicator of an individual’s comorbidities profile and improves models predicting clinical outcomes.
Keywords: COPDGene, co-morbidities, latent class analysis, medication patterns, mortality
Introduction
Many diseases are related to smoking cigarettes and approximately 480,000 deaths annually in the US are attributed to smoking.1,2 In large observational cohort studies, comorbid conditions were often self-reported using question “has a physician ever told you that you have a certain disease?”. Some studies have augmented this assessment of co-morbidities by comparing self-reported medication use by the participant to comorbidities reported and defining a condition based on the combination of both.3 Other observational studies have combined self-reported comorbidities into a single score where self-reported results are summed into a score that represents the total burden of co-morbid conditions.4 However, this approach lacks nuance and relies on scoring based on a perception of severity or relatedness to the studies’ outcomes of interest making some scores less applicable in specific study settings.4 Comorbid conditions such as diabetes, obesity, and renal disease can be correlated which raises modeling concerns.
One aspect of co-morbidity that is not typically considered when statistically “controlling” for co-morbidities is the combination of medications. Prescribed medications may represent a more nuanced window into the structure of a patient’s co-morbid milieu because prescription medications represent the sum of clinicians’ observations regarding the patient. When clinicians build a treatment regimen, they balance therapeutic effects with quality of life, drug interactions, history of successful medication use, and other aspects of the clinical picture. This window into the clinical thought process suggests examining how medications cluster may be a fruitful approach that will allow us to gain an understanding of co-morbidities and adjust for it statistically.
A previous study used medication data to infer unreported comorbidities and found improved model fit in the co-morbidity-adjusted model, however, they did not use a statistical method to show how different medications were combined.5 Given the possibility that many medications are used simultaneously, it is necessary to use a statistical method to cluster the population into subgroups with similar medication combinations. We aggregated the individual medications reported by participants in the COPDGene study into therapeutic classes and employed latent class analysis (LCA) to cluster participants based on observed patterns of medication use. We chose LCA because it is a model-based approach that can identify homogeneous medication patterns within a heterogeneous population and assess the effect of multiple medication use simultaneously instead of assessing the impact of single medication separately.6 LCA is a well-established analytical method applied in research since 1995.7 Previous studies have utilized LCA to cluster multi-morbidity, however, no previous study has measured co-morbidity medication use in a cohort of individuals at high risk for COPD.8–13 After clustering medication pattern through LCA, we then assessed the risk for all-cause mortality, acute exacerbations of COPD (AECOPD), and quality of life adjusting for these clusters and assessed model performance.
Materials and Methods
All data were collected from the COPDGene cohort, a large cross-sectional study designed to investigate the underlying genetic factors about the chronic obstructive pulmonary disease (COPD), baseline initiation started in 2007. Participants from the COPDGene cohort who completed P1 or both P1 and P2 (each phase is 5 years apart) from 2007 through 2019 with complete demographics, clinical information, baseline medication records, COPD factors, and mortality status were included in the study. All participants were heavy smokers with >10 pack-years smoking. Mean and standard deviation (SD) were reported for baseline age, smoking duration, smoking pack-years, and BMI, frequencies and proportion were reported for sex, race, ethnicity, and smoking status. COPD was captured using five COPD factors, increasing scores in these factors represents increase of severity.14–16 These factors remain consistent and should not be impacted by different COPD severity definitions from 2007 through 2019.
Participants’ medications were collected through self-report and confirmed by bringing their bottles of medications prescribed by their physicians. Detailed information about medication classification was provided in Appendix 1. Medication classification was based on expert opinion, for instance, the American Diabetes Association was consulted for medication use to treat type I or type II diabetes (T2D).17,18 LCA was utilized to identify medication patterns among 200 medications in 32 classes of chronic disease drugs with the exception of those for COPD, asthma, cancers, and infections. Classification of antihypertension drugs used a list of oral antihypertensive drugs from the 2017 American Heart Association clinical practice guideline.19 Classification of diabetes drugs used the American Diabetes Association pharmacologic approach to glycemic in 2018.17,19 Similar approaches were used for the other classes of drugs. LCA patterns were then compared with the participants’ self-reported comorbidities. Mortality information was obtained at the end of the P2 follow-up, which was confirmed in October 2018. AECOPD information was obtained at both P1 and P2. AECOPD was defined as severe exacerbation of COPD in our study based on self-reported answers from respiratory epidemiology questionnaires modified from the ATS Chronic Respiratory Disease Questionnaire (ATS-DLD-78) 7.20 Exacerbation severity was determined by the location where the exacerbation was treated.20 Mild to moderate exacerbations could be managed at home or in the emergency room.20 Severe exacerbations need to be managed in the hospital.20
To measure the quality of life, the St. George’s Respiratory Questionnaire (SGRQ) was assessed at the P1 and P2 visits.21 A higher total SGRQ score correlates with a lower quality of life in an individual with a respiratory disease.21 Baseline age, sex, race, smoking status, smoking pack-years, COPD factors were included in the study as potential confounders. Gender and smoking status were tested for potential interactions in models predicting all-cause mortality, risk of AECOPD and total SGRQ score.
Statistical Analysis
All participants were asked their medication use information and were included in the medication LCA. LCA is a statistical method used to cluster a set of discrete, mutually exclusive latent classes of individuals based on their responses to a set of observed categorical variables.22 We performed LCA based on whether participants used a specific class of drugs. Model selection for LCA started with two classes and fitted with increasing numbers of classes. The best number of LCA classes was determined by comparing Akaike Information Criterion (AIC), Bayesian information criterion (BIC), sample size adjusted BIC (SABIC), entropy, and the overall interpretability of model.23,24 Lower values of AIC and BIC, SABIC, and higher values of entropy means a better model fit.22,25 After determining the optimal classes of LCA, everyone was classified into the class where they have the highest predicted probability of class membership, and the best class of membership for each individual was automatically selected through LCA. The characteristics of each LCA class were then determined by the observed item-response probabilities and labeled by names of dominated classes of medications. Item-response probabilities were considered high if the conditional probability was >0.7 and low if the conditional probability was <0.3, previous paper has used <0.4 as a low probability for this interpretation step, thus we used cut-point of <0.4 as a low probability, 0.4–0.7 as moderate probability, and above 0.7 as high probability.26,27 LCA patterns were confirmed with the participant’s self-reported comorbidities. Baseline characteristics were compared using Chi-square tests, one-way ANOVA and the Kruskal–Wallis test across LCA classes.
Survival analysis was conducted by Cox proportional hazard regression model adjusting LCA membership, COPD factors, gender, baseline age, race, smoking status and smoking pack-years to determine the association between identified patterns of medication use and mortality and reported with hazard ratios (HR) and 95% confidence interval (CI). Risk of AECOPD was also compared across different LCA classes fitting logistic regression models adjusting for potential confounders in P1 and P2 separately and reported with odds ratios (ORs) and 95% CI. Quality of life among different LCA classes was compared through the Kruskal–Wallis test using total SGRQ score in P1 and P2, respectively. Potential effect modifiers including gender*LCA and smoking status*LCA were tested in Cox proportional hazard model predicting all-cause mortality, logistic regression model predicting risk of AECOPD, and generalized linear model assessing SGRQ score in different LCA classes separately. We tested effect modifiers by entering them into each model and use a P-value<0.1 to continue to investigate the existence of an interaction. LCA medication patterns were compared with the participants’ self-reported comorbidities by frequency proportions. Correlations between covariates and variance inflation factor (VIF) was used to detect multicollinearity. Correlation between variables>0.8 and VIF>5 will be considered as multicollinearity.28,29 Finally, we performed a sensitivity analysis by adjusting the posterior probability of LCA instead of LCA membership in models predicting all-cause mortality and risk of AECOPD. All statistical analyses were performed through SAS Version 9.4, P-value<0.05 were considered statistically significant.
Results
COPDGene included 10,127 participants with complete baseline medication information. A total of 8110 participants had complete COPD characterization and mortality information, thus a total of 8110 out of 10,127 participants with complete baseline medications, gender, race, ethnicity, age at baseline, smoking pack-years, smoking duration, smoking status, and Global initiative for chronic Obstructive Lung Disease (GOLD) status was finally included in the LCA study cohort.30 COPD severity was assessed using 5 factors capturing different aspects of the disease.14–16 All 8110 participants completed P1 and 4763 out of these 8110 participants completed P2. Among the 8110 participants, average age at enrollment was 60 years, 46% were female, 69% were white, all participants were not Hispanic or Latino, 48% were former smokers, 52% were current smokers, average cigarette smoking pack-years is 44 pack-years and average smoking duration are 36 years, average BMI is 29, 44% participants had COPD and 12% participants were observed to have Preserved Ratio Impaired Spirometry (PRISm) at baseline (Table 1).31,32 Among the 8110 participants, there were 4874 participants who used at least one class of medication at baseline. Medication patterns among the 8110 will be further discussed below through the results of LCA characteristics.
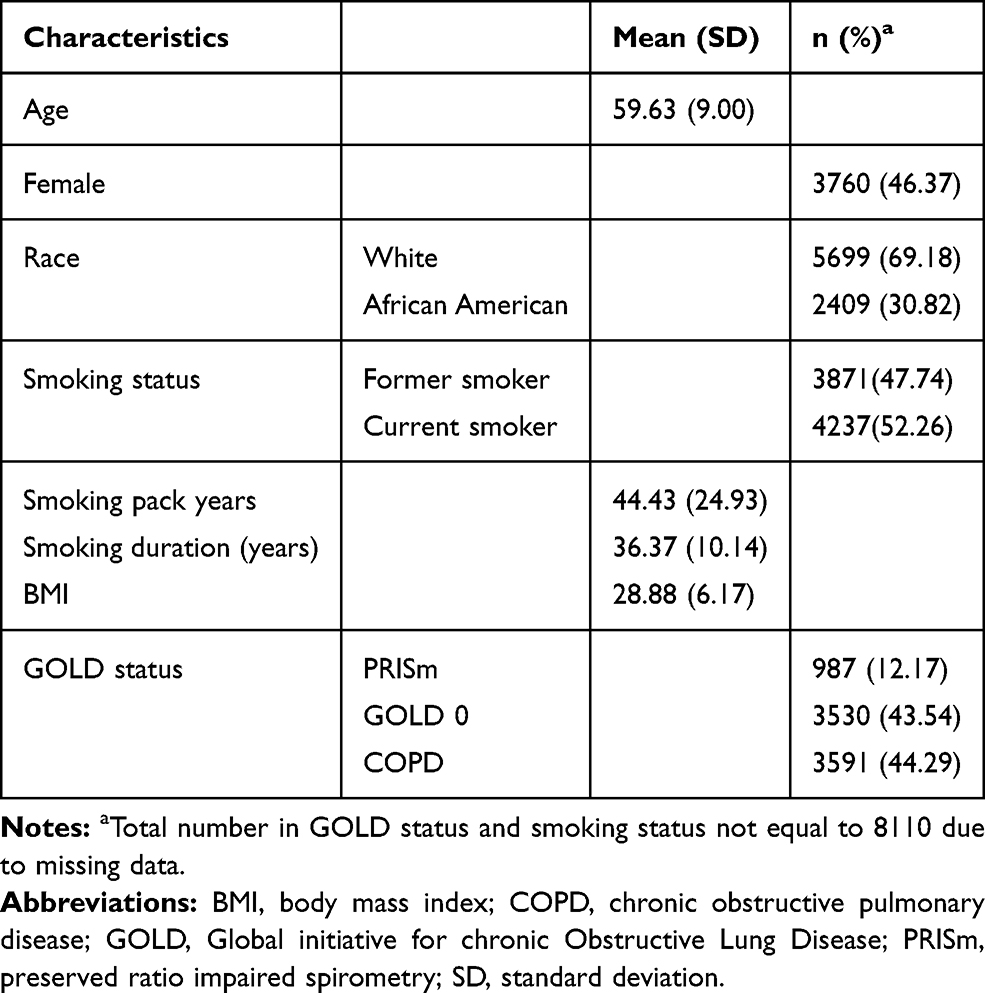 |
Table 1 Baseline Characteristics |
LCA Models were fit as shown in Table 2. After conducting LCA from 2 classes through 9 classes, the BIC selected 5 classes, SABIC selected 7 classes, AIC selected 9 classes. Although 8 classes had higher SABIC and BIC compared to those with 5 classes and 7 classes, and higher AIC compared to 9 classes, we finally selected the 8 classes model because it provided a stronger medication pattern and easier interpretation. The clustering of medications in each LCA is shown in Figure 1. Detailed item-response probability is shown in Appendix 2.
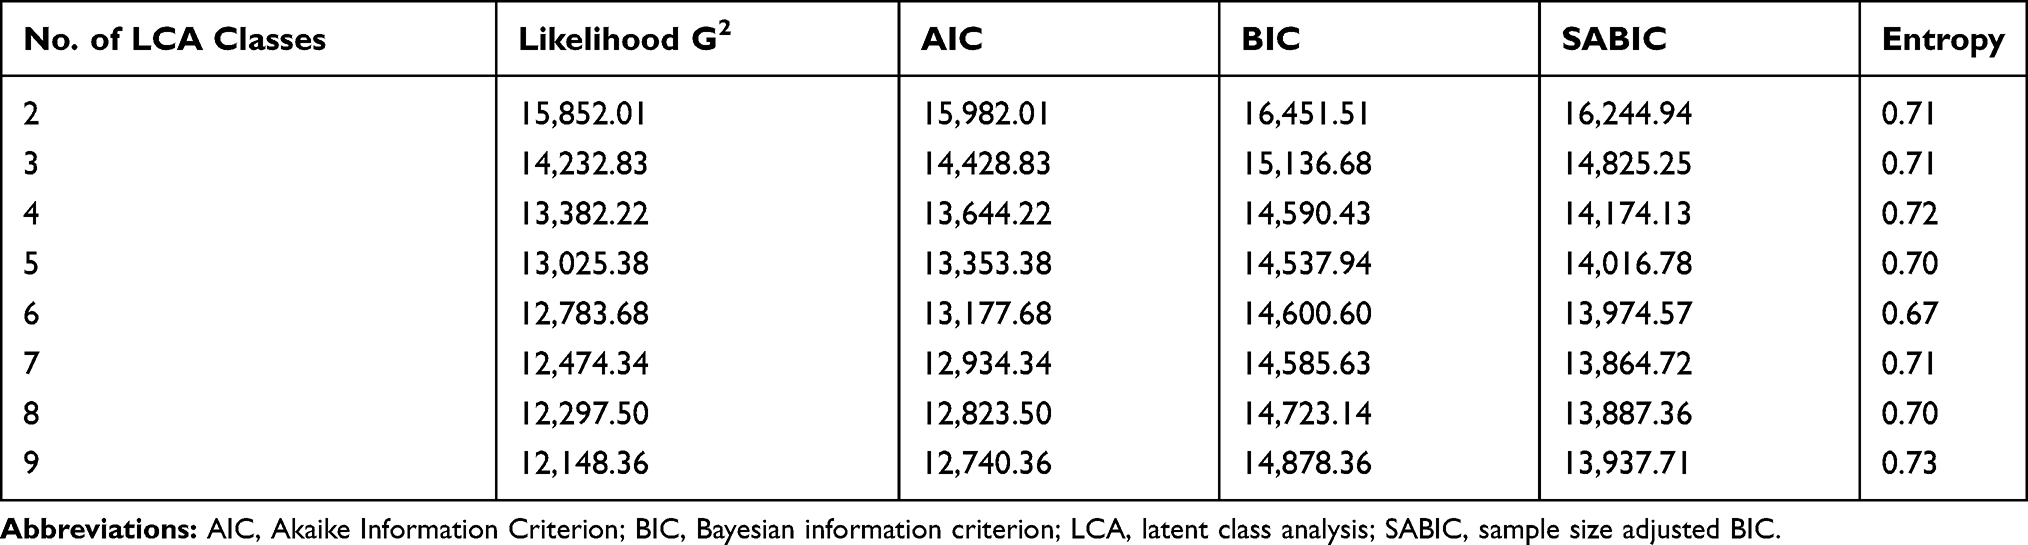 |
Table 2 Model Fit Comparisons in Different LCA Classes |
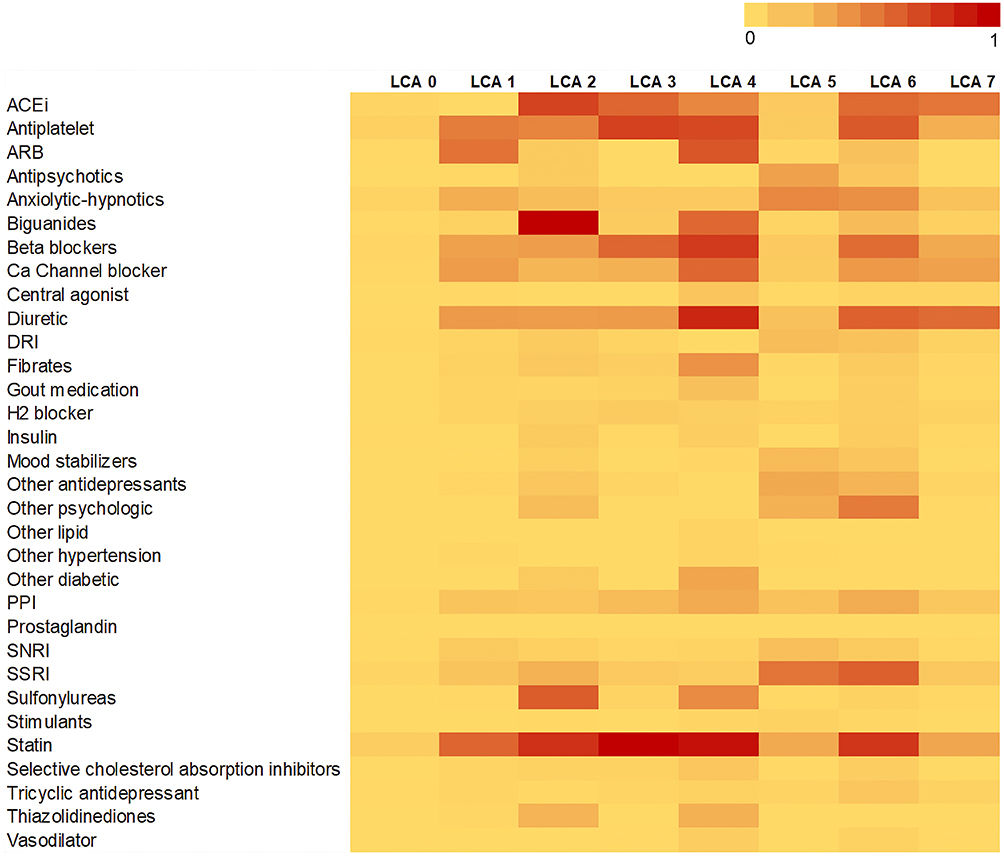 |
Figure 1 ACEi=Angiotensin-converting enzyme inhibitors, ARB=Angiotensin II receptor blockers, DRI= dopamine reuptake inhibitor, LCA=Latent class analysis, PPI=Proton pump inhibitor, SNRI= Serotonin and norepinephrine reuptake inhibitors, SSRI= Selective serotonin reuptake inhibitors. Membership in other classes were labeled in Appendix 1. LCA posterior probability of each class of medication was shown in Appendix 2. Appendix 5: SGRQ= St. George’s Respiratory Questionnaire, P1=Phase 1. |
Characteristics of LCA
LCA 0: included 4167 (51.38%) participants. LCA 0 had a very low probability of all medication use (probability of each medication <5%) and the medications used in this group did not share the same clustering with other LCA models. LCA 0 is labeled as (low-med).
LCA 1: included 506 (6.24%) participants. LCA 1 had moderate probability angiotensin II receptor blockers (ARB) use (41.23%), statin use (46.56%), and low probability of antiplatelet use (APT, 37.43%) and other medication use. LCA 1 is labeled as (ARB+statin).
LCA 2: included 293 (3.61%) participants. LCA 2 showed a high probability of biguanide use (87.00%), moderate probability of angiotensin-converting enzyme inhibitors (ACEi, 60.42%), statin (67.67%), sulfonylureas (49.77%) and low probability of antiplatelet use (34.21%). Biguanides and sulfonylureas are medications for T2D. LCA 2 was labeled as (ACEi+Statin+T2D).
LCA 3: included 798 (9.84%) participants. LCA 3 had a moderate probability of 46.38% ACEi, 61.09% APT, 46.17% beta-blocker, and a high probability of 86.64% statin use. ACEi and beta-blockers are both medications for hypertension (HTN). LCA 3 was labeled as (HTN+APT+Statin).
LCA 4: included 94 (1.16%) participants. LCA 4 had low probability of 32.93% ACEi, moderate probability of APT (58.31%), ARB (52.58%), biguanides (45.40%), beta-blocker (63.89%), calcium channel blocker (45.98%), high probability of diuretic use (71.87%) and statin (80.90%) use. LCA 4 was labeled as (HTN+T2D+statin+APT).
LCA 5: included 827 (10.20%) participants. LCA 5 had a moderate probability of selective serotonin reuptake inhibitors (SSRI) use (40.34%) and low probability of anxiolytic-hypnotics use (32.56%). LCA 5 was labeled as (SSRI only).
LCA 6: included 283 (3.29%) participants. LCA 6 had moderate probability of ACEi (44.67%), antiplatelet (51.71%), beta-blocker (43.71%), diuretic (48.26%), SSRI (48.54%), statin use (65.61%) and low probability of other psychiatric medications (37.83%). LCA 6 was labeled as (HTN+SSRI+statin+APT).
LCA 7: included 1142 (14.08%) participants. LCA 7 had a moderate probability of ACEi (39.75%, boundary value) and diuretic (44.25%). LCA 7 was labeled as (ACEi+diuretic).
Characteristics of LCA patterns were confirmed against the participants’ self-reported comorbidities (Appendix 3). Additionally, demographic characteristics were compared among LCA classes in Table 3. LCA 4 showed the highest average age of 67.30 years, a lower proportion of females of 23.40%, longer average smoking duration of 34.78 years, higher average BMI of 34.78, and a higher proportion of PRISm participants of 25.53%.
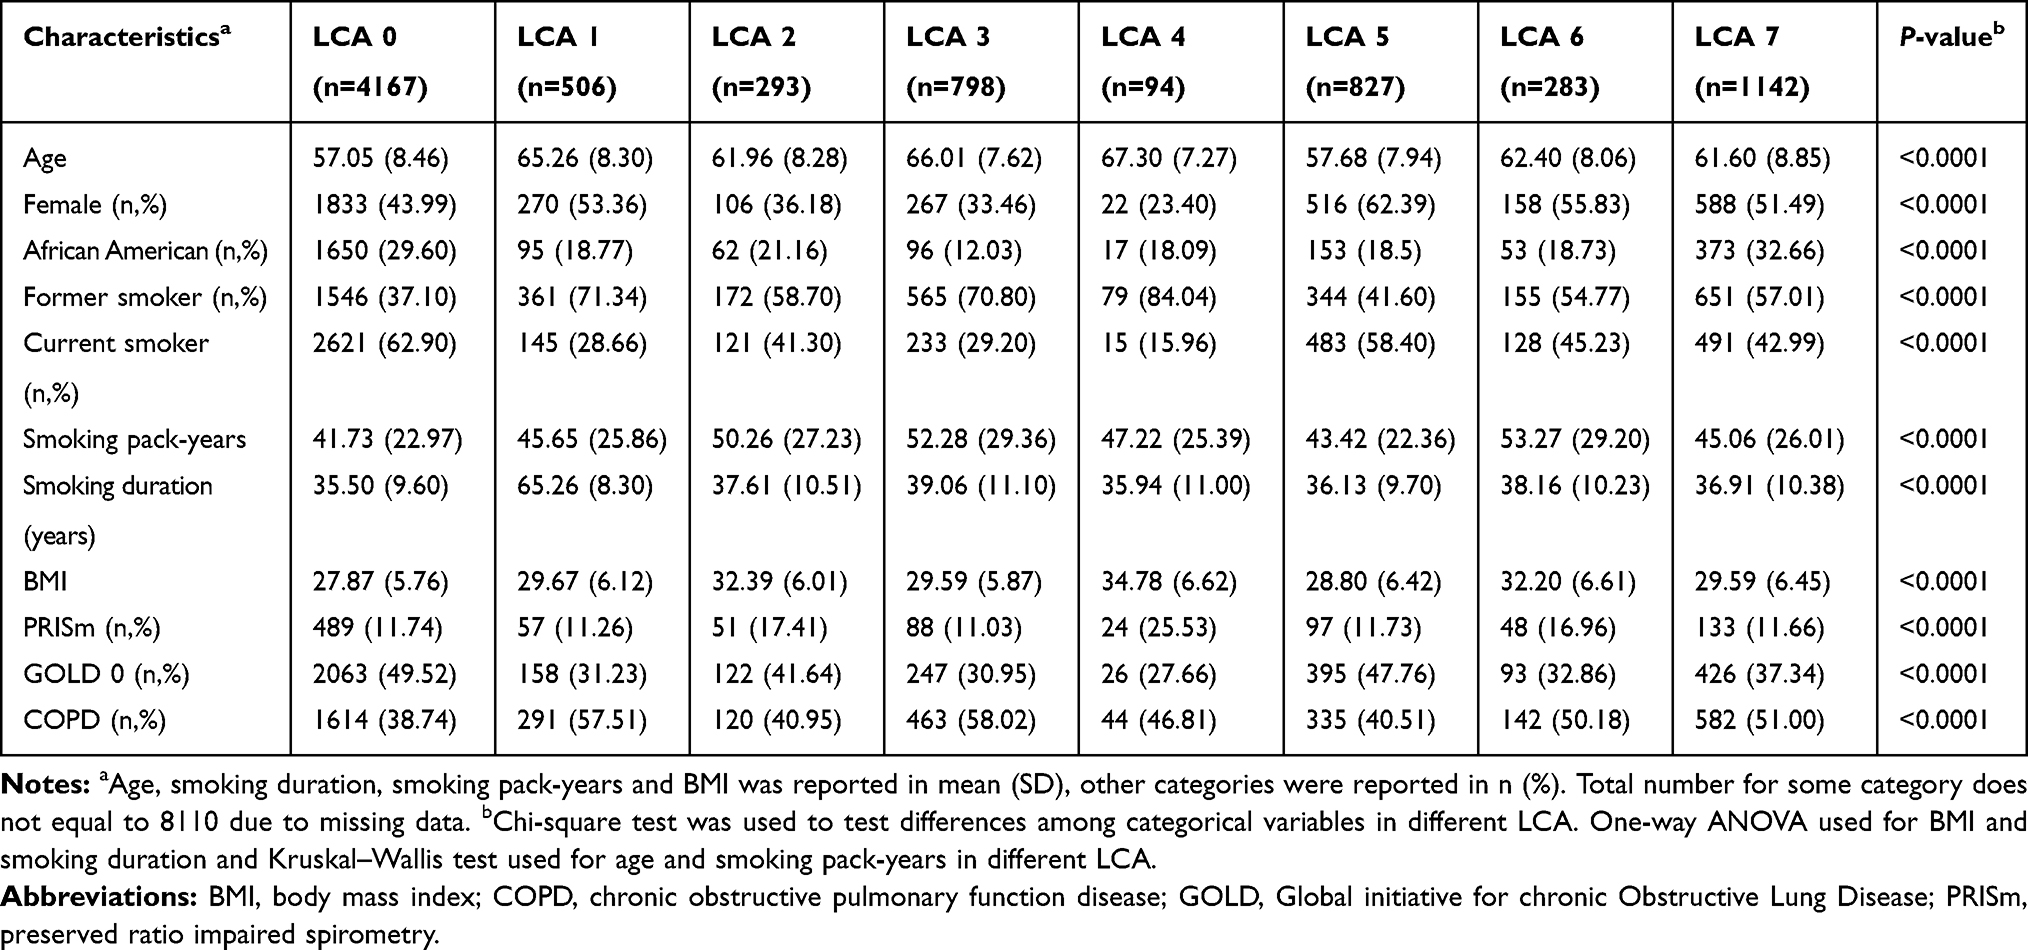 |
Table 3 Characteristics According to Latent Class Membership |
Model Fit Using LCA
LCA variable was significant in the survival model predicting all-cause mortality (P<0.0001). No evidence of interaction was found in this model. Survival analysis adjusting for COPD factors, gender, baseline age, race, smoking status, smoking duration, and smoking pack-years showed, compared to low-med pattern (LCA 0), adjusted mortality was statistically significant higher in HTN+T2D+statin+APT pattern (LCA 4, HR=1.66, 95% CI: 1.13, 2.43, Table 4), HTN+SSRI+statin+APT pattern (LCA 6, HR=1.55, 95% CI: 1.21, 1.99, Table 4) and SSRI only pattern (LCA 5, HR=1.27, 95% CI: 1.05, 1.54, Table 4).
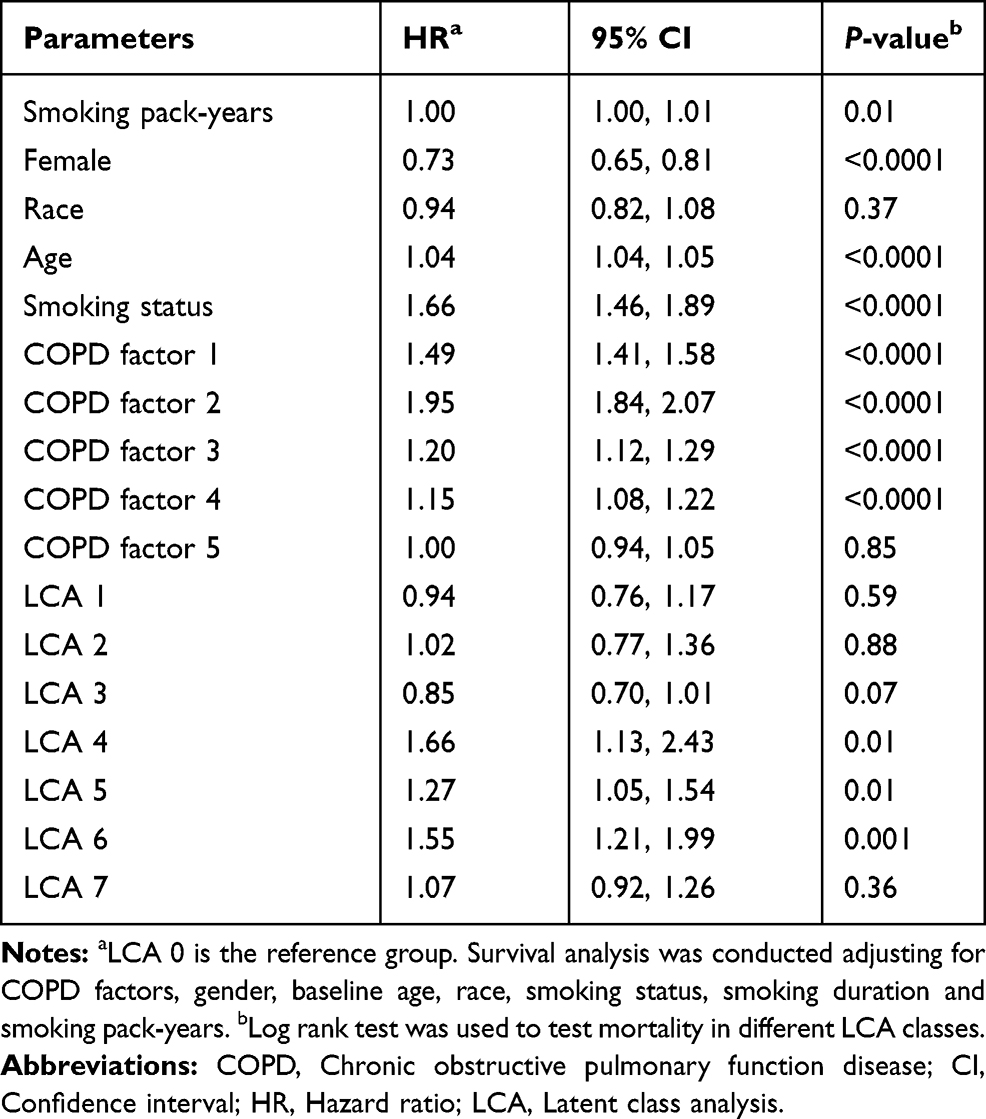 |
Table 4 Adjusted Survival Analysis in Different LCA Classes |
The LCA variable was statistically significant when included in the model predicting P1 and P2 AECOPD (P1: P<0.0001, P2: P=0.04). No evidence of interaction was found in the model predicting the risk of AECOPD. Compared to low-med (LCA 0), HTN+SSRI+Statin+APT pattern (LCA 6, P1: OR=2.22, 95% CI: 1.68, 2.94, P2: OR=1.81, 95% CI: 1.25, 2.62, Table 5) and SSRI only pattern (LCA 5, P1: OR=1.44, 95% CI: 1.19, 1.75, P2: OR=1.30, 95% CI: 1.01, 1.66, Table 5) had a significantly higher risk of AECOPD in both P1 and P2.
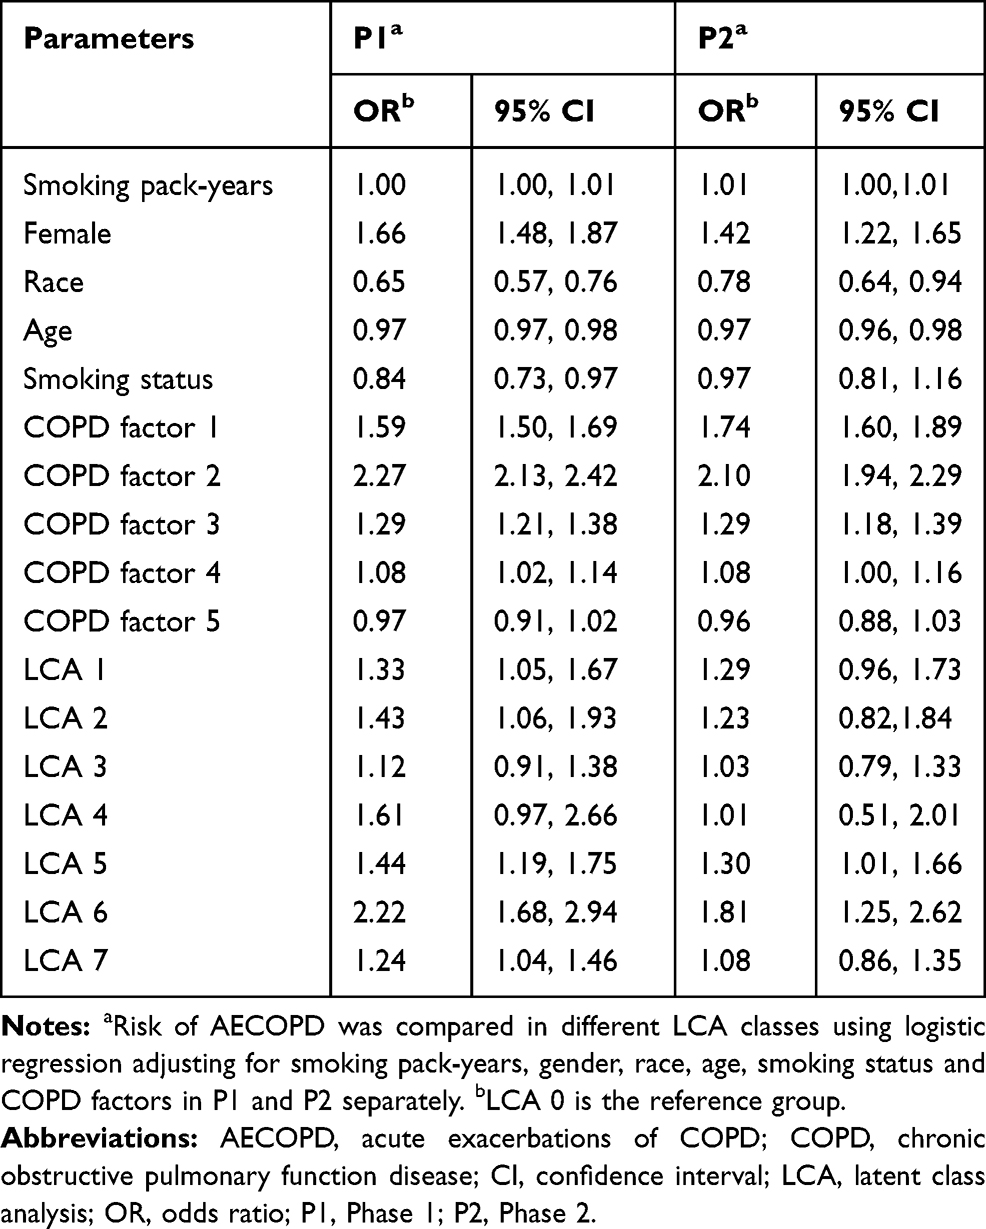 |
Table 5 Risk of AECOPD in P1 and P2 |
Total SGRQ score was assessed in 8110 participants who completed P1 and the 4763 participants who completed P2 separately. Compared to low-med class (LCA 0), the median total SGRQ scores were significantly higher in the rest LCA groups in P1. Participants with the medication pattern of HTN+SSRI+statin+APT (LCA 6) had the highest median total SGRQ score in both P1 and P2 (P1:38.30, P<0.0001, P2: 31.12, P<0.0001, Table 6). In P2, compared to the low-medication pattern (LCA 0), the median total SGRQ scores were also significantly higher in the other LCA patterns (Table 6). SGRQ total score in different LCA classes was stratified by smoking status in P1 (p=0.046). Current smokers had higher median SGRQ total score in all LCA classes compared to former smokers (Appendix 4, Appendix 5). Gender was not a significant interaction in the SGRQ model in P1 (P=0.41). Gender (P=0.90) and smoking status (P=0.18) were not significant interactions in the SGRQ model in P2.
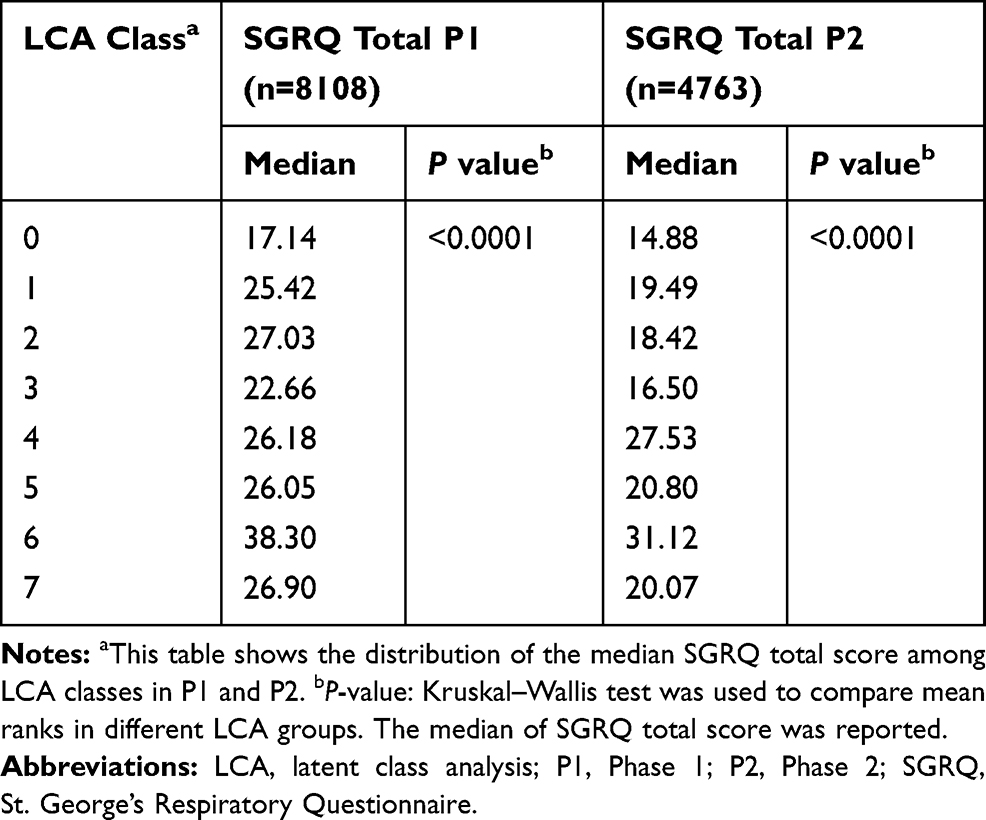 |
Table 6 Comparison of SGRQ Total Score in Different LCA Classes in P1 and P2 |
Multicollinearity was not an issue in any models as correlation between variables was <0.8 and all the VIFs, which indicate multicollinearity were <5. Sensitivity analysis was conducted adjusting the posterior probability of LCA in predicting mortality and the risk of AECOPD. Results were similar to models adjusted for LCA membership (Appendix 6, Appendix 7).
Discussion
This study applied LCA to cluster participants’ medication use patterns in the COPDGene cohort. Examining how medications cluster together may be an approach to provide a better understanding of co-morbidities as represented through medication use indicated total disease patterns. LCA identified 8 clusters of medication use patterns and there were significant differences in overall mortality, COPD exacerbations, and quality of life among different co-morbidity medication use patterns. LCA is a statistical method widely applied to assess substance use patterns.27,33 Woodman et al assessed 14 separate drug classes and identified 3 medication patterns with serum sodium concentrations in older hospitalized patients.34 To our knowledge, this is the first analysis that employees LCA to assess medication patterns in a cohort of heavy smokers at high risk for COPD. Furthermore, this approach of including a medication use pattern variable in an LCA model could be an innovative method adjusting the clustering of various comorbidities because medication use is a good indication of a patient’s overall clinical picture.
LCA 0 was labeled as low-med. In this class, 78.18% of people did not use any medications in the 32 classes assessed, 21.42% used a single medication, and 0.40% used two medications. The co-morbidity medications used in this LCA had lower probability when utilized as a single or combination of two medications, which was not captured by other clustering within this cohort, thus we termed it “low-med”. Compared to low-med (LCA 0), HTN+T2D+APT+Statin pattern (LCA 4) had the highest overall mortality rate, people using these medications could possibly be individuals with hypertension, diabetes, and hyperlipidemia. Correspondingly, 25% people in this group were in PRISm and 47% people in this group were diagnosed with COPD (Table 3). This was consistent with the previous data indicating that individuals with COPD had a high prevalence of hypertension, diabetes, and cardiovascular disease, and people with these comorbid diseases had higher mortality risk.35,36 To confirm the prediction of comorbidities, we compared the clustering of medications with possible chronic diseases through self-reported diagnosis information, and the trend of treatment patterns and potential disease patterns were matched (Appendix 3).
Both SSRI only pattern (LCA 5) and HTN+SSRI+statin+APT pattern (LCA 6) were associated with a higher risk of AECOPD, higher mortality, as well as lower quality of life scores. Since these two medication use patterns included SSRI, depression might play a critical influence on mortality, AECOPD, and quality of life.37,38 Depression was associated with a higher risk of AECOPD, mortality and lower quality of life in previous studies. Underner et al reported a positive association found between depression and risk of AECOPD after examining publications between 1980 and 2017.37 Lim et al found it was hard for people with depression to improve the quality of life in COPD patients.38 Plus, another study found that SSRI users compared to non-users had significantly higher rates of all-cause mortality (HR=1.20, 95% CI: 1.11,1.29).39
Our study had several limitations. First, medication use patterns were assessed through medication use at study enrollment and did not reflect alterations of medications during the follow-up period. However, this analysis provides a clear clinical picture combining all aspects of patients’ co-morbidity patterns. Future work will include a reassessment of patient’s medication changes during P2 and could allow us to assess how changes in medication use through latent transition analysis over the intervening period. Also, COPD factors in P2 were not available, so changed of COPD severity would not be assessed. This will be addressed in future work. Second, we assessed participants’ medications through interviews with confirmation by the subject’s bringing all current medication bottles, however, we did not have access to information to validate whether people are truly taking these medications. Given the importance of our findings, this may lead to future analysis incorporating adherence information. Third, only 8110 participants had complete information on COPD factors and mortality to assess the relationship between medication use patterns and mortality, AECOPD, and quality of life. However, comparing those subjects with complete information to those excluded due to missing information in COPD factors or baseline characteristics did not show large differences (Appendix 8). Fourth, medication use patterns could be another approach to adjust for comorbidities, however, we are not able to directly translate the medication use into firm comorbidities patterns because different diseases are treated with similar drugs. For example, ACEi or ARB reduces the risk for both kidney failure and cardiovascular events.40 Besides, LCA predicts medication use pattern but does not necessarily represent every single participant’s medications within each LCA membership, detailed numbers of medication use patterns for each LCA membership is shown in Appendix 9. In addition, glycated hemoglobin provides average blood sugar information for participants, however blood measurement of glycemic control was not available at baseline in our dataset.41 Fifth, assessing medication use patterns using LCA is a complex statistical approach compared to direct co-morbidity counts recalled by participants, however, co-morbidity counts suffer from recall bias and do not indicate co-morbidity patterns. Furthermore, medication assessment is less likely to have recall bias and provide polypharmacy information to implicate the cluster of comorbidities. Therefore, adjusting for medication use is an alternative approach to adjust for comorbidities when co-morbidity information is absent or of poor quality. Sixth, we were not able to adjust for severity of comorbidities because we do not have clinical information such as doses, timing or frequencies of medication use, future studies including dose or frequency variables could consider addressing this issue. Lastly, SGRQ was not a validated measurement for the quality of life in a non-COPD cohort but has been used to measure quality of life in heavy smokers in a previous study.42
Our study also had several strengths. We identified 8 clear co-morbidity medication use patterns in a cohort of heavy smokers at high-risk of COPD and these medication use patterns were matched with potential disease patterns. Using LCA allows us to assess the effect of total medication use rather than isolated drugs. We also adjusted for confounders and tested potential effect modifiers that might influence the association of medication use patterns with mortality and AECOPD.
Conclusions
Our study is the first to assess co-morbidity medication use patterns using LCA in a population of smokers with and without COPD and to test the association between co-morbidity medication use patterns with mortality, AECOPD, and quality of life. We believe that adjusting for medication use patterns is an alternative method to adjust for co-morbidities when co-morbidity information is absent, overly complex or of poor quality.
Abbreviations
ACEi, angiotensin-converting enzyme inhibitors; ARB, angiotensin II receptor blockers; AECOPD, acute exacerbation of COPD; AIC, Akaike Information Criterion; APT, antiplatelet; BIC, Bayesian information criterion; COPD, chronic obstructive pulmonary disease; COPDGene, Genetic Epidemiology of Chronic Obstructive Pulmonary Disease; CI, confidence interval; GOLD, Global initiative for chronic Obstructive Lung Disease; HR, hazard ratio; HTN, hypertension; LCA, latent class analysis; OR, odds ratio; P1, Phase 1; P2, Phase 2; PRISm, preserved ratio impaired spirometry; SD, standard deviation; SGRQ, St. George’s Respiratory Questionnaire; SSRI, selective serotonin reuptake inhibitors; SABIC, sample size adjusted BIC; T2D, type II diabetes; VIF, variance inflation factor.
Data Sharing Statement
Data supporting this manuscript is available to all COPDGene investigators. Data are available upon request through https://dccweb.njhealth.org/sec/COPDGene/MainPage.cfm.
Ethics Approval and Consent Form
All study participants were informed about the purpose of the study. Confirmation of consent forms were received from study participants. Protocols for all phases (HS-2778) and data evaluation in the COPDGene cohort followed the principles of the Declaration of Helsinki and was approved by the COPDGene committee.
Consent for Publication
We confirmed that details of words, tables, figures included in the manuscript can be published.
Acknowledgment
We thank COPDGene investigators who helped acquiring the data for this study. We thank COPD foundation for their support. We thank the Colorado School of Public Health Laboratory for Analytical and Computational Epidemiology (LACE) for their support. Special thanks to Annika Czizik, Nicole E. Reed, and Chandler Zachary from LACE to help support this project.
Author Contributions
All authors made substantial contributions to conception and design, acquisition of data, or analysis and interpretation of data; took part in drafting the article or revising it critically for important intellectual content; agreed to submit to the current journal; gave final approval of the version to be published; and agree to be accountable for all aspects of the work.
Funding
The study was supported by Award Number U01 HL089897 and Award Number U01 HL089856 from the National Heart, Lung, and Blood Institute.
Disclosure
COPDGene is also supported by the COPD Foundation through contributions made to an Industry Advisory Board comprised of AstraZeneca, Boehringer-Ingelheim, Genentech, GlaxoSmithKline, Novartis, Pfizer, Siemens, and Sunovion.
Kendra Young reports grants from NIH, during the conduct of the study.
Terri H Beaty reports grants from NIHBI, during the conduct of the study.
Elizabeth A Regan reports grants from National Heart Lung and Blood Institute, during the conduct of the study.
Stephen I Rennard reports salary and shareholder from AstraZeneca, personal fees from GlaxoSmithKline, nothing from BerGenBio, nothing from Verona Pharma, outside the submitted work.,
Ruth Tal-Singer is a former employee and current shareholder of GSK, reports personal fees form Immunomet, Vocalis Health, and ENA Pharmaceuticals, and consultancy for Ena respiratory and Vocalis, outside the submitted work.
Barry J Make reports funding from the NHLBI, grants and medical advisory board work from Boehringer Ingelheim, GlaxoSmithKline, AstraZeneca and Sunovion, personal fees from Spiration, Shire, Circassia, CME personal fees from WebMD, National Jewish Health, American College of Chest Physicians, Projects in Knowledge, Hybrid Communications, Ultimate Medical Academy, Catamount Medical, Eastern Pulmonary Society, Medscape, Eastern VA Medical Center, Academy Continued Healthcare Learning, Mt. Sinai Medical Center, Theravance, Third Pole, Novartis, Phillips, Science 24/7, Wolter Kluwer Health and Verona, grants from Pearl, during the conduct of the study.
The authors report no other potential conflicts of interest for this work.
References
1. U.S. Department of Health and Human Services. The Health Consequences of Smoking—50 Years of Progress. A Report of the Surgeon General. Atlanta: U.S. Department of Health and Human Services, Centers for Disease Control and Prevention, National Center for Chronic Disease Prevention and Health Promotion, Office on Smoking and Health; 2014.
2. Centers for Disease Control and Prevention. QuickStats: number of deaths from 10 leading causes—national vital statistics system, United States, 2010. Morbid Mortal Wkly Rep. 2013;62(08):155.
3. Kinney GL, Baker EH, Klein OL, et al. Pulmonary predictors of incident diabetes in smokers. Chronic Obstr Pulm Dis. 2016;3(4):739–747. doi:10.15326/jcopdf.3.4.2016.0137
4. Putcha N, Puhan MA, Drummond MB, et al. A simplified score to quantify comorbidity in COPD. PLoS One. 2014;9(12):e114438. doi:10.1371/journal.pone.0114438
5. Bang JH, Hwang SH, Lee EJ, Kim Y. The predictability of claim-data-based comorbidity-adjusted models could be improved by using medication data. BMC Med Inform Decis Mak. 2013;13:128. doi:10.1186/1472-6947-13-128
6. Hagenaars MA. Applied Latent Class Analysis. Cambridge University Press: New York; 2009.
7. Pickles A, Bolton P, Macdonald H, et al. Latent-class analysis of recurrence risks for complex phenotypes with selection and measurement error: a twin and family history study of autism. Am J Hum Genet. 1995;57(3):717–726.
8. Islam MM, Valderas JM, Yen L, Dawda P, Jowsey T, McRae IS. Multimorbidity and comorbidity of chronic diseases among the senior Australians: prevalence and patterns. PLoS One. 2014;9(1):e83783. doi:10.1371/journal.pone.0083783
9. Schüz B, Wurm S, Warner LM, Tesch-Römer C. Health and subjective well-being in later adulthood: different health states—different needs? Appl Psychol Health Well Being. 2009;1(1):23–45. doi:10.1111/j.1745-7254.2007.00657.x-i1
10. Pugh MJ, Finley EP, Copeland LA, et al. Complex comorbidity clusters in OEF/ OIF veterans: the polytrauma clinical triad and beyond. Med Care. 2014;52(2):172–181. doi:10.1097/mlr.0000000000000059
11. Kuwornu JP, Lix LM, Shooshtari S. Multimorbidity disease clusters in Aboriginal and non-Aboriginal Caucasian populations in Canada. Chronic Dis Inj Can. 2014;34(4):218–225.
12. Swartz JA. Chronic medical conditions among jail detainees in residential psychiatric treatment: a latent class analysis. J Urban Health. 2011;88(4):700–717. doi:10.1007/s11524-011-9554-9
13. Larsen FB, Pedersen MH, Friis K, Glümer C, Lasgaard M. A latent class analysis of multimorbidity and the relationship to socio-demographic factors and health-related quality of life. A national population-based study of 162,283 Danish adults. PLoS One. 2017;12(1):e0169426. doi:10.1371/journal.pone.0169426
14. Kinney GL, Santorico SA, Young KA, et al. Identification of chronic obstructive pulmonary disease axes that predict all-cause mortality: the COPDGene study. Am J Epidemiol. 2018;187(10):2109–2116. doi:10.1093/aje/kwy087
15. Young KA, Regan EA, Han MK, et al. Subtypes of COPD have unique distributions and differential risk of mortality. Chronic Obstr Pulm Dis. 2019;6(5):400–413. doi:10.15326/jcopdf.6.5.2019.0150
16. Young KA, Strand M, Ragland MF, et al. Pulmonary subtypes exhibit differential global initiative for chronic obstructive lung disease spirometry stage progression: the COPDGene® study. Chronic Obstr Pulm Dis. 2019;6(5):414–429. doi:10.15326/jcopdf.6.5.2019.0155
17. American Diabetes Association. 8. Pharmacologic approaches to glycemic treatment: standards of medical care in diabetes-2018. Diabetes Care. 2018;41(Suppl 1):S73–s85. doi:10.2337/dc18-S008.
18. American Diabetes Association. 2. Classification and diagnosis of diabetes: standards of medical care in diabetes-2019. Diabetes Care. 2019;42(Suppl 1):S13–s28. doi:10.2337/dc19-S002.
19. Whelton PK, Carey RM, Aronow WS, et al. 2017 ACC/AHA/AAPA/ABC/ACPM/AGS/APhA/ASH/ASPC/NMA/PCNA Guideline for the prevention, detection, evaluation, and management of high blood pressure in adults: a report of the American College of Cardiology/American Heart Association Task Force on Clinical Practice Guidelines. Hypertension. 2018;71(6):e13–e115.
20. Wells JM, Washko GR, Han MK, et al. Pulmonary arterial enlargement and acute exacerbations of COPD. N Engl J Med. 2012;367(10):913–921. doi:10.1056/NEJMoa1203830
21. Jones PW, Quirk FH, Baveystock CM, Littlejohns P. A self-complete measure of health status for chronic airflow limitation. The St. George’s respiratory questionnaire. Am Rev Respir Dis. 1992;145(6):1321–1327. doi:10.1164/ajrccm/145.6.1321
22. Lanza ST, Collins LM, Lemmon DR, Schafer JL. PROC LCA: a SAS procedure for latent class analysis. Struct Equ Modeling. 2007;14(4):671–694. doi:10.1080/10705510701575602
23. Lo Y, Mendell N, Rubin D. Testing the number of components in a normal mixture. Biometrika. 2001;88(3):767–778. doi:10.1093/biomet/88.3.767
24. Masyn KE. Latent class analysis and finite mixture modeling. In: Little TD, editor. The Oxford Handbook of Quantitative Methods in Psychology. New York: Oxford University Press; 2013:551–611.
25. Celeux G, Soromenho G. An entropy criterion for assessing the number of clusters in a mixture model. J Classif. 1996;13(2):195–212. doi:10.1007/BF01246098
26. Linda M, Collins STL. Latent Class and Latent Transition Analysis with Applications in the Social, Behavioral, and Health Sciences. Hoboken, NJ: John Wiley & Sons, Inc; 2010.
27. Liu Y, Elliott AL, Serdarevic M, Leeman RF, Cottler LB. A latent class analysis of the past-30-day substance use patterns among lifetime cocaine users: findings from a community sample in North Central Florida. Addict Behav Rep. 2019;9:100170. doi:10.1016/j.abrep.2019.100170
28. Vatcheva KP, Lee M, McCormick JB, Rahbar MH. Multicollinearity in regression analyses conducted in epidemiologic studies. Epidemiology (Sunnyvale). 2016;6(2). doi:10.4172/2161-1165.1000227
29. Yoo W, Mayberry R, Bae S, Singh K, Peter HQ, Lillard JW. A study of effects of multicollinearity in the multivariable analysis. Int J Appl Sci Technol. 2014;4(5):9–19.
30. Pauwels RA, Buist AS, Ma P, Jenkins CR, Hurd SS. Global strategy for the diagnosis, management, and prevention of chronic obstructive pulmonary disease: national heart, lung, and blood institute and World Health Organization global initiative for Chronic Obstructive Lung Disease (GOLD): executive summary. Respir Care. 2001;46(8):798–825.
31. Wan ES, Hokanson JE, Murphy JR, et al. Clinical and radiographic predictors of GOLD-unclassified smokers in the COPDGene study. Am J Respir Crit Care Med. 2011;184(1):57–63. doi:10.1164/rccm.201101-0021OC
32. Wan ES, Castaldi PJ, Cho MH, et al. Epidemiology, genetics, and subtyping of preserved ratio impaired spirometry (PRISm) in COPDGene. Respir Res. 2014;15(1):89. doi:10.1186/s12931-014-0089-y
33. Reynolds GL, Fisher DG. A latent class analysis of alcohol and drug use immediately before or during sex among women. Am J Drug Alcohol Abuse. 2019;45(2):179–188. doi:10.1080/00952990.2018.1528266
34. Woodman RJ, Wood KM, Kunnel A, et al. Patterns of drug use and serum sodium concentrations in older hospitalized patients: a latent class analysis approach. Drugs Real World Outcomes. 2016;3(4):383–391. doi:10.1007/s40801-016-0094-1
35. Mannino DM, Thorn D, Swensen A, Holguin F. Prevalence and outcomes of diabetes, hypertension and cardiovascular disease in COPD. Eur Respir J. 2008;32(4):962–969. doi:10.1183/09031936.00012408
36. André S, Conde B, Fragoso E, Boléo-Tomé JP, Areias V, Cardoso J. COPD and cardiovascular disease. Pulmonology. 2019;25(3):168–176. doi:10.1016/j.pulmoe.2018.09.006
37. Underner M, Cuvelier A, Peiffer G, Perriot J, Jaafari N. [The influence of anxiety and depression on COPD exacerbations]. Rev Mal Respir. 2018;35(6):604–625. French. doi:10.1016/j.rmr.2018.04.004
38. Lim JU, Park CK, Kim TH, et al. The difficulty of improving quality of life in COPD patients with depression and associated factors. Int J Chron Obstruct Pulmon Dis. 2019;14:2331–2341. doi:10.2147/copd.S216746
39. Vozoris NT, Wang X, Austin PC, et al. Serotonergic antidepressant use and morbidity and mortality among older adults with COPD. Eur Respir J. 2018;52(1):1800475. doi:10.1183/13993003.00475-2018
40. Xie X, Liu Y, Perkovic V, et al. Renin-angiotensin system inhibitors and kidney and cardiovascular outcomes in patients with CKD: a Bayesian Network meta-analysis of randomized clinical trials. Am J Kidney Dis. 2016;67(5):728–741. doi:10.1053/j.ajkd.2015.10.011
41. WHO Guidelines Approved by the Guidelines Review Committee. Use of Glycated Haemoglobin (Hba1c) in the Diagnosis of Diabetes Mellitus: Abbreviated Report of a WHO Consultation. Geneva: World Health Organization Copyright © World Health Organization; 2011.
42. Paulin LM, Gassett AJ, Alexis NE, et al. Association of long-term ambient ozone exposure with respiratory morbidity in smokers. JAMA Intern Med. 2019. doi:10.1001/jamainternmed.2019.5498
 © 2020 The Author(s). This work is published and licensed by Dove Medical Press Limited. The
full terms of this license are available at https://www.dovepress.com/terms
and incorporate the Creative Commons Attribution
- Non Commercial (unported, 3.0) License.
By accessing the work you hereby accept the Terms. Non-commercial uses of the work are permitted
without any further permission from Dove Medical Press Limited, provided the work is properly
attributed. For permission for commercial use of this work, please see paragraphs 4.2 and 5 of our Terms.
© 2020 The Author(s). This work is published and licensed by Dove Medical Press Limited. The
full terms of this license are available at https://www.dovepress.com/terms
and incorporate the Creative Commons Attribution
- Non Commercial (unported, 3.0) License.
By accessing the work you hereby accept the Terms. Non-commercial uses of the work are permitted
without any further permission from Dove Medical Press Limited, provided the work is properly
attributed. For permission for commercial use of this work, please see paragraphs 4.2 and 5 of our Terms.