
Back to Journals » Clinical Ophthalmology » Volume 19
Clinicodemographic Profile of Visual Disability Among Applicants for Disability Certification in South India
Authors Venkataraghavan N, Nayak RR, Mendonca TM  , Kiran A, Padenkilmar Devendra S, Kamath AR, Kamath G, Rodrigues G
Received 10 September 2024
Accepted for publication 28 December 2024
Published 21 February 2025 Volume 2025:19 Pages 641—651
DOI https://doi.org/10.2147/OPTH.S489309
Checked for plagiarism Yes
Review by Single anonymous peer review
Peer reviewer comments 2
Editor who approved publication: Dr Scott Fraser
Nivedha Venkataraghavan,1 Rajesh R Nayak,1 Teena Mariet Mendonca,1 Anitha Kiran,2 Soumya Padenkilmar Devendra,2 Ajay R Kamath,1 Gurudutt Kamath,1 Gladys Rodrigues1
1Department of Ophthalmology, Kasturba Medical College, Mangalore, Manipal Academy of Higher Education, Manipal, India; 2Senior Specialist, Department of Ophthalmology, Government Wenlock Hospital, Mangalore, India
Correspondence: Teena Mariet Mendonca, Department of Ophthalmology, Kasturba Medical College, Mangalore, Manipal Academy of Higher Education, Manipal, India, Tel +91 9461495479, Email [email protected]; [email protected]
Purpose: To study the causes of visual disability and clinico-demographic factors among applicants for disability certification in a tertiary care hospital in Karnataka.
Methods: A prospective, cross‑sectional study analyzing the applications of 194 people who applied for disability certificates between May 2022 and September 2023 at a tertiary care hospital in Karnataka. The causes of visual impairment/blindness, percentage of disability, and respective sociodemographic factors, such as age and sex, were analyzed. The analysis was performed following the visual impairment (VI) disability categories and percentages proposed by the Government of India.
Results: A total of 194 applications for disability certificates were analyzed, of which 60.8% (118) were males and 39.2% (76) were females. Most of the applications were from the 35– 60 years age group (41.2%), followed by the 18 (26.8%), 60+ (17.5%), and 18– 35 years age groups (14.4%). When the specific diagnostic causes of visual impairment and blindness were analyzed, the leading cause was retinitis pigmentosa (18.5%), followed by optic atrophy (11.8%), corneal opacities (9.79%), and pathological myopia (6.7%). Almost one-third of the cases (28.9%) were found to have been preventable causes of VI/blindness. Among these patients, most avoidable cases were under 18 years of age (40.4%). More than half of the applicants were categorized as blind (59.3%), followed by 21.1% with moderate VI, 13.4% with mild VI, and 6.2% with severe VI.
Conclusion: This study highlights various causes and associated demographic factors of visual impairment and blindness among applicants for disability certificates. Analysis of the applications for visual disability certification proves useful in obtaining data on the burden of visual impairment on the healthcare system. Although the specific findings are more local in scope, these data provide insight into changing trends in eye disease and can be used to better plan and implement local- and national-level intervention strategies.
Keywords: visual disability, visual impairment, avoidable blindness, disability certification
Introduction
The International Classification of Diseases-11 defines visual impairment as presenting the best corrected visual acuity in the better-seeing eye worse than 6/12 or 20/40. 1 Out of 253 million visually impaired people worldwide, up to 90% of this burden is seen in developing countries, such as India.2 Of the 36 million people who are blind globally, 80% of such cases are due to avoidable causes.2 Efforts to combat this barrier to eye health have been taking place for decades at both the global and national levels. For example, the World Health Assembly’s Global Action Plan (WHA GAP) aimed to reduce the prevalence of avoidable causes of visual impairment by 25% from 2010--20193. India was the first country in the world to launch a national program for the control of blindness, which has been instrumental in reducing the prevalence of blindness in the country. Encouragingly, the WHA GAP measure of a 25% reduction in prevalence has been achieved in India4 but has not been achieved globally.5 However, visual impairment and blindness continue to be major public health concerns in the country.6
As science and technology continue to evolve and lifespans continue to be extended, there has been an identified need in healthcare to pay attention to noncommunicable diseases, such as age- and lifestyle-related diseases, with an emphasis on promotional and prevention-based approaches. This can be similarly extrapolated to eye health and visual impairment, with changing risk factors and lifestyles contributing to changing epidemiological trends.7 For example, in Southeast Asia, there has been great success in the control of trachoma, a communicable disease.7 On the other hand, there is an increasing prevalence of diseases such as myopia, which is thought to be linked to increased time spent in classrooms, and diabetic retinopathy, a lifestyle-related disease.7 Notably, the prevalence of visual impairment and blindness varies across geographical regions, with different sociodemographic factors contributing to the same prevalence. Given this variation in prevalence across the country, there is a need for evidence-based local data to effectively plan, implement, monitor, and evaluate community-based interventions in a particular region.
According to guidelines by the Ministry of Social Justice and Empowerment of the Government of India, the minimum degree of disability should be 40% for an individual to be eligible for any concessions or benefits.8 This is a completely voluntary process, and obtaining this certification allows a visually disabled person to access various social services and benefits (such as employment, education, travel concessions, and tax benefits). However, even if this certification is not obtained by the individual, analysis of the applications for visual disability certification is useful for obtaining data on the burden of visual impairment on the healthcare system and the various causes and factors associated with visual impairment and blindness in the region.9 Hence, we aimed to analyze the causes of visual disability in applicants for disability certification and the associated demographic factors in a tertiary care hospital in Karnataka.
Materials and Methods
A prospective, cross‑sectional study was conducted by analysis of the applications of 194 people who applied for disability certificates was performed at Government Wenlock Hospital, Mangalore, Karnataka. The study was carried out in accordance with the guidelines of the Declaration of Helsinki and subsequent revisions. The authorization of the Institutional Ethics Committee of Kasturba Medical College Mangalore, India was obtained. (Name of the Ethics Committee: Kasturba Medical College, Mangalore IEC No: IEC KMC MLR 04–2022/120).
Informed consent was obtained from all the study participants. The government of India guidelines were followed for disability/blindness certification.8 The criterion for selection was all the applicants for disability certification in the ophthalmology department during the study period. Records with less than 50% incomplete information were excluded. The sample size calculated was 288 participants, with the formula n=z2pq/d2, where z= 1.96 at 95% Cl, p=75%;9 q=1‒p=25%; and d= degree of accuracy=5%. We analyzed all applications for visual disability certification between May 2022 and September 2023 to determine the causes of visual impairment/blindness, percentage of disability, and respective sociodemographic factors, such as age and occupation, after excluding incomplete/correctable causes of VI.
The same analysis was performed following the visual impairment (VI) disability categories and percentage disability calculation per the proposed guidelines of the Government of India9 (Table 1). The data were analyzed via IBM SPSS version 25. Continuous and categorical data are presented as the means and percentages, respectively. Comparisons of continuous variables against different categorical variables were performed via ANOVA followed by Tukey’s post hoc analysis. The associations between categorical variables were evaluated via chi-square analysis. A p value of ≤0.05 was considered significant for all analyses.
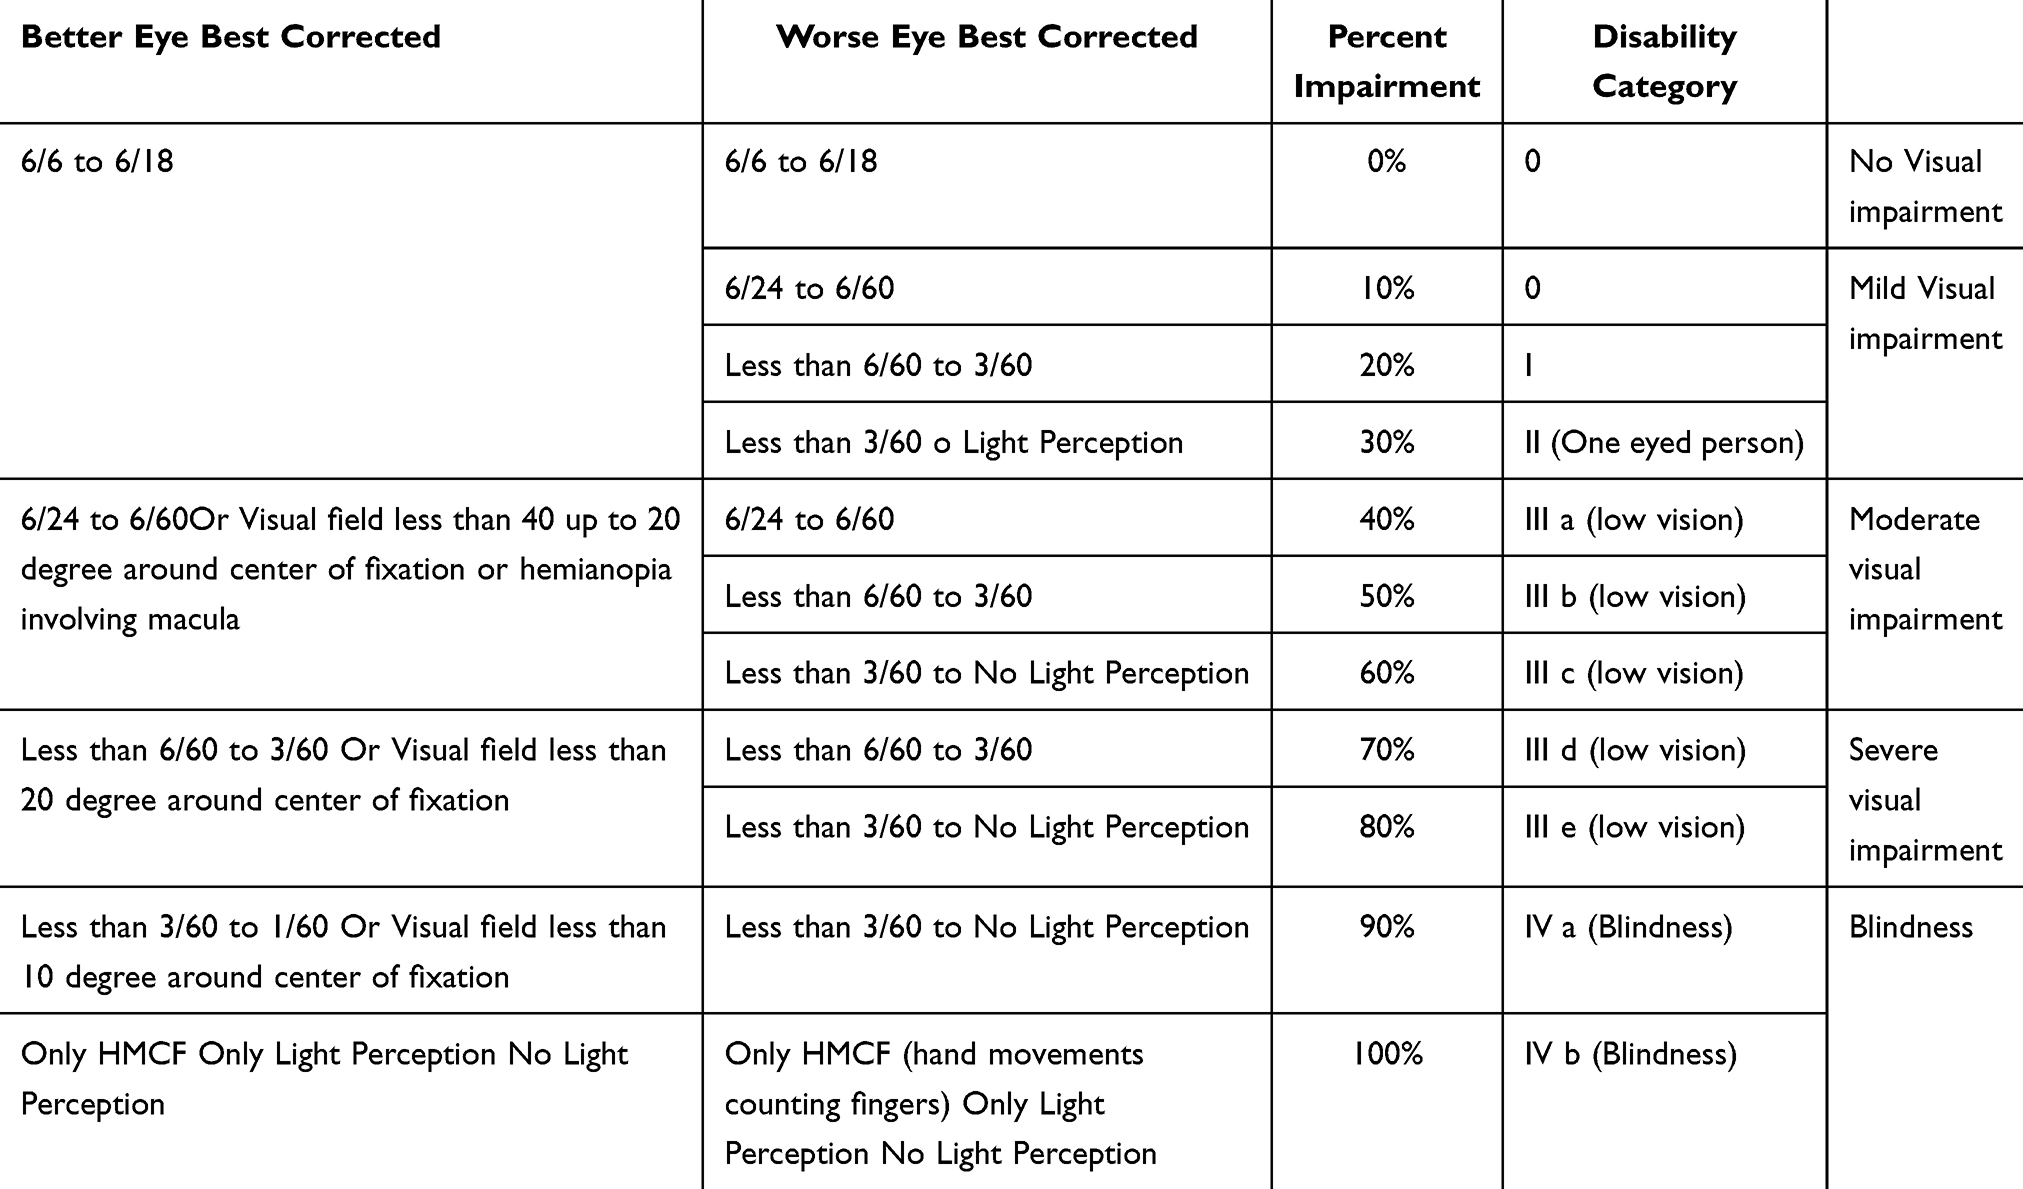 |
Table 1 Visual Impairment (VI) Disability Categories as per the Proposed Guidelines of the Government of India |
Results
A total of 194 applications for disability certificates were analyzed, of which 60.8% (118) were males and 39.2% (76) were females. Most of the applications were from the 35–60 years age group (41.2%), followed by the 18 (26.8%), 60+ (17.5%), and 18–35 years age groups (14.4%). A total of 28.4% of the applicants had been educated until middle school, whereas 13.4% and 11.4% obtained high school and graduate level education, respectively. A total of 23.2% of the applicants had completed only primary school, and the remaining 23.2% had no educational qualifications.
Among the 194 applicants, only 10 had a history of consanguinity in their family (5.2%). Additionally, only 14 applicants (7.2%) had a history of eye disease in their families.
We found that 8.8% of patients had a history of eye trauma, and 22.7% had a history of previous eye surgery. Additionally, only 17.5% reported a history of usage of low vision aids.
We classified the causes of VI on the basis of the site of disease as the whole globe, cornea, lens, retina, optic nerve, or cortex. The leading anatomical site was the retina (36.7%), followed by the whole globe (27.8%), optic nerve (17.5%), cornea (9.8%), lens (6.7%), and cortex (1.5%) [Figure 1].
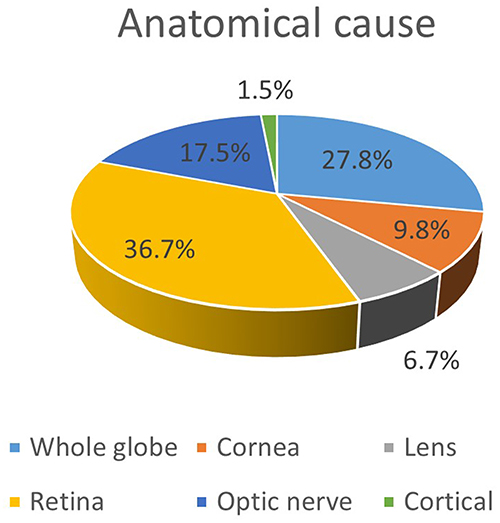 |
Figure 1 Distribution of patients according to anatomic cause. |
The leading etiological cause of VI/blindness was dystrophy (25.8%) (N=50), followed by congenital diseases (19.1%) (N=37) and degenerative conditions (12.4%) (N=24). Other major causes were refractive error/amblyopia (8.2%) (N=16), trauma (8.2%) (N=16), hereditary diseases (7.2%) (N=14), vascular conditions (5.7%) (N=11), inflammatory conditions (5.7%) (N=11), and glaucoma (5.7%) (N=11). Other causes were strabismus/amblyopia (1.5%) (N=3) and neoplasia (0.5%) (N=1) [Table 2].
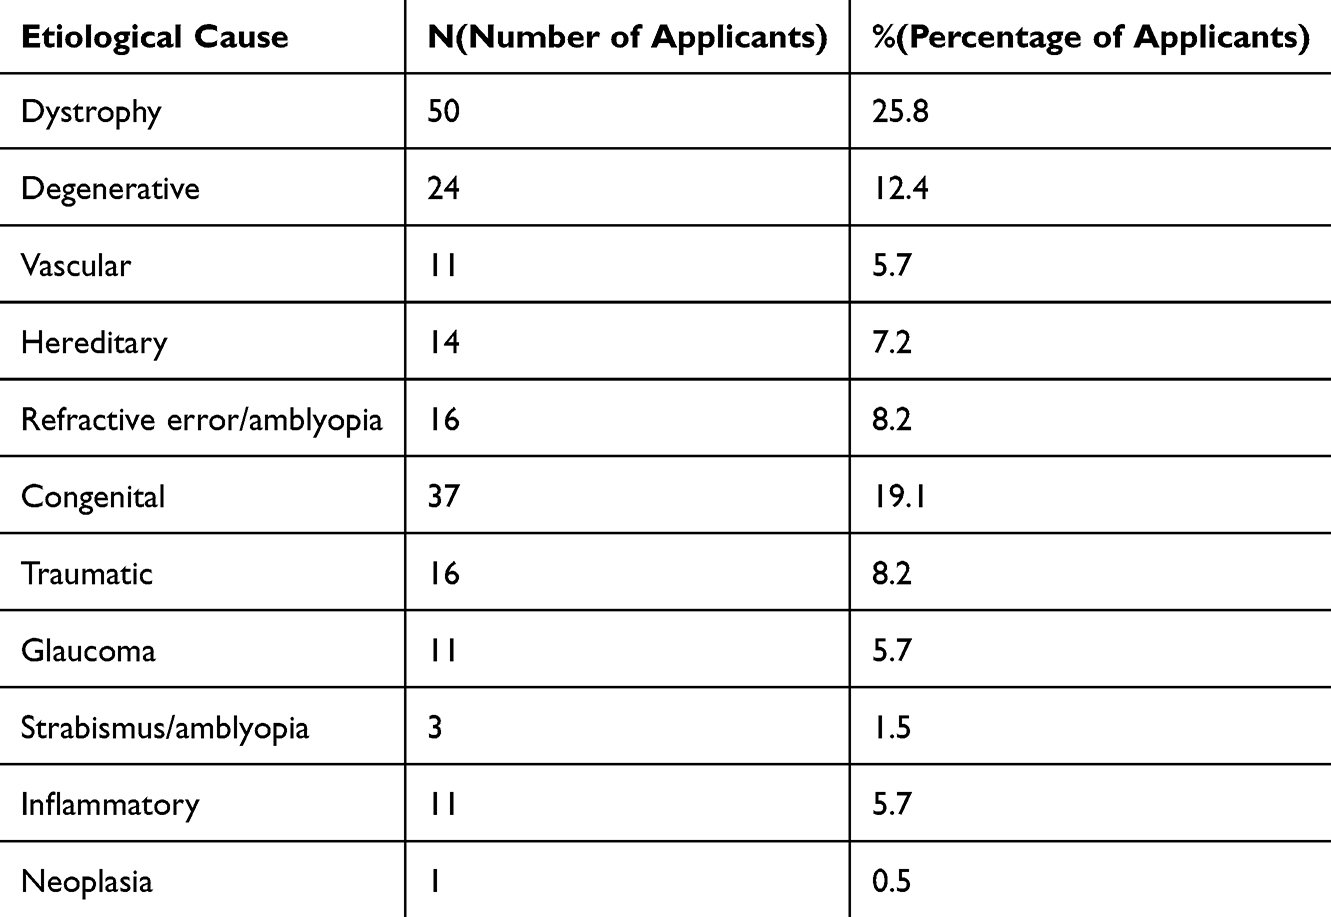 |
Table 2 Distribution of Patients by Etiological Cause |
Almost one-third of the cases (28.9%) were found to have been preventable causes of VI/blindness [Table 3]. Among these, the maximum number of avoidable cases was observed in the under 18 age group (40.4%), followed by the 60+, 35--60-, and 18--35-year-old age groups (in descending order) [Figure 2]. However, there was no statistically significant correlation between age and whether the cause of VI was preventable (p=0.071).
 |
Table 3 Distribution of Patients Based on the Presence of a Preventable/Avoidable Cause |
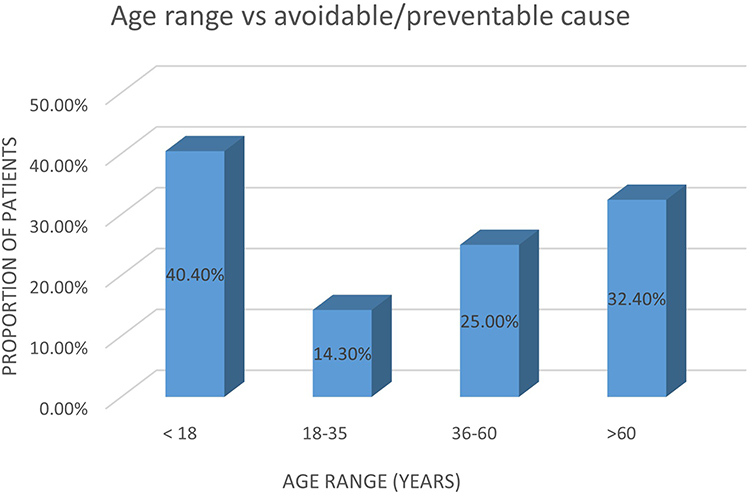 |
Figure 2 Distribution of patients based on the presence of a preventable/avoidable cause. |
We found no association between age and the anatomical site of disease (p= 0.167); however, there was a significant association between age and the etiology of disease (p=0.001). A greater proportion of those under 18 years of age were found to have congenital diseases, whereas in elderly individuals (60+), the predominant causes of VI/blindness were dystrophy or degenerative diseases [Figures 3 and 4].
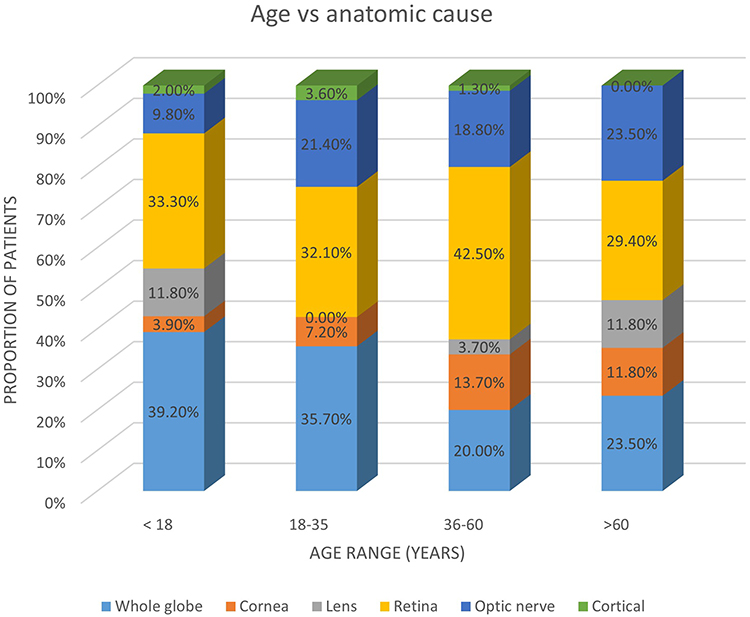 |
Figure 3 Association between age and anatomic cause. |
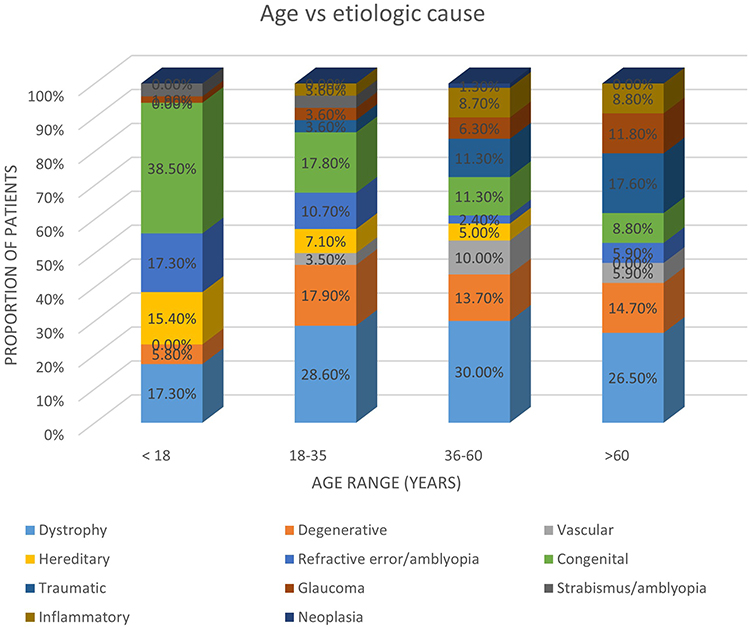 |
Figure 4 Association between age and etiological cause. |
More than half of the applicants were categorized as blind (59.3%), followed by 21.1% with moderate VI, 13.4% with mild VI, and 6.2% with severe VI [Table 4].
 |
Table 4 Distribution of Patient-Based Categories of Visual Impairment |
Age was correlated with the severity of visual impairment (p=0.022), with most older patients rather than younger patients falling under the blindness category [Table 5]. Similarly, age was also significantly related to the percentage of patients with disability (p<0.001).
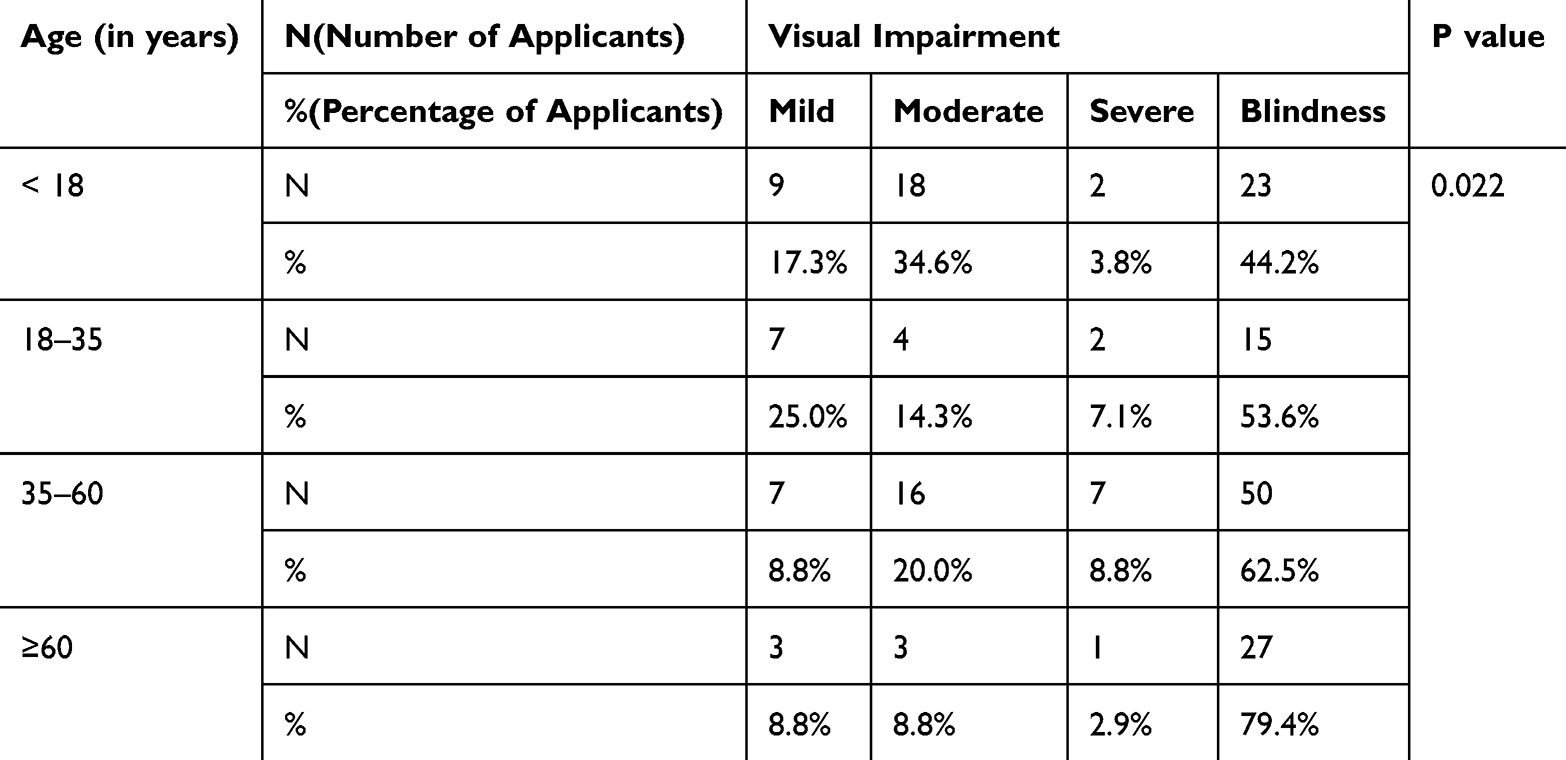 |
Table 5 Association Between Age and Low Vision According to Chi-Square Analysis. Age Was Significantly Linked to the Severity of Low Vision, With Most Older Patients Showing Blindness Than Younger Patients |
There was no association between the anatomical site of disease and the severity of visual impairment (p= 0.089). Furthermore, no correlation was found between the etiology of disease and the severity of visual impairment (p=0.075) [Table 6 and 7]. However, the percentage disability of patients was greater for retinal diseases than for whole-globe diseases (p=0.021). Similarly, etiologic cause was also associated with the percentage of disability (p<0.001), the p value being significant, as only one patient with neoplasia had 100% disability [Table 7].
 |
Table 6 Association Between Anatomic Cause and Percentage Disability According to ANOVA |
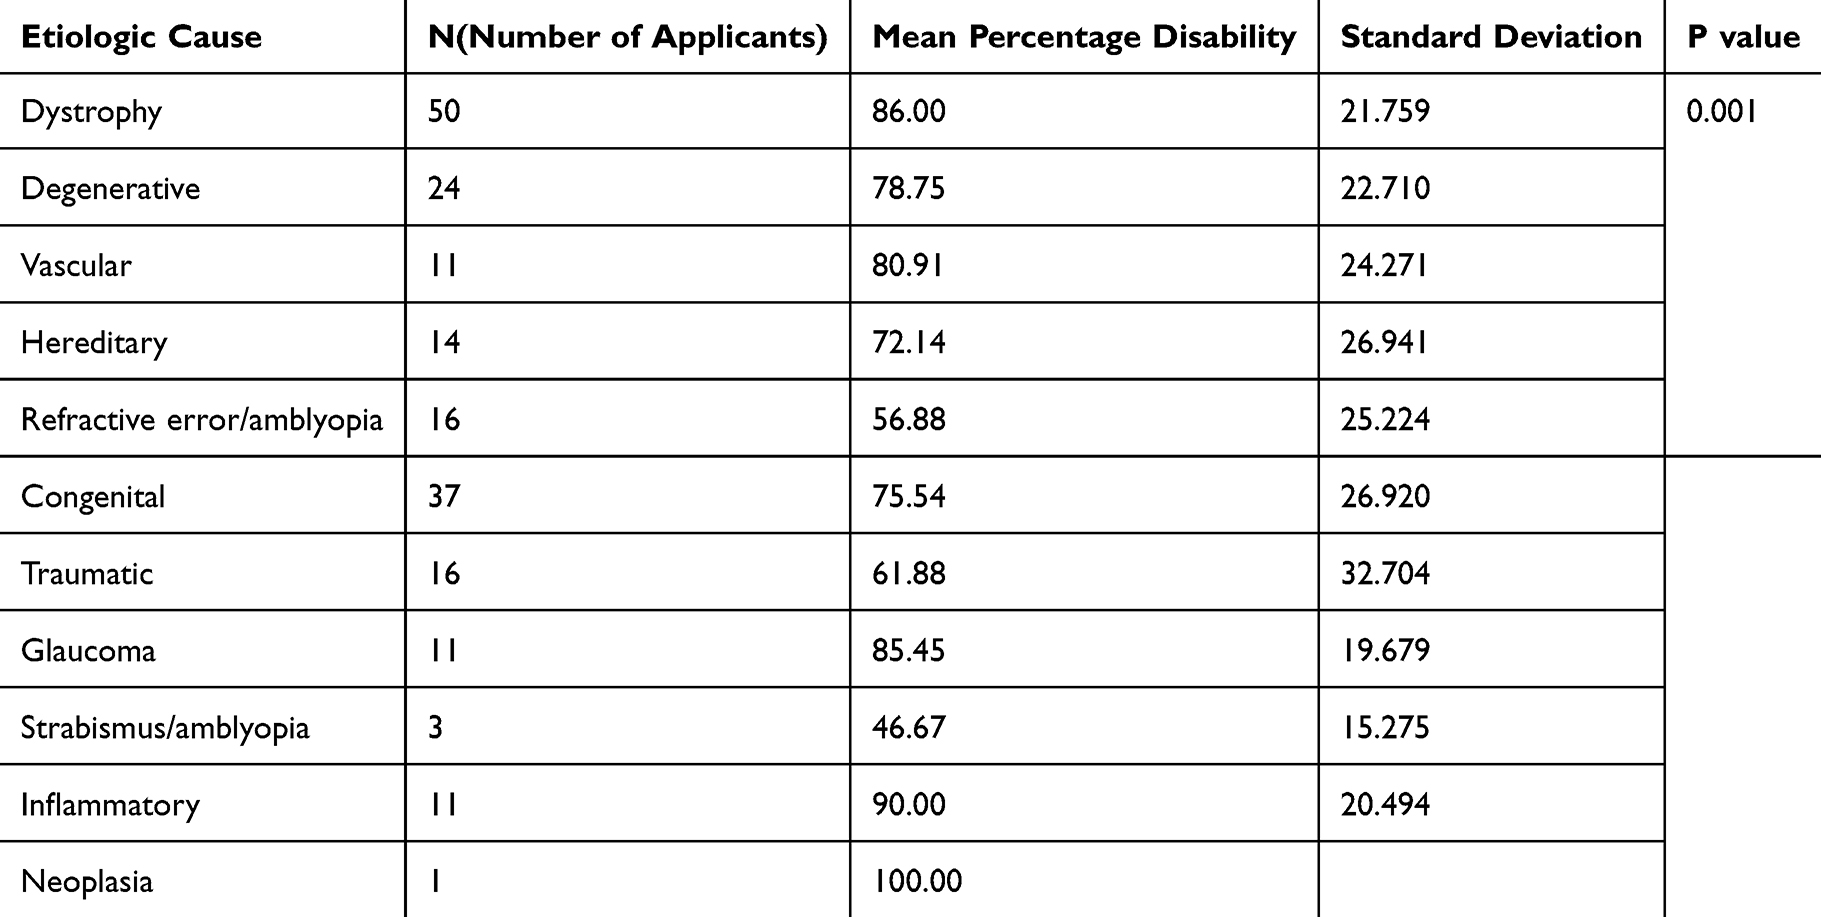 |
Table 7 Etiologic Cause Vs Percentage Disability According to ANOVA |
In terms of the relationship between the prevention of VI and disease severity, blindness was observed in a significantly lower proportion of patients with an avoidable cause [Table 8].
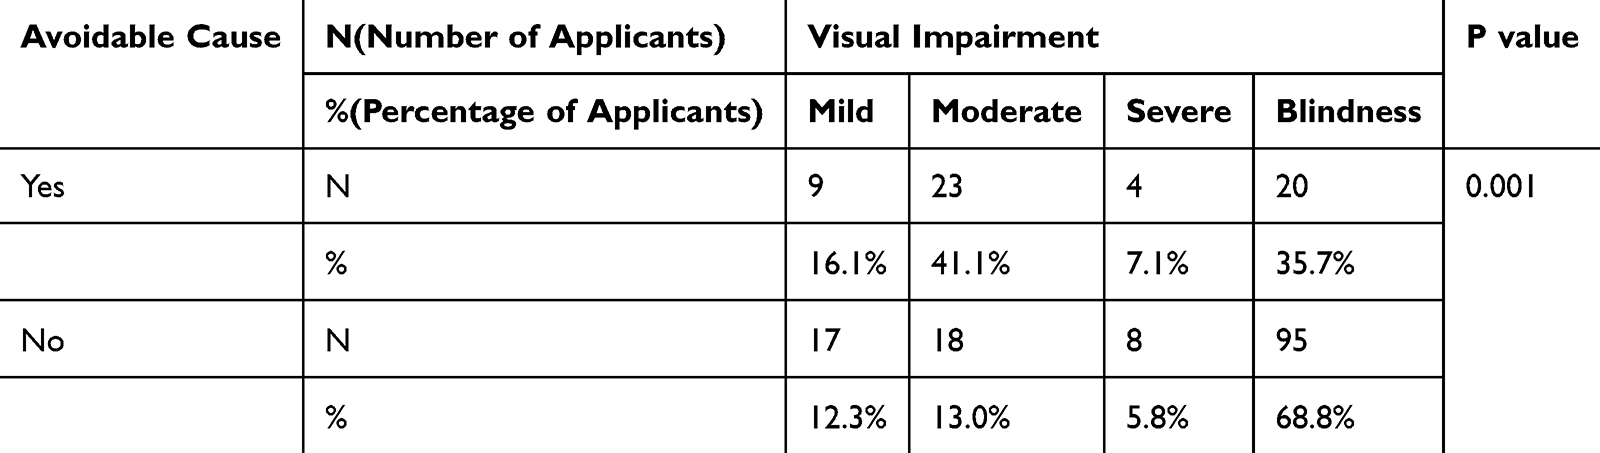 |
Table 8 Presence of Avoidable Causes Vs Visual Impairment via Chi-Square Analysis |
When the specific diagnostic causes of visual impairment and blindness were analyzed, the leading cause was retinitis pigmentosa (18.56%), followed by optic atrophy (11.86%), corneal opacities (9.79%), and pathological myopia (6.7%) [Table 9]. Other significant conditions included glaucoma, macular dystrophy, and diabetic retinopathy [Table 9].
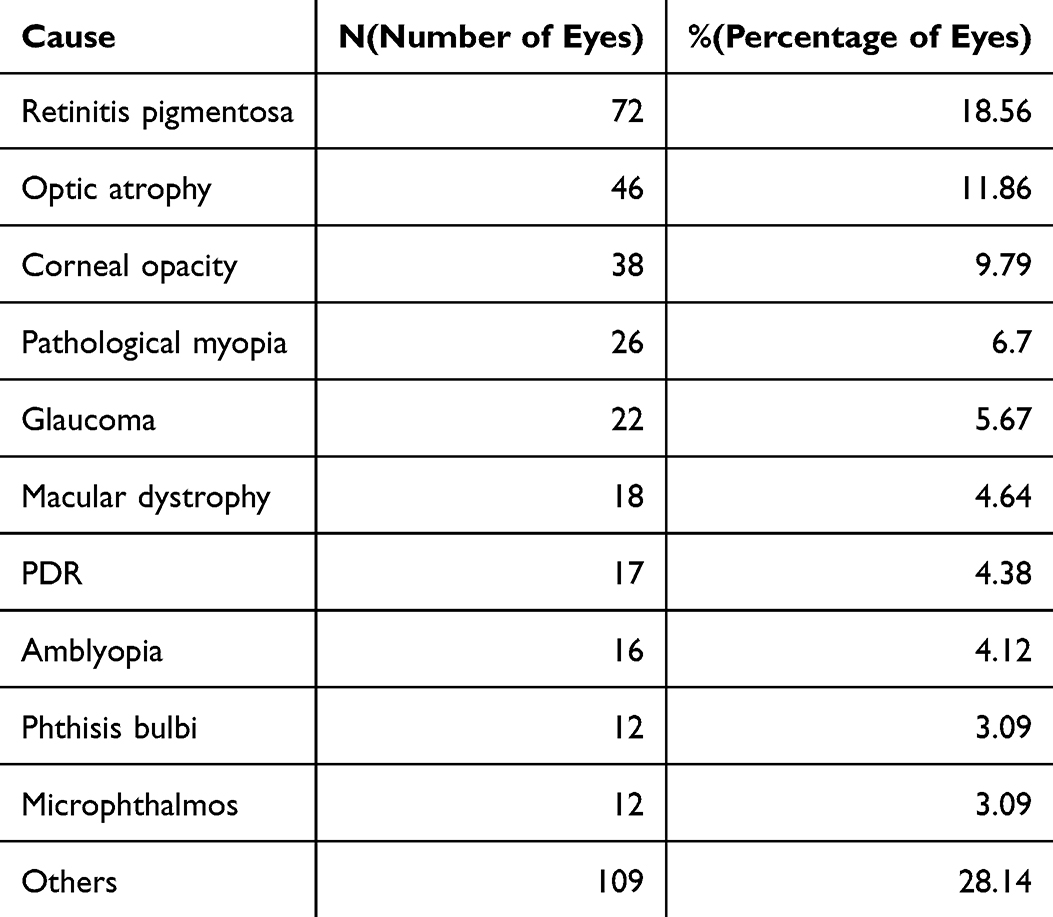 |
Table 9 Distribution of Specific Diagnoses in the Study Population |
Discussion
As argued by Wong et al, there are significant economic and social consequences for visual impairment, which cost approximately 0.5–0.7% of our nation’s yearly GDP.10 Visual disability certification is an attempt to bridge this socioeconomic gap by identifying those in need of visual rehabilitation measures, with the added benefit of providing valuable data. This can be used to monitor changing trends in eye disease and aid in the crafting of regional and national health care policies.
A majority of the applicants in our study were males, and a similar trend was observed in similar studies conducted in other regions of Karnataka, such as Hassan11 and Bangalore.12 The same trend is observed in other states.9,13–15 However, compared with national4 and global2 surveys, visual impairment is more common in females, which leads us to conclude that there is an underrepresentation of females in applications for disability certificates. This could be due to a greater proportion of male applicants for job-related benefits or due to a lack of accessibility/knowledge for female applicants.
Approximately fifty-five percent of the applicants were from the working population (18--60 years), mirroring the trends reported in similar studies.11,12,14 Notably, as shown by Bunce et al, this may not be representative of the entire region, as there is a tendency for eligible patients to be unregistered, and this tends to increase with age.16 Furthermore, other studies have noted that the primary motives for seeking visual disability certification are financial and transport reasons, which are required more by working-age groups, leading to their overrepresentation.17
A total of 23.3% of the applicants did not have any educational qualifications. This is an important sociodemographic factor to consider, as it has been noted that the odds of blindness increase with illiteracy.4 Several measures aimed at preventing eye disease, such as screening camps and awareness programs conducted at schools, fail to reach this segment of our population. On the other hand, the lack of schools for the blind in rural areas might have led to a greater proportion of applicants with blindness having no educational qualifications.
More than one-third of the applicants had retinal problems, followed by diseases worldwide. An increased prevalence of retinal diseases has also been observed in Bangalore,9 which is in the same state as Karnataka, and also in Central India.13 Khan et al in northern Maharashtra14 and Ghosh et al in West Bengal15 also reported a high proportion of global issues among visually impaired people. Our study also revealed that the leading cause of visual impairment is retinitis pigmentosa, closely mimicking the trend in Bangalore. A study in Central India noted an increase in the prevalence of retinitis pigmentosa in their region13. Other retinal diseases include macular and cone dystrophies, diabetic retinopathies, and Stargardt’s disease. This is especially significant given that our study revealed that there is greater severity/percentage of disability in retinal diseases. This contrasts with global estimates of cataracts and uncorrected refractive error as leading causes of visual impairment.
In addition to dystrophies (25.8%), congenital eye diseases are the largest contributors to impaired vision. The leading etiological cause in the under 18 age group is congenital disease, whereas the >60 years population primarily has dystrophic or degenerative diseases. This indicates a need for a long-term approach via genetic counseling and education. Awareness regarding the dangers of consanguineous marriages must be stressed. This is because the predominant pattern of retinitis pigmentosa in India is autosomal recessive, of which 92% is the result of a consanguineous marriage.18 This would also contribute to a reduction in the incidence and severity of complications seen in retinitis pigmentosa, such as glaucoma and complicated cataracts.19 Other diseases observed in our region, such as oculocutaneous albinism, congenital cataracts, and retinal/macular dystrophies, can also be the result of consanguinity. Additionally, access to affordable genetic screening is still a significant barrier, thus necessitating a grassroots preventive approach.
A nationwide survey of blindness in the 50+ age group revealed an estimated decrease of 25% in the number of individuals with impaired vision in India,4 with a cataract-centric approach used thus far.20 It is the need of the hour to consider a larger investment in preventive approaches rather than just treatment-based approaches. Our study revealed that only 28.9% of those with impaired vision had a background of avoidable causes, with a maximum in the under 18 age group. Notably, the severity of the disease is lower for avoidable diseases. Among the avoidable causes, disability due to refractive errors, congenital cataracts, and amblyopia could be reduced by increasing screening in schools and via health camps. An increase in the stringency of workplace regulations and better awareness of workplace injuries and their prevention are also necessary to address the burden of phthisis bulbi.14,15 Unlike other avoidable conditions, the prevalence of diabetic retinopathy has increased globally in the last two decades.5 This is especially concerning, as the burden of diabetes mellitus is expected to increase over time, especially in Asia, to as high as 600 million by the year 2040.21 Interventions for increasing the severity of diabetic retinopathy require increases in both skill and resources; therefore, the best approach is prevention via knowledge, screening, and adequate pharmacological and lifestyle measures.
We must consider not only the prevalence but also the degree of disability experienced. Approximately fifty-nine percent of the applicants were not just visually impaired but were certified as blind. There is a positive association between increasing severity of disease and age, similar to the findings of the West Bengal study (with a correlation coefficient of 0.12).15 With increased life expectancy and as the population ages, this will become even more relevant. It must be ensured that access to visual health services is offered to all age groups, with measures considering those in rural areas and without access to transport.
Conclusion
We may not be able to extrapolate the results of this study to the national level because of the smaller sample size and underregistration by the people for various reasons. However, this study provides evidence-based local data for effectively planning, implementing, monitoring, and evaluating community-based interventions in Karnataka. The utilization of data from regional surveys along with national surveys is needed to effectively plan for the future of our citizens’ health, but bias due to underregistration in some age groups must be considered.
Data Sharing Statement
Data are available from Mendonca, T. (2024, July 18). CLINICO-DEMOGRAPHIC PROFILE OF VISUAL DISABILITY IN A TERTIARY CARE CENTRE IN SOUTH INDIA. https://doi.org/10.17605/OSF. IO/TPCF4.
Ethical Committee Clearance
Institutional ethical committee clearance for the study was obtained. Name of the Institute: Kasturba Medical College, Mangalore IEC No: IEC KMC MLR 04-2022/120.
Consent to Participate/Consent for Publication
(According to ICMJE Recommendations for protection of research participants): Obtained from participants.
Author Contributions
All authors made a significant contribution to the work reported, whether that is in the conception, study design, execution, acquisition of data, analysis and interpretation, or in all these areas; took part in drafting, revising or critically reviewing the article; gave final approval of the version to be published; have agreed on the journal to which the article has been submitted; and agree to be accountable for all aspects of the work.
Mendonca, T. (2024, July 18). CLINICO-DEMOGRAPHIC PROFILE OF VISUAL DISABILITY IN A TERTIARY CARE CENTRE IN SOUTH INDIA. https://doi.org/10.17605/OSF. IO/TPCF4.
Funding
There is no funding to report.
Disclosure
The authors report no conflicts of interest in this work.
References
1. World Health Oganisation. International classification of diseases 11th Revision. 2019. Available from: https://icd.who.int/browse11/l-m/en#/http%3a%2f%2fid.who.int%2ficd%2fentity%2f1103667651.
2. Bourne RRA, Flaxman SR, Braithwaite T. Vision Loss Expert Group. et al. Magnitude, temporal trends, and projections of the global prevalence of blindness and distance and near vision impairment: a systematic review and meta-analysis. Lancet Glob Health. 5;2017:e888–e97. doi:10.1016/S2214-109X(17)30293-0
3. World Health Organization (WHO). Universal Eye Health: A Global Action Plan 2014–19; 2013.
4. Vashist P, Senjam SS, Gupta V, et al. Blindness and visual impairment and their causes in India: results of a nationally representative survey. PLoS One. 2022;17(7):e0271736. doi:10.1371/journal.pone.0271736
5. GBD. 2019 blindness and visual impairment coordinators. trends in prevalence of blindness and distance and near vision impairment over 30 years: an analysis for the global burden of disease study. Lancet Glob Heal. 2021;9(2):e130–43. doi:10.1016/S2214-109X(20)30425-3
6. Murthy GV, Gupta SK, Bachani D, Jose R, John N. Current estimates of blindness in India. Br J Ophthalmol. 2005;89:257–260. doi:10.1136/bjo.2004.056937
7. Burton MJ, Ramke J, Marques AP, et al. The lancet global health commission on global eye health: vision beyond 2020. Lancet Glob Heal. 2021;9(4):e489–551. doi:10.1016/S2214-109X(20)30488-5
8. Guidelines for evaluation of various disabilities and procedure for certification. part 1. Gazette India Extraordinary. 154.
9. Ambastha A, Kusumesh R, Sinha S, Sinha BP, Bhasker G. Causes of visual impairment in applications for blindness certificates in a tertiary center of Bihar and its role in health planning. Indian J Ophthalmol. 2019;67:204–208. doi:10.4103/ijo.IJO_837_18
10. Wong B, Singh K, Khanna RK, et al. The economic and social costs of visual impairment and blindness in India. Indian J Ophthalmol. 2022;70:3470–3475. doi:10.4103/ijo.IJO_502_22
11. Kareemsab D, Rachaiah NM, Balasubramanya B. The prevalence of the leading causes of certification for blindness and partial sight in the Hassan district of Karnataka. India J Clin Diagn Res. 2011;5:1624–1626.
12. Menon RC, Rathod AM, Appaji S, Hanumantharayappa A, Sadananda HB. Assessment of visual disability, clinical and demographic profile from Unique Disability Identification Details (UDID) card applicants in Regional Institute of Ophthalmology (RIO) in South India. IP Int J Ocul Oncol Oculoplasty. 2022;8:46–51. doi:10.18231/j.ijooo.2022.010
13. Joshi R.causes of visual handicap among patients attending outpatient department of a medical college for visual handicap certification in central India. J Clin Ophthalmol Res. 2013;1:17–19. doi:10.4103/2320-3897.106275
14. Khan MGG, Gawai DS, Choudhary KG. Khannar AS. visual handicap certificate: a tool to evaluate the causes for permanent visual impairment in Northern Maharashtra. Indian J Clin Exp Ophthalmol. 2020;6:222–226. doi:10.18231/j.ijceo.2020.048
15. Ghosh S, Mukhopadhyay S, Sarkar K, Bandopadhyayay M, Maji D, Bhaduri G. evaluation of registered visually disabled individuals in a district of West Bengal. Indian J Community Med. 2008;33:168–171. doi:10.4103/0970-0218.42057
16. Bunce C, Wormald R. Leading causes of certification for blindness and partial sight in England & Wales. BMC Public Health. 2006;6:58. doi:10.1186/1471-2458-6-58
17. Farooq S, Kochar A, Goyal R. Visual disability certification: a boon for the specially abled. Int J Community Med Public Health. 1400;8:10.18203/2394–6040.ijcmph20210834.
18. Vinchurkar MS, Sathye SM, Dikshit M. Retinitis pigmentosa genetics: a study in Indian population. Indian J Ophthalmol. 1996;44:77–82.
19. Battu R. Commentary: visual impairment due to retinitis pigmentosa in India. In: Indian Journal of Ophthalmology. Vol. 71. 2023:908–909.
20. Dandona L, Dandona R, Naduvilath TJ. Is current eye-care policy focused almost exclusively on cataracts adequate to address blindness in India? Lancet. 1998;351:1312–1316. doi:10.1016/S0140-6736(97)09509-3
21. Ogurtsova K, da Rocha Fernandes JD, Huang Y, et al. IDF diabetes atlas: global estimates for the prevalence of diabetes for 2015 and 2040. Diabet Res Clin Pract. 2017;128:40–50. Epub 2017 Mar 31. PMID: 28437734. doi:10.1016/j.diabres.2017.03.024
 © 2025 The Author(s). This work is published and licensed by Dove Medical Press Limited. The
full terms of this license are available at https://www.dovepress.com/terms
and incorporate the Creative Commons Attribution
- Non Commercial (unported, 3.0) License.
By accessing the work you hereby accept the Terms. Non-commercial uses of the work are permitted
without any further permission from Dove Medical Press Limited, provided the work is properly
attributed. For permission for commercial use of this work, please see paragraphs 4.2 and 5 of our Terms.
© 2025 The Author(s). This work is published and licensed by Dove Medical Press Limited. The
full terms of this license are available at https://www.dovepress.com/terms
and incorporate the Creative Commons Attribution
- Non Commercial (unported, 3.0) License.
By accessing the work you hereby accept the Terms. Non-commercial uses of the work are permitted
without any further permission from Dove Medical Press Limited, provided the work is properly
attributed. For permission for commercial use of this work, please see paragraphs 4.2 and 5 of our Terms.