Back to Journals » Clinical Ophthalmology » Volume 10
Clinical outcomes with toric intraocular lenses planned using an optical low coherence reflectometry ocular biometer with a new toric calculator
Authors Gundersen KG ![]() , Potvin R
, Potvin R ![]()
Received 23 August 2016
Accepted for publication 22 September 2016
Published 3 November 2016 Volume 2016:10 Pages 2141—2147
DOI https://doi.org/10.2147/OPTH.S120414
Checked for plagiarism Yes
Review by Single anonymous peer review
Peer reviewer comments 4
Editor who approved publication: Dr Scott Fraser
Video abstract presented by KG Gundersen and R Potvin.
Views: 1329
Kjell G Gundersen,1 Richard Potvin2
1IFocus Øyeklinikk AS, Haugesund, Norway; 2Science in Vision, Akron, NY, USA
Purpose: To prospectively evaluate postoperative clinical outcomes with implantation of toric intraocular lenses (IOLs) using preoperative keratometry from an optical low coherence reflectometry (OLCR) ocular biometer (Lenstar® LS900) and the built-in Barrett toric calculator.
Patients and methods: A prospective observational study recruited one or both eyes of subjects who underwent uncomplicated cataract surgery with toric IOL implantation using OLCR biometery data and the Barrett toric IOL calculator for toric IOL planning. Data were collected at the preoperative, operative, 1-day and 2-month postoperative visits. The primary outcome measure was the manifest refractive astigmatism magnitude at 2 months. The secondary outcome measures included the manifest refraction, corneal keratometry, and distance visual acuity (corrected and uncorrected). The results obtained with the Barrett toric calculator were compared with simulated results based on the toric calculators designed for the IOLs being used.
Results: Data from 98 eyes of 54 subjects were available for analysis. In the 74 eyes with postoperative lens orientation as planned, and sufficient IOL cylinder power to correct subjects’ measured astigmatism, 77% of eyes (57/74) had 0.5 diopter (D) or less refractive cylinder 2 months postoperatively, while 89% (66/74) had 0.75 D or less. Simulated results after adjusting actual IOL orientation to the planned orientation suggested that the Barrett calculator would result in postoperative residual astigmatism about 0.2 D lower than that expected with standard calculators.
Conclusion: Use of the Barrett toric calculator with biometry data from the Lenstar LS900 biometer for toric IOL planning in a clinical setting resulted in significantly lower levels of residual refractive cylinder than might be expected with standard calculators. Postoperative lens orientation and variability in the measurement of corneal astigmatism pre- and postoperatively appear to be important limiting factors in toric IOL outcomes.
Keywords: Lenstar, keratometry, cataract surgery, astigmatism, cylinder, toric IOL
Introduction
Toric intraocular lenses (IOLs) are arguably one of the most successful methods to reduce astigmatism at the time of cataract surgery.1 However, residual astigmatism after toric IOL implantation remains a concern, with 36.5% of eyes not within 25% of their target astigmatism correction and 35.2% having uncorrected distance visual acuity worse than 20/25.1,2 In otherwise healthy and uncomplicated cataract surgeries, one of the most important causes for unexpected residual astigmatism postoperatively is believed to be inaccurate preoperative keratometry measurements.2 Some commonly used toric calculators can also suffer from inaccuracies that render the results less reliable.3,4
Even with accurate measurement, most keratometry measurement devices and toric calculators do not include consideration of the posterior cornea. One study suggests that ignoring posterior corneal astigmatism (PCA) may be a significant factor with regard to postoperative refractive astigmatism after toric IOL implantation.5 PCA has been noted to have an average power of 0.3 diopter (D), with a range from 0.0 D to 1.0 D; the steep meridian was observed to be vertical in the majority of cases.6 It was observed to be higher than 0.5 D in up to 55% of cases in one sample population.7 Orientation of PCA is also variable. It may be possible to predict the orientation of the steep meridian of the posterior cornea when the steep meridian of the anterior cornea is vertical (with-the-rule, or WTR), but it is more difficult to predict when the steep meridian of the anterior cornea is horizontal (against-the-rule, or ATR) or oblique, especially in patients with high ATR anterior corneal astigmatism.8,9 Given the above, corneal astigmatism measurements that rely only on measurement of the anterior corneal surface may be poor predictors of the true total corneal astigmatism. The likely results of calculations based only on anterior corneal astigmatism are toric lens powers that overcorrect eyes with WTR anterior corneal astigmatism and undercorrect eyes with ATR anterior corneal astigmatism.7,10,11
There are currently three different methods used to account for the effects of PCA on total corneal astigmatism. The most direct is to measure the anterior and posterior surfaces of the cornea, as this accounts for anterior and PCA. However, this is only as reliable as the actual measurements, and the reliability of some of the devices currently used to measure PCA has been questioned.12–14 Another approach is to compensate for expected PCA using a population-based nomogram or an adjustment of the actual calculator using proxy data to predict PCA. Some that have been discussed in the literature include the Baylor nomogram, the subtoric IOL calculator, Goggin et al nomogram, and the Barrett toric IOL calculator.3,4,8,12 The Baylor nomogram and the subtoric IOL calculators both used Scheimpflug devices on a population set to determine average PCA.8,12 Both methods are likely to suffer from some inaccuracies due to inherent problems with the measuring device and also by not taking into account or by assuming a fixed location of the steep meridian of the PCA.8,12,13 The Goggin et al nomogram adjusts the anterior corneal astigmatism based on the orientation of the anterior cornea (ie, WTR or ATR) and on the toric lens power. The latter limitation applies the nomogram only to toric IOLs with ≤2.0 D of cylinder correction, because the effects of PCA appear negligible with higher cylinder power.3 The Barrett toric calculator estimates the PCA for each eye using a proprietary mathematical model.4
Early evidence suggests the Barrett toric IOL calculator may be more precise when compared with direct measurement of the PCA or application of the Baylor nomogram to the AcrySof and Holladay toric IOL calculators.4,15 One study demonstrated that using the keratometry values from a biometer based on optical low coherence reflectometry (OLCR; Lenstar LS900®, Haag-Streit AG, Koeniz, Switzerland) and the Barrett toric IOL calculator together was likely to further improve results after toric IOL implantation.4 However, analyses to date have been theoretical, and based on measured postoperative, rather than preoperative, keratometry.
The purpose of the current study was to prospectively evaluate postoperative clinical outcomes when toric IOLs were planned using keratometry from the Lenstar biometer and the built-in Barrett toric calculator. The primary measure of interest was the postoperative refractive astigmatism. Results were compared with simulated results based on planning the toric IOL using the standard calculator for each lens type.
Patients and methods
This was a prospective observational (noninterventional) single-arm study of toric IOL implantations completed by a single surgeon at one site. Subjects without any disease/condition that might have compromised refractive outcomes after cataract surgery were recruited. Participating subjects signed a written informed consent on enrollment. Consecutive patients from 9/10/15 to 3/2/16 were invited to participate. The target enrollment was 100 eyes. One or both eyes of each subject could be included. The study was approved by an appropriate ethics review committee (the Regional Committees for Medical and Health Research Ethics [REK], Norway), and was conducted in accordance with the tenets of the Declaration of Helsinki and Good Clinical Practice.
Included eyes were measured using an OLCR ocular biometer. Toric IOL power was calculated using the Barrett toric IOL calculator. All surgeries were completed with a 2.2 mm primary incision at the 12 o’clock position (superior). The Verion™ Image-guided System (Alcon, Fort Worth, TX, USA) was used for locating incisions, the capsulorhexis and the final orientation of the IOL in the eye. Surgeries were performed bilaterally on the same day.
All the subjects had four study visits, including one preoperative visit, a surgery visit, and 1-day and 2-month postoperative visits. Best-corrected monocular distance visual acuity, manifest refraction, and keratometry with an OLCR biometer were collected at the preoperative and 2-month postoperative visits. Lens orientation was also recorded at the 2-month visit. Uncorrected monocular distance visual acuity was recorded at the 1-day and 2-month postoperative visits. A high-contrast logMAR) chart under photopic lighting was used for all applicable visits. Adverse events were recorded at the operative and all postoperative visits.
The primary outcome measure was the manifest refractive astigmatism at the 2-month postoperative visit. Secondary outcome measures included the manifest refraction and the corrected and uncorrected distance visual acuity. An additional secondary measure was the postoperative keratometry to permit post-hoc analysis of corneal changes. The refractive results provided using the toric IOL calculation methods earlier were compared with simulated results based on the standard toric calculator for the given toric IOL. This was based on a “remove and replace” algorithm described previously.16
Clinical data were tabulated and deidentified on appropriate case report forms and tabulated in Microsoft Excel (Microsoft Corp., Redmond, WA, USA) along with a relevant data file that was exported from the ocular biometer. Toric IOL calculations using the relevant IOL-specific calculators were performed and recorded. All data were imported into an MS Access database for data checking, collation, and preliminary analysis (Microsoft Corp., Redmond, WA, USA). Statistical analyses were performed using the STATISTICA data analysis software system, version 12 (StatSoft, Inc., Tulsa, OK, USA). Statistical testing was performed using analysis of variance (ANOVA) on continuous variables and appropriate nonparametric tests on categorical data. Statistical significance was set at P=0.05.
Results
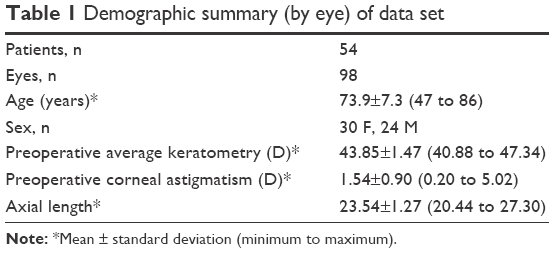
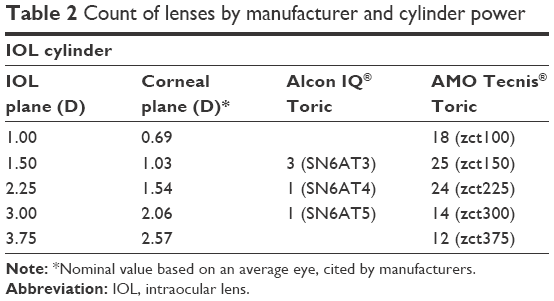
One hundred and one eyes of 55 subjects were successfully recruited. One subject (two eyes) was lost to follow-up and one eye of one subject was treated with additional relaxing incisions and so removed from the data set. That left 98 eyes of 54 subjects in the final data set. Demographics of the subject pool are shown in Table 1. As can be seen in Table 2, the majority of lenses implanted were Tecnis® Toric IOLs (Abbott Medical Optics, Santa Ana, USA), though 5 were Alcon IQ® Toric IOLs (Alcon, Fort Worth, USA). IOL cylinder power ranged from 1.00 D to 3.75 D, corresponding to a nominal power at the corneal plane from 0.69 D to 2.57 D.
 | Table 1 Demographic summary (by eye) of data set |
 | Table 2 Count of lenses by manufacturer and cylinder power |
The primary measure of interest was the residual refractive cylinder after toric IOL planning. There was no statistically significant effect of age (P>0.1) or gender (P>0.6) on the results. To analyze residual refractive cylinder, the data were divided by outcome class. In 4 cases, the calculated manifest residual cylinder after surgery was 0.5 D or higher because of limitations in the available cylinder powers for correction; this was not a function of the calculator. These cases were noted as “HighResid”. Second, in 11% of cases (11/98), the orientation of the IOL was not within 10 degrees of intended. All the misoriented lenses were Tecnis; all Alcon lenses were within 5 degrees of the intended orientation. Again, residual refractive error related to lens misorientation is not a function of the calculator. These cases were noted as “OffAxis”. In another 9 cases, the lens orientation could not be confirmed to be within 10 degrees of intended because the pupil could not be sufficiently dilated; these cases were labeled “Unknown”. The remaining 74 cases were within 10 degrees of intended and had an expected residual astigmatism <0.5 D; they were labeled “OK”. Figure 1 shows the histogram of residual refractive cylinder at the 2-month postoperative visit in this latter subgroup. As can be seen, 77% of eyes (57/74) had 0.5 D or less refractive cylinder at 2 months postoperative, while 89% (66/74) had 0.75 D or less. Figure 2 shows the ANOVA of refractive cylinder at 2 months by the groups identified earlier. There was a statistically significant difference between the groups (P=0.02).
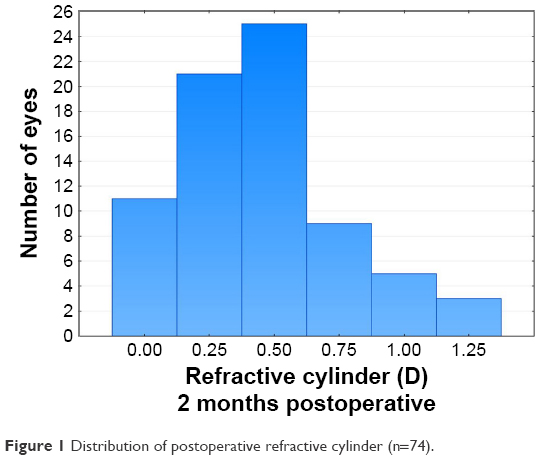 | Figure 1 Distribution of postoperative refractive cylinder (n=74). |
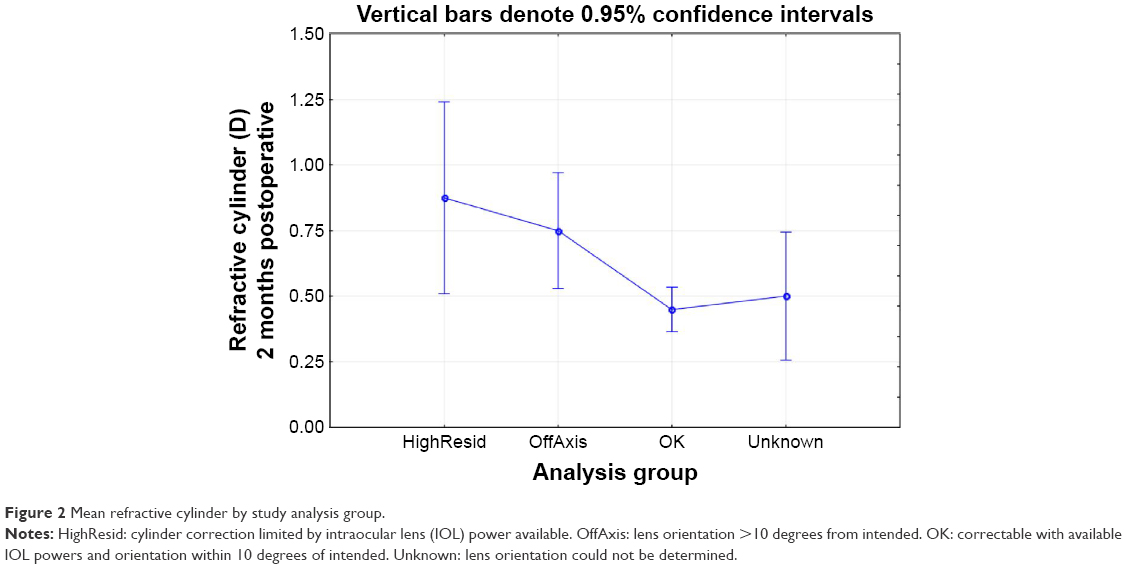 | Figure 2 Mean refractive cylinder by study analysis group. |
Summary refractive data for all eyes at 2 months postoperative are shown in Table 3. Figure 3 shows that the uncorrected visual acuity was slightly better in the “OK” group, but was not statistically significantly different from the other groups (P=0.12). There was no statistically significant difference in the best-corrected visual acuity (P=0.98) or the uncorrected visual acuity (P=0.12) between the groups. Seventy-one percent (70/98) of all eyes had an uncorrected visual acuity within one logMAR line of their best-corrected acuity.
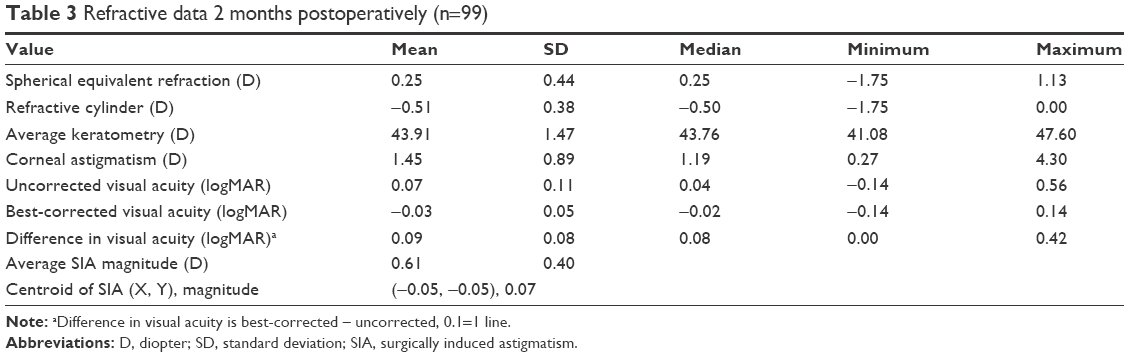 | Table 3 Refractive data 2 months postoperatively (n=99) |
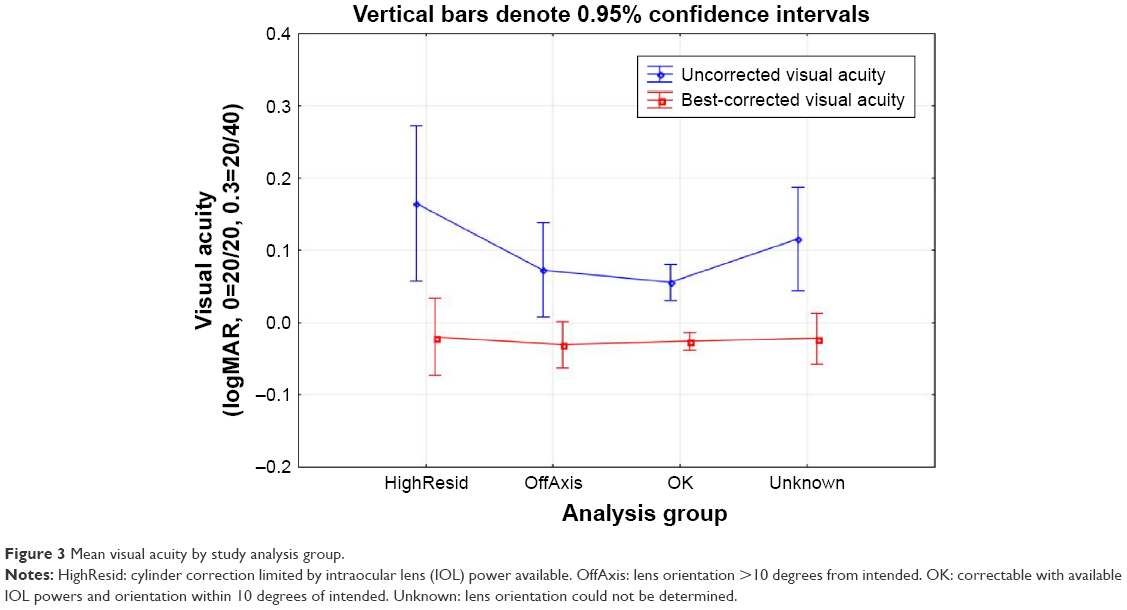 | Figure 3 Mean visual acuity by study analysis group. |
Surgically induced astigmatism (SIA) is defined as the measured change in corneal astigmatism from preoperative to postoperative. All surgical planning was based on an SIA value of 0.3 D, with vertical incisions in all eyes. The average SIA magnitude and the centroid (the vector sum) of the SIA vectors are shown in Table 3. As can be seen, the average SIA magnitude was higher than the planning value and the centroid was lower than the planning value.
For the 74 “OK” cases, the difference between the expected residual astigmatism and the actual postoperative refractive astigmatism could be calculated using vector math. The absolute mean difference and standard deviation was 0.50 D±0.32 D. The difference was ≤0.5 D in 57% of cases (42/74) and ≤0.75 D in 80% of cases (59/74).
For the “OK” and “OffAxis” cases (n=85), a “remove and replace” algorithm was applied to compare the actual results with those that might have occurred if the standard toric calculator had been used; these were simulations based on available data, no surgery was performed. For each of the lenses already in the eye that were “OffAxis”, the IOL was “rotated” by first removing it and replacing it at the originally planned orientation based on the Barrett toric calculator; this was the “Adjusted Barrett” group. The Standard group was calculated by “removing” the IOL in the eye and replacing it with the IOL power and orientation suggested by the appropriate standard calculator (Alcon or Tecnis, depending on the IOL). Figure 4 shows an ANOVA of the expected postoperative residual astigmatism associated with the Adjusted Barrett and Standard groups, categorized by the IOL cylinder power at the corneal plane. There was a statistically significant difference in the expected refractive cylinder between the Adjusted Barrett group and the Standard calculation group (P<0.01) but no statistically significant effect of lens power (P=0.08) and no lens power/lens group interaction (P=0.77); the mean difference between the groups was just under 0.2 D. It is important to note that, in this simulation, the expected refractive cylinder in the Adjusted Barrett group was not always lower than in the Standard group. In almost one-half of the cases (42/85, or 49%), the difference in expected residual refractive cylinder from the two calculations was 0.25 D or less. In 9 of 85 cases, the expected residual refractive cylinder in the Standard group was more than 0.25 D lower than in the Adjusted Barrett group, while the reverse was true in 34 cases.
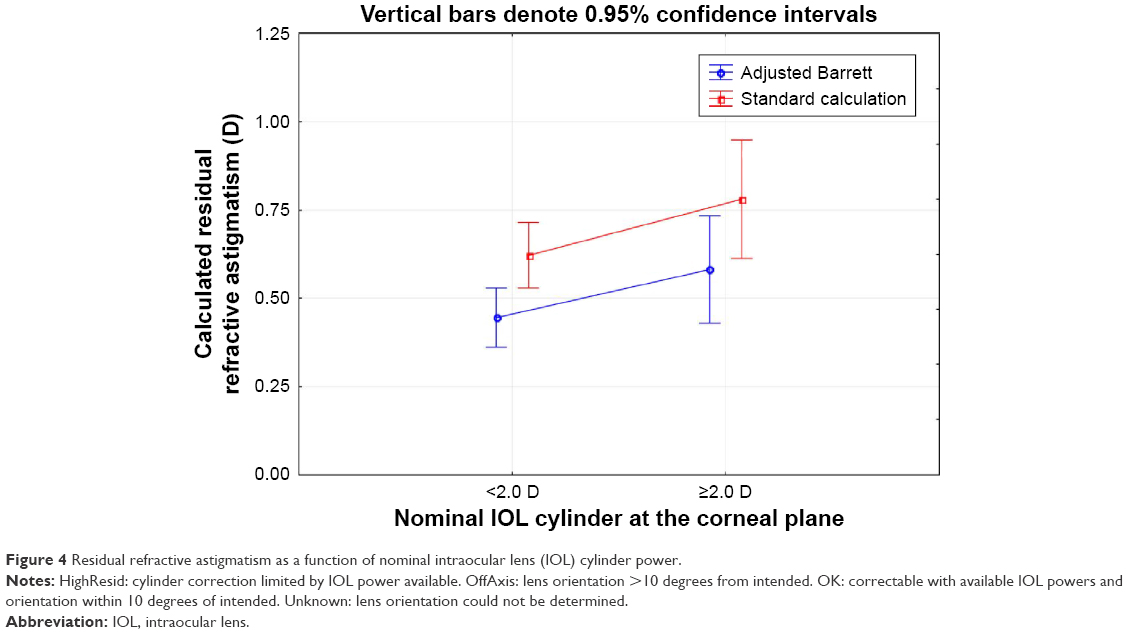 | Figure 4 Residual refractive astigmatism as a function of nominal intraocular lens (IOL) cylinder power. |
Discussion
We believe this is the first clinical case series reported of toric IOL implants that were planned using the Barrett calculator with the Lenstar LS900 biometer. Previous clinical results have been reported, but postoperative keratometry was used for the evaluation because the calculations were designed to highlight the advantages of the calculator.4,15 While this latter approach is helpful to understand the potential benefits of improved accuracy with the calculator, it does not provide any clinical expectations in a real-world setting.
In the study, a subpopulation of eyes most likely to be affected by the calculator (“OK” cases, eyes that could be corrected appropriately and in which the IOL was oriented as intended) was identified. In this subgroup, the percentage of eyes with 0.5 D or lower (77%) and 0.75 D or lower (89%) refractive cylinder at 2 months postoperative appeared consistent with results previously reported for the Barrett calculator, though the previous calculations were based on postoperative keratometry.4 These results appear better than previous results with other calculators that have been reported in the literature, a pooled estimate of 71% of eyes with 0.5 D or lower refractive cylinder was calculated from 11 studies (991 eyes) of one single piece hydrophobic acrylic IOL.17
The absolute mean difference between the expected and actual residual astigmatism was 0.5 D, which is lower when compared with Alcon and Holladay toric calculators as found in a previous study but 0.03 D higher than when the Alcon and Holladay toric calculators used the Baylor nomogram; note that this study used postoperative keratometry data.4 This suggests that taking into account the PCA plays an important role in toric lens calculations. In addition, the absolute mean difference between the expected and actual residual astigmatism was 0.11 D higher than previously found using the Barrett calculator and the OLCR keratometry values; this may be related to effects of SIA as the study being compared eliminated the effects of the SIA by using postoperative keratometry data.4
It is suggested by Goggin et al3 that an adjustment for PCA be applied only to lenses with 2.0 D or less of cylinder power. However, Figure 4 in the current study suggests that consideration of PCA is still important in cases with higher cylinder power, as simulated results with the Barrett calculator resulted in significantly less expected residual astigmatism relative to simulated results with a standard calculator.
Rotational stability of the toric IOLs in the eye is also a factor when evaluating clinical outcomes. In this study, 11% of lenses were not oriented as intended; the percentage of lenses that were misaligned by more than 10 degrees (11%) was somewhat higher than has been reported previously in the literature.18 However, the “remove and replace” algorithm applied to the postoperative data corrected for misalignment when comparative data were calculated.
The differences between the standard calculators and the Barrett formula were relatively modest in the current data set, compared with the residual refractive cylinder observed, but some overall improvement in aggregate results was evident. One possibility is that the comparison was done between groups where residual astigmatism was less than 0.5 D, so appreciating the difference between the toric calculators may not have been adequately realized with our current sample size. A larger study group is warranted to help elucidate the difference between the currently available toric calculators.
It appears that reducing variability in terms of SIA and keratometry may be necessary before the full effects of the improved calculator will be appreciated. Factors such as dry eye can significantly affect the repeatability of keratometry measurements in cataract patients.19 This will also affect the calculation of SIA, as SIA is the preoperative to postoperative vector difference in corneal astigmatism; this will be the sum of the actual change in corneal astigmatism and any measurement errors. The authors recommend that the vector centroid of the SIA value (here 0.07) be used for the Barrett toric calculator. This is because random variability in the measurement of corneal astigmatism will have a greater effect on the average SIA magnitude than on the vector centroid of the SIA. In a recent correspondence, Dr Koch and Dr Wang illustrated the importance of using a centroid SIA when calculating toric lens powers because the SIA value has a magnitude and a direction and should be treated as a vector sum as opposed to the sum of the absolute values.20 As such, if the centroid SIA value was used in the current study for preoperative planning, it is possible that the results could have been further improved.
In summary, using the Lenstar LS900 biometer with the Barrett toric calculator for toric IOL planning in a clinical setting resulted in residual refractive cylinder that was slightly lower than that expected with standard calculators. Clinical variability in the measurement of corneal astigmatism and SIA appears to reduce the expected differences between toric calculators; using the centroid SIA for toric calculations may further improve outcomes.
Acknowledgments
IFocus Øyeklinikk AS received an investigator-initiated study grant from Haag-Streit AG to conduct this research. IFocus Øyeklinikk AS provided funding to Science in Vision to assist with data analysis and preparation of this manuscript. Sarah Y Makari, OD, a consultant to Science in Vision, received compensation for providing writing assistance to the authors in preparation of the manuscript.
Disclosure
The authors report no conflicts of interest in this work.
References
Kessel L, Andresen J, Tendal B, Erngaard D, Flesner P, Hjortdal J. Toric intraocular lenses in the correction of astigmatism during cataract surgery: a systematic review and meta-analysis. Ophthalmology. 2016;123(2):275–286. | ||
Hirnschall N, Hoffmann PC, Draschl P, Maedel S, Findl O. Evaluation of factors influencing the remaining astigmatism after toric intraocular lens implantation. J Refract Surg. 2014;30(6):394–400. | ||
Goggin M, Zamora-Alejo K, Esterman A, van Zyl L. Adjustment of anterior corneal astigmatism values to incorporate the likely effect of posterior corneal curvature for toric intraocular lens calculation. J Refract Surg. 2015;31(2):98–102. | ||
Abulafia A, Barrett GD, Kleinmann G, et al. Prediction of refractive outcomes with toric intraocular lens implantation. J Cataract Refract Surg. 2015;41(5):936–944. | ||
Savini G, Næser K. An analysis of the factors influencing the residual refractive astigmatism after cataract surgery with toric intraocular lenses. Invest Ophthalmol Vis Sci. 2015;56(2):827–835. | ||
Koch DD, Ali SF, Weikert MP, Shirayama M, Jenkins R, Wang L. Contribution of posterior corneal astigmatism to total corneal astigmatism. J Cataract Refract Surg. 2012;38(12):2080–2087. | ||
Savini G, Versaci F, Vestri G, Ducoli P, Næser K. Influence of posterior corneal astigmatism on total corneal astigmatism in eyes with moderate to high astigmatism. J Cataract Refract Surg. 2014;40(10):1645–1653. | ||
Eom Y, Rhim JW, Kang SY, Kim SW, Song JS, Kim HM. Toric intraocular lens calculations using ratio of anterior to posterior corneal cylinder power. Am J Ophthalmol. 2015;160(4):717–724. | ||
Miyake T, Shimizu K, Kamiya K. Distribution of posterior corneal astigmatism according to axis orientation of anterior corneal astigmatism. PLoS One. 2015;10(1):e0117194. Available from: https://www.ncbi.nlm.nih.gov/pmc/articles/PMC4307987/pdf/pone.0117194.pdf. Accessed September 13, 2016. | ||
Zheng T, Chen Z, Lu Y. Influence factors of estimation errors for total corneal astigmatism using keratometric astigmatism in patients before cataract surgery. J Cataract Refract Surg. 2016;42(1):84–94. | ||
Davison JA, Potvin R. Refractive cylinder outcomes after calculating toric intraocular lens cylinder power using total corneal refractive power. Clin Ophthalmol. 2015;9:1511–1517. | ||
Koch DD, Jenkins RB, Weikert MP, Yeu E, Wang L. Correcting astigmatism with toric intraocular lenses: effect of posterior corneal astigmatism. J Cataract Refract Surg. 2013;39(12):1803–1809. | ||
Reitblat O, Levy A, Kleinmann G, Abulafia A, Assia EI. Effect of posterior corneal astigmatism on power calculation and alignment of toric intraocular lenses: comparison of methodologies. J Cataract Refract Surg. 2016;42(2):217–225. | ||
Hoffmann PC, Abraham M, Hirnschall N, Findl O. Prediction of residual astigmatism after cataract surgery using swept source fourier domain optical coherence tomography. Curr Eye Res. 2014;39(12):1178–1186. | ||
Abulafia A, Hill WE, Franchina M, Barrett GD. Comparison of methods to predict residual astigmatism after intraocular lens implantation. J Refract Surg. 2015;31(10):699–707. | ||
Hill W, Osher R, Cooke D, et al. Simulation of toric intraocular lens results: manual keratometry versus dual-zone automated keratometry from an integrated biometer. J Cataract Refract Surg. 2011;37(12):2181–2187. | ||
Visser N, Bauer NJ, Nuijts RM. Toric intraocular lenses: historical overview, patient selection, IOL calculation, surgical techniques, clinical outcomes, and complications. J Cataract Refract Surg. 2013;39(4):624–637. | ||
Waltz KL, Featherstone K, Tsai L, Trentacost D. Clinical outcomes of TECNIS toric intraocular lens implantation after cataract removal in patients with corneal astigmatism. Ophthalmology. 2015;122(1):39–47. | ||
Epitropoulos AT, Matossian C, Berdy GJ, Malhotra RP, Potvin R. Effect of tear osmolarity on repeatability of keratometry for cataract surgery planning. J Cataract Refract Surg. 2015;41(8):1672–1677. | ||
Koch DD, Wang L. Surgically induced astigmatism. J Refract Surg. 2015;31(8):565. |
 © 2016 The Author(s). This work is published and licensed by Dove Medical Press Limited. The
full terms of this license are available at https://www.dovepress.com/terms
and incorporate the Creative Commons Attribution
- Non Commercial (unported, 3.0) License.
By accessing the work you hereby accept the Terms. Non-commercial uses of the work are permitted
without any further permission from Dove Medical Press Limited, provided the work is properly
attributed. For permission for commercial use of this work, please see paragraphs 4.2 and 5 of our Terms.
© 2016 The Author(s). This work is published and licensed by Dove Medical Press Limited. The
full terms of this license are available at https://www.dovepress.com/terms
and incorporate the Creative Commons Attribution
- Non Commercial (unported, 3.0) License.
By accessing the work you hereby accept the Terms. Non-commercial uses of the work are permitted
without any further permission from Dove Medical Press Limited, provided the work is properly
attributed. For permission for commercial use of this work, please see paragraphs 4.2 and 5 of our Terms.