Back to Journals » Medical Devices: Evidence and Research » Volume 14
Clinical Factors Associated with High Glycemic Variability Defined by Coefficient of Variation in Patients with Type 2 Diabetes
Authors Gómez AM ![]() , Henao-Carillo DC
, Henao-Carillo DC ![]() , Taboada L, Fuentes O, Lucero O, Sanko A, Robledo MA, Muñoz O
, Taboada L, Fuentes O, Lucero O, Sanko A, Robledo MA, Muñoz O ![]() , Rondón M, García-Jaramillo M, León-Vargas F
, Rondón M, García-Jaramillo M, León-Vargas F
Received 18 November 2020
Accepted for publication 20 January 2021
Published 31 March 2021 Volume 2021:14 Pages 97—103
DOI https://doi.org/10.2147/MDER.S288526
Checked for plagiarism Yes
Review by Single anonymous peer review
Peer reviewer comments 3
Editor who approved publication: Dr Scott Fraser
AM Gómez,1– 3 DC Henao-Carillo,1– 3 L Taboada,1,3 O Fuentes,1,3 O Lucero,2,3 A Sanko,3 MA Robledo,3 O Muñoz,2,3 M Rondón,4 M García-Jaramillo,5 F León-Vargas6
1Endocrinology Unit, Hospital Universitario San Ignacio, Bogotá, Colombia; 2Department of Internal Medicine, Hospital Universitario San Ignacio, Bogotá, Colombia; 3Faculty of Medicine, Pontificia Universidad Javeriana, Bogotá, Colombia; 4Department of Clinical Epidemiology, Pontificia Universidad Javeriana, Bogotá, Colombia; 5Faculty of Engineering, Universidad EAN, Bogotá, Colombia; 6Faculty of Engineering, Universidad Antonio Nariño, Bogotá, Colombia
Correspondence: AM Gómez
Endocrinology Unit, Hospital Universitario San Ignacio, Carrera 7 No. 40-62, Bogotá, Colombia
Email [email protected]
Background: High glycemic Variability (HGV) has become a stronger predictor of hypoglycemia. However, clinical factors associate with HGV still are unknown.
Objective: To determine clinical variables that were associated with a coefficient of variation (CV) above 36% evaluated by continuous glucose monitoring (CGM) in a group of patients with diabetes mellitus.
Methods: A cohort of patients with type 2 diabetes (T2D) was evaluated. Demographic variables, HbA1c, glomerular filtration rate (GFR) and treatment regimen were assessed. A bivariate analysis was performed, to evaluate the association between the outcome variable (CV> 36%) and each of the independent variables. A multivariate model was constructed to evaluate associations after controlling for confounding variables.
Results: CGM data from 274 patients were analyzed. CV> 36% was present in 56 patients (20.4%). In the bivariate analysis, demographic and clinical variables were included, such as time since diagnosis, hypoglycemia history, A1c, GFR and treatment established. In the multivariate analysis, GFR < 45 mL/min (OR 2.81; CI 1.27,6.23; p:0.01), A1c > 9% (OR 2.81; CI 1.05,7.51; p:0.04) and hypoglycemia history (OR 2.09; CI 1.02,4.32; p:0.04) were associated with HGV. Treatment with iDPP4 (OR 0.39; CI 0.19,0.82; p:0.01) and AGLP1 (OR 0.08; CI 0.01,0.68; p:0.02) was inversely associated with GV.
Conclusion: Clinical variables such as GFR < 45 mL/min, HbA1C> 9% and a history of hypoglycemia are associated with a high GV. Our data suggest that the use of technology and treatments able to reduce glycemic variability could be useful in this population to reduce the risk of hypoglycemia and to improve glycemic control.
Keywords: glycemic variability, variation coefficient, continuous glucose monitoring, diabetes mellitus
Introduction
Hypoglycemia is the main barrier to achieving glycemic control goals in patients with type 2 diabetes treated with insulin. In previous studies, clinically relevant variables such as mean values of glycemia, diabetes duration, BMI, and GFR did not have a significant association with hypoglycemia.1 However, short-term GV is associated with hypoglycemia <54 mg/dl in patients with type 2 diabetes.1
Glycemic Variability (GV) is defined as the degree of fluctuation in blood glucose values over a given time period. In the short term, these oscillations can be described with intraday variability metrics.2 Currently, the coefficient of variation (%CV) is considered the metric of choice to describe intraday GV. International consensus on CGM recommends classifying values of %CV ≥ 36 as high GV and patients with these values as unstable.3 Additional studies suggest that a value of %CV < 34 is the optimal for minimizing hypoglycemia events <54 mg/dL.1,2,4
The association between high GV and the risk of hypoglycemia has been established, however, there are few studies in the literature that evaluate the clinical variables associated with the presence of high GV. The objective of this work is to determine which clinical variables are associated with the presence of a high GV (%CV coefficient ≥36%) in a large group of patients with type 2 diabetes, evaluated with 6-day continuous glucose monitoring (GCM).
Methods
This study is a cross-sectional analysis of the registry of adults with type 2 diabetes mellitus who were monitored with CGM at the Diabetes Clinic of the San Ignacio University Hospital, Bogotá, Colombia, between July 2012 and October 2019. The registry unifies pre-existing1,5 and new databases. Patients over 18 years, with a diagnosis of type 2 diabetes, in management with insulins, oral antidiabetics or a combination of these, were included. Pregnant patients, those with chronic kidney disease on dialysis therapy, and those receiving management with insulin pump, were excluded. All patients provided informed consent. Protocols were conducted in accordance with the Declaration of Helsinki and were approved by the Research and institutional Ethics committee of the Hospital Universitario San Ignacio.
Clinical characteristics and laboratory variables of each patient were taken from systematically collected medical records. HbA1c was measured at admission, using HPLC. All the patients underwent continuous glucose monitoring with the iPro2 equipment (Medtronic, Minneapolis, MN, USA). An Enlite sensor (Medtronic, Minneapolis, MN, USA) was inserted subcutaneously into the anterior abdomen area and was maintained for 6 days. Instructions were given for equipment calibration following the manufacturer’s recommendations. At the end of day 6, the equipment was removed, and the information was downloaded using the iPRO CareLink version 3.0 software.
Hypoglycemia unawareness was defined as a Clarke score >4.6 Hypoglycemia history was defined as one or more self-monitoring blood glucose (SMBG) less than 70 mg/dl in the last 6 months. The coefficient of variation was calculated as standard deviation/average glucose x 100%.7,8 Patients with CV% ≥36% were classified in the high glycemic variability group.7,8 HbA1c measured by high-performance liquid chromatography (HPLC) was reported in categories <7%, 7–9% and >9%. Glomerular filtration rate (GFR) was present as >45 and <45 mL/min. Polypharmacy was defined as ≥5 medications including diabetes treatment.
The description of clinical variables was performed according to the value of the coefficient of variation (<36% and ≥36%). A bivariate analysis was performed, to evaluate the association between the outcome variable (CV> 36%) and each of the independent variables, such as gender, body mass index (BMI) classification, duration of diabetes, polypharmacy, hypoglycemia history, glomerular filtration rate (GFR) <45 mL/min, micro and macrovascular complications and treatment. Finally, we performed multivariate models that initially included essential covariates as age, sex and diabetes duration, and additionally all the significant variables detected in the bivariate analysis. Through the backward strategy, the variables that were not statistically significant were eliminated one by one, and the best-reduced model was selected through goodness-of-fit tests, such as AIC and BIC. For all analyses, 95% confidence intervals were calculated, and a p-value less than 0.05 was considered to be statistically significant. STATA 15 software was used for analysis.
Results
Two hundred and seventy-four patients were included in the analysis. The mean age was 67.7 years and the proportion of patients according to gender was similar. Most of the patients received insulin treatment, the bolus basal regimen was the most frequently used insulin regimen. The most widely used oral antidiabetic agent (OAD) were Metformin and DPP4 inhibitors. 20.4% of patients had %CV ≥36. The clinical characteristics of patients according to %CV values and use of insulin are presented in Table 1.
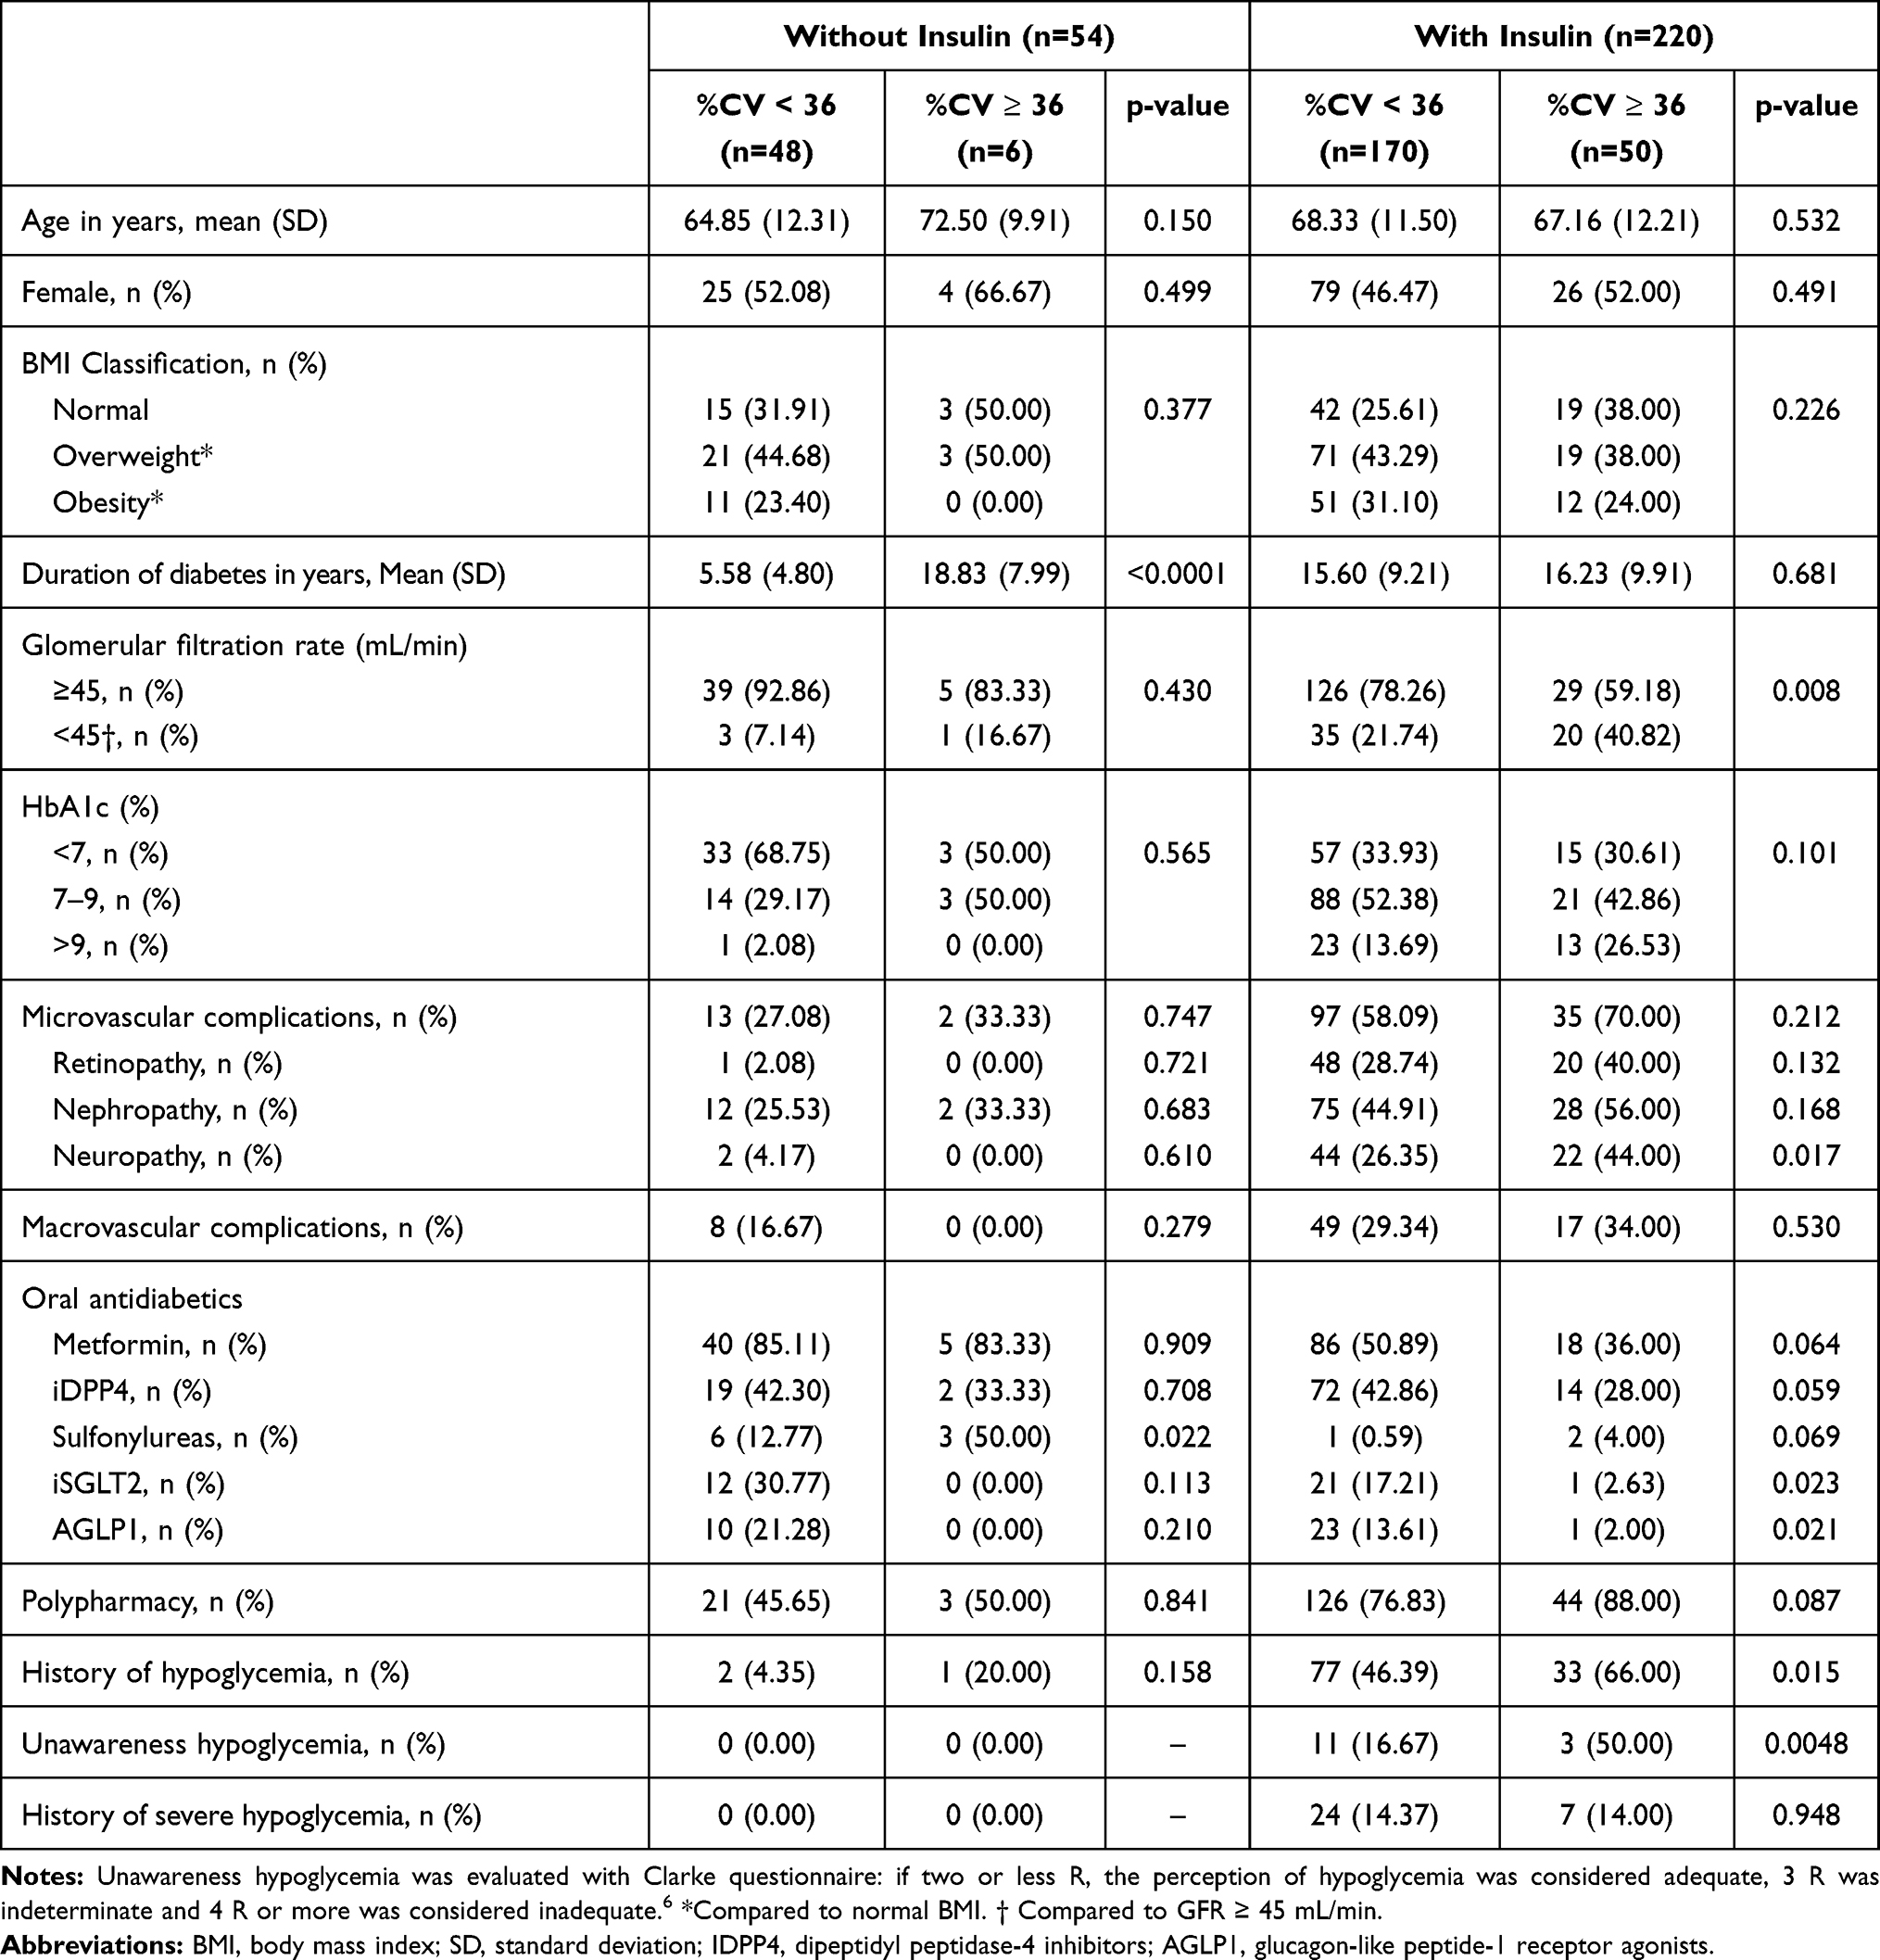 |
Table 1 Characteristics of Patients According to Glycemic Variability (%CV) and Use of Insulin |
The duration of diabetes was longer in patients with high GV (13.4 ± 9.4 vs 16.5 ± 9.7 years, p =0.029). More microvascular complications were detected in patients with high GV. Almost twice as many patients in this group had a GFR < 45 mL/min (18.7% vs 37.5%, p 0.002). Only sulfonylureas tended to be associated with a high GV, the other OAD were used more frequently in the group of patients with %CV < 36. The hypoglycemia history, mainly due to asymptomatic hypoglycemia, was more frequent in the high GV group. Time in range (TIR) was better in the group with CV% <36% (80.6±20.6% vs 61.0±12.3%). The number of hypoglycemia events 1.4±2.4 in the group with low glycemic variability vs 4.42±3.5 events in the group with high variability.
Table 2 shows the bivariate analysis for the association between GV and clinical variables. Hypoglycemia history (OR 2.73; 95% CI 1.47,5.02; p= 0.001), poor glycemic control with A1c >9.0% 3.20 (OR 2.71; 95% CI 1.17,6.29; p= 0.021), polypharmacy ≥5 medications (OR 2.22; 95% CI 1.02,4.81; p= 0.042), and GFR <45 mL/min (OR 2.69; 95% CI 1.41,5.15; p= 0.003) were significantly associated with high GV. Treatment with metformin and AGLP1 was found as a protective factor. We did not find any difference in the analysis using a cut-point of CV <34%.
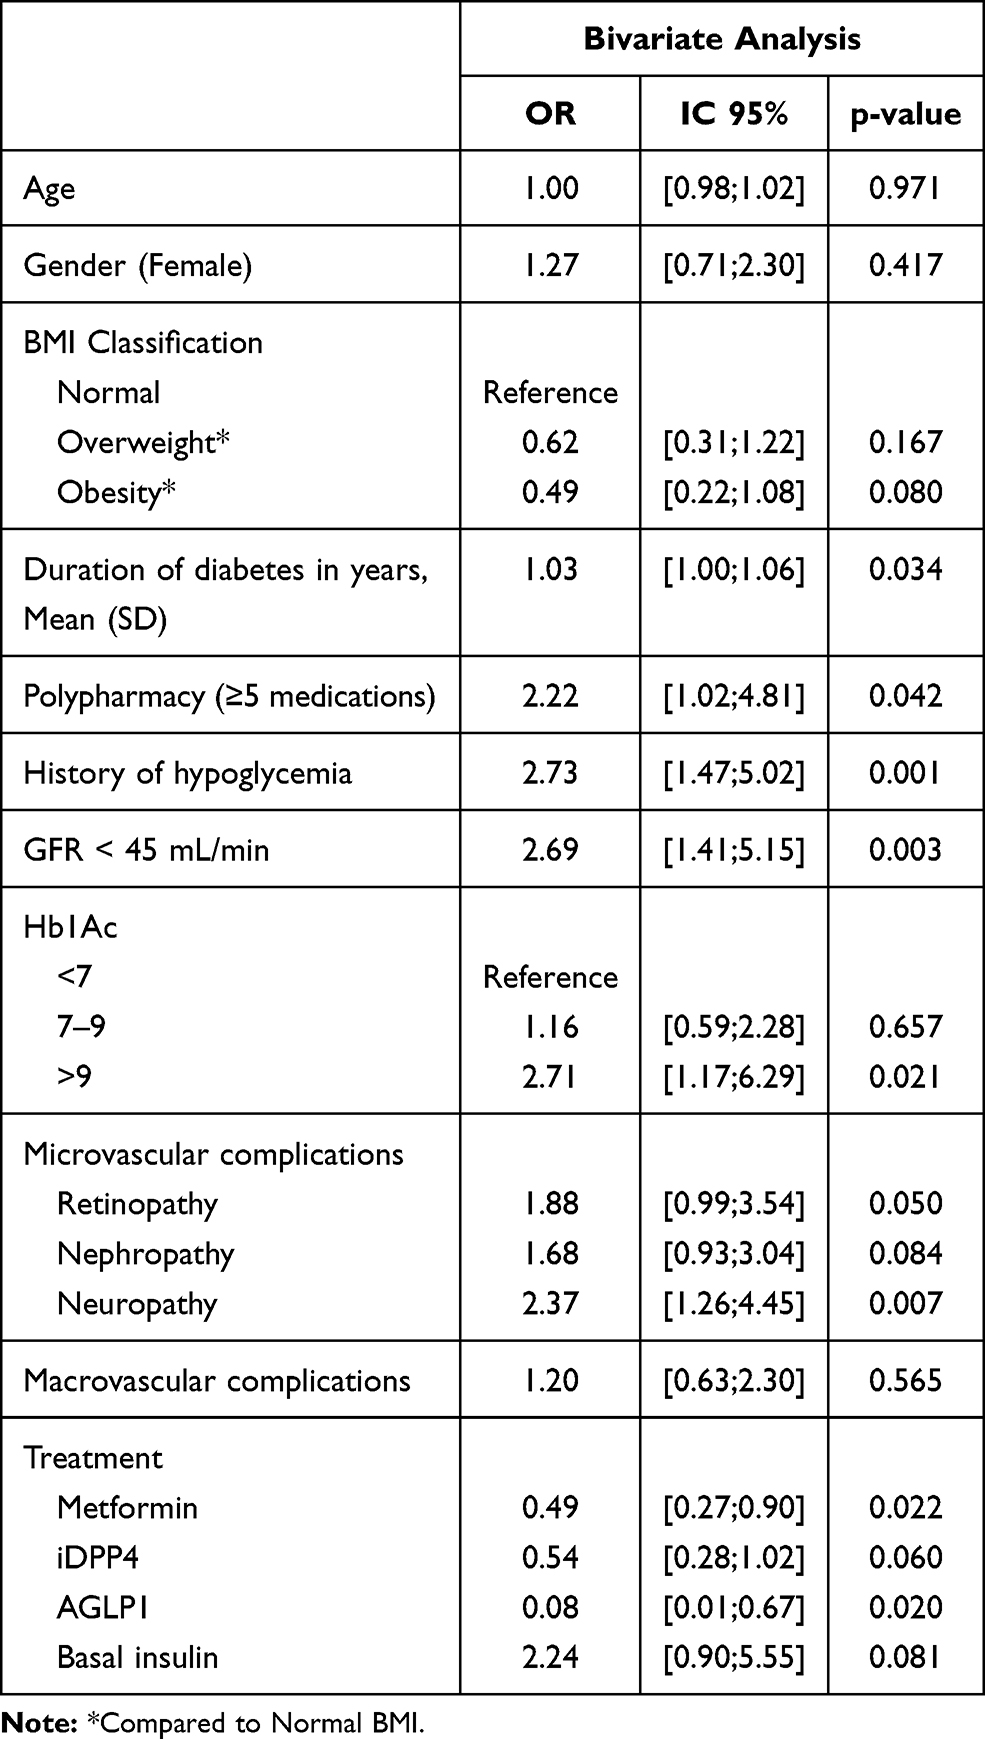 |
Table 2 Association Between Glycemic Variability and Clinical Variables in Patients with Type 2 Diabetes. Bivariate Analysis |
The first multivariate models (Model A) HbA1c and GFR were analyzed as continuous variables. In the second model (Model B), these variables were analyzed as categorical (Table 3). In the model B we found association between a high GV and HbA1c >9% (OR 2.81; 95% CI 1.05,7.51; p= 0.038), CKD with a GFR <45 mL/min (OR 2.81; 95% CI 1.27,6.23; p= 0.011). The association between hypoglycemia history and CV% ≥36% was found in both models A and B. Treatment with Dipeptidyl peptidase-4 inhibitor (iDPP4) and Glucagon-like peptide-1 receptor agonist (GLP-1) were inversely related with GV. We did not find differences using a cut-point of CV <34%.
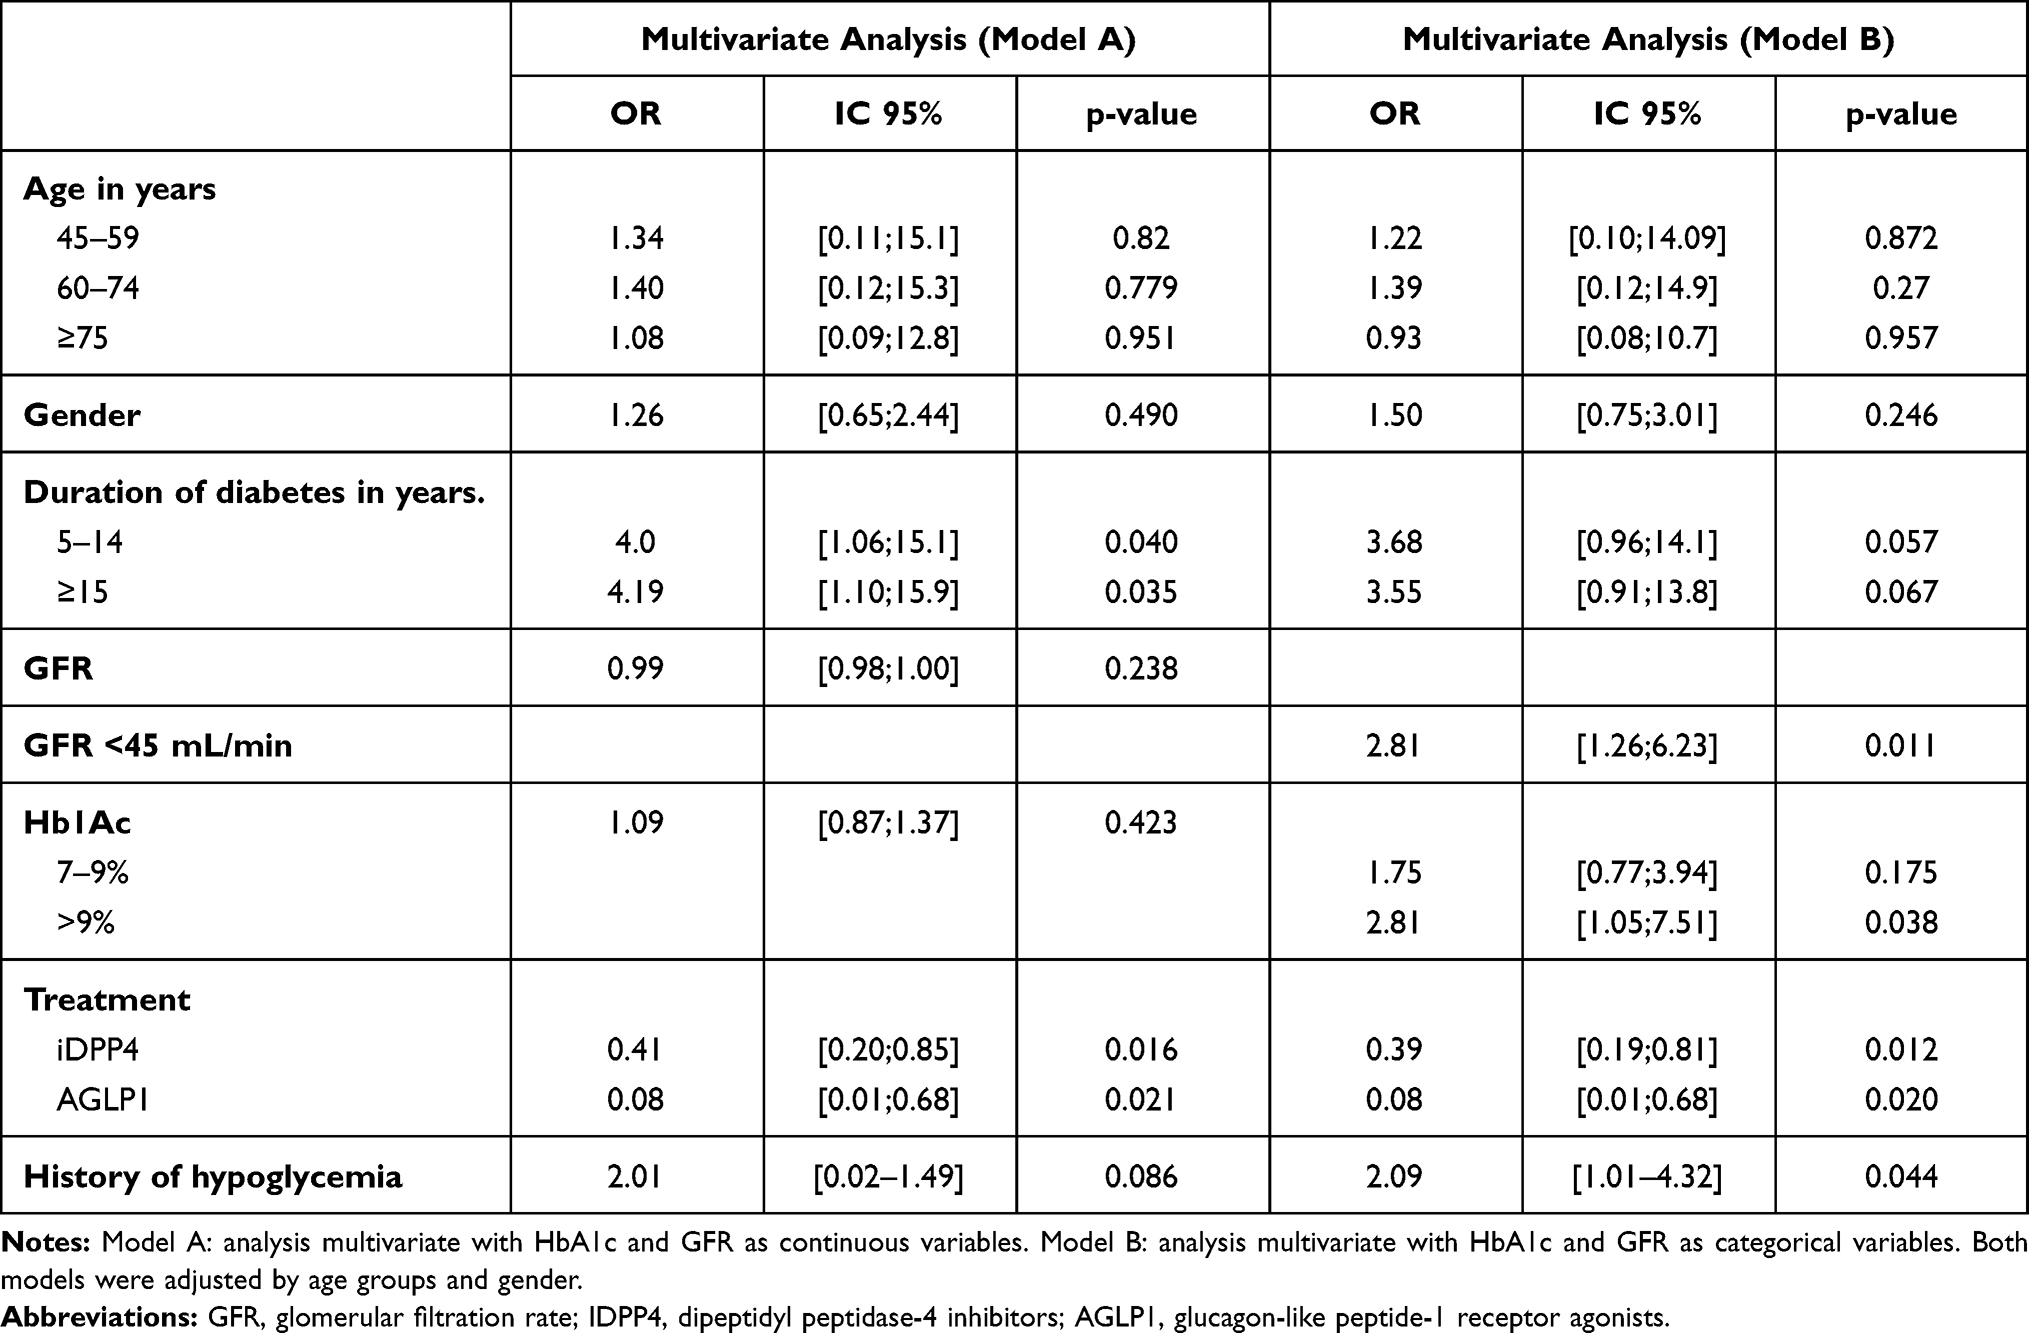 |
Table 3 Association Between Glycemic Variability and Clinical Variables in Patients with Type 2 Diabetes. Multivariate Analysis |
Discussion
Glucose variability and hypoglycemia cause oxidative stress, induce endothelial dysfunction, and promote arteriosclerosis.9,10 High GV measured by the coefficient of variation (≥36%) has been independently associated with the presence of level 1 and 2 hypoglycemia in patients with type 1 and type 2 diabetes.1,2,4 Previously, we presented a paper that shows that CV can be recommended as the preferred parameter of GV to be used in clinical practice for T2DM patients. It was compared against, standard deviation, coefficient of variation (CV), interquartile range, CONGA1, 2, and 4, MAGE, M value, J index, high blood glucose index, and low blood glucose index (LBGI).1 However, clinical variables associated with this definition of high GV have not been determined. Knowing the clinical factors related to% CV ≥36 could help identify those patients who benefit from performing GCM and, in those in whom unstable diabetes is detected, establish therapeutic options to reduce fluctuations in glucose levels, thus reducing the risk of hypoglycemia.
In our study, clinical factors, such as GFR below 45 mL/min, HbA1c >9% and hypoglycemia history, were significantly associated with the presence of high GV in patients with type 2 diabetes. Studies reported prior to the publication of the 2019 consensus,11 reported similar findings,12 including a positive correlation between HbA1c, C-peptide levels and the duration of insulin therapy with high GV, defined by SD.13,14 It is possible that chronic kidney disease is a contributing factor to high variability by promoting hypoglycemia due to the decrease in the clearance of insulin with a prolongation of its half-life and due to the alteration in renal gluconeogenesis.15
An interesting finding in our study was the tendency to a lower coefficient of variation in obese patients compared to those with normal BMI. A similar finding was described in a cross-sectional study in patients with type 2 diabetes: a negative correlation between BMI and glycemic variability defined by mean amplitude of glycemic excursions (MAGE).16 It has been found that higher levels of C-peptide are present in obese patients.17 C-peptide values are negatively correlated with glycemic variability indices, suggesting that insulinopenia is a determinant of GV.13 Other surrogates for beta-cell function, such as HOMA-β, are lower in patients with low or normal BMI compared to overweight and obese patients, suggesting a lower beta-cell functionality in this group of patients.16
We found that treatment with iDPP4 and AGLP-1 is associated with less glycemic variability in our real-life population. This finding is consistent with data from controlled clinical trials in patients with T2D, such as FLAT-SUGAR and AWARD-4, treated with exenatide and dulaglutide, respectively.18,19 They found a significant reduction in GV in the group treated with GLP1 analogues compared to basal-bolus insulin regimen.20 Additionally, DUAL I reported that reduction in plasma glucose fluctuations was higher in those with the insulin degludec and liraglutide combination, compared to these components separately.20 VARIATION study, a prospective cohort of patients with T2D and good glycemic control, compared basal insulin in combination with one or more OAD (excluding glyburide), GLP-1 RA [exenatide or liraglutide] or basal-bolus insulin regimen. The combination with GLP1 had a lower GV compared with other combinations.21
Similar to our results, the MDI Liraglutide trial22 found that reductions in mean glucose levels and standard deviation estimated by masked continuous glucose monitoring were significantly greater in the liraglutide group than in the placebo group (−1.9 and −0.5 mmol/L (−34.2 and −9 mg/dL), respectively; P<0.001). The study of Lind et al23 showed that liraglutide treatment lowers glucose levels and reduces time in hypoglycemia in T2DM patients treated with MDI. Also, during liraglutide treatment, TIR increased with a reduction of TAR. This study showed that patients with lower fasting C-peptide levels and higher glycemic variability had a greater risk of hypoglycemia during MDI treatment with or without simultaneous liraglutide treatment.
To our knowledge, this is the largest study evaluating the association between clinical variables and high GV measured by 6-day GCM, and the first to use consensus definitions of high GV (% CV≥36%).3 Our data correspond to real-life conditions, since the patients continued receiving their usual treatment, without restrictions on diet, physical activity, or hours of administration of medications. The main limitation is that our design does not allow confirming the causal relationships, since GV and clinical factors are measured simultaneously. However, previous prospective trials are consistent with our findings. An additional limitation is that modifiable sources of GV such as exercise, insulin doses according to carbohydrates, hypoglycemic or hyperglycemic overcorrections could not be objectified. Additionally, an important limitation is that we did not measure C-peptide levels to evaluate insulin secretory capacity, as this study was a cross-sectional analysis of the registry of adults with type 2 diabetes mellitus who were monitored with CGM.
Conclusion
The determination of clinical variables, such as GFR <45 mL/min, HbA1C >9% and hypoglycemia history, was associated with a high GV. Our data suggest that the use of technology and treatments able to reduce glycemic variability could be useful in this population to reduce the risk of hypoglycemia and to improve glycemic control. Prospective studies designed to establish variables that can constitute risk factors for short-term glycemic variability, defined in a standardized way, are needed.
Disclosure
Dr Ana Maria Gomez reports personal fees from Novo Nordisk, Elli Lilly, Abbott, Medtronic, and Boehringer Ingelheim, outside the submitted work. Dr Diana Cristina Henao Carrillo reports personal fees from Novo Nordisk, Abbott Diabetes, and Medtronic, outside the submitted work. Dr Lucia B Taboada reports personal fees from Medtronic, outside the submitted work. The author reports no other potential conflicts of interest in this work.
The abstract of this paper was presented at the American Diabetes Association 80th scientific sessions 2020 as a poster presentation with interim findings. The poster was presented at the “Poster session” with tracking number 2020-A-4621-Diabetes.
References
1. Gómez AM, Muñoz OM, Marin A, et al. Different Indexes of glycemic variability as identifiers of patients with risk of hypoglycemia in Type 2 diabetes mellitus. J Diabetes Sci Technol. 2018;12(5):1007–1015. doi:10.1177/1932296818758105
2. Monnier L, Wojtusciszyn A, Molinari N, Colette C, Renard E, Owens D. Respective contributions of glycemic variability and mean daily glucose as predictors of hypoglycemia in Type 1 diabetes: are they equivalent? Diabetes Care. 2020;43(4):821–827.
3. Danne T, Nimri R, Battelino T, et al. International consensus on use of continuous glucose monitoring. Diabetes Care. 2017;40(12):1631–1640.
4. Gómez AM, Henao DC, Imitola Madero A, et al. Defining high glycemic variability in type 1 diabetes: comparison of multiple indexes to identify patients at risk of hypoglycemia. Diabetes Technol Ther. 2019;21(8):430–439.
5. Henao-Carrillo DC, Muñoz OM, Gómez AM, et al. Reduction of glycemic variability with Degludec insulin in patients with unstable diabetes. J Clin Transl Endocrinol. 2018;12(April):8–12.
6. Jansa M, Quirós C, Giménez M, Vidal M, Galindo M, Conget I. Análisis psicométrico de las versiones en lengua castellana y catalana de un cuestionario de percepción de la hipoglucemia. Med Clin (Barc). 2015;144(10):440–444.
7. Battelino T, Danne T, Bergenstal RM, et al. Clinical Targets for continuous glucose monitoring data interpretation: recommendations from the international consensus on time in range. Diabetes Care. 2019;42(8):1593–1603.
8. 6. Glycemic Targets: standards of Medical Care in Diabetes-2021. Diabetes Care. 2021;44(Suppl1):S73–84.
9. Ohara M, Fukui T, Ouchi M, et al. Relationship between daily and day-to-day glycemic variability and increased oxidative stress in type 2 diabetes. Diabetes Res Clin Pract. 2016;122:62–70.
10. Ceriello A, Novials A, Ortega E, et al. Evidence that hyperglycemia after recovery from hypoglycemia worsens endothelial function and increases oxidative stress and inflammation in healthy control subjects and subjects with type 1 diabetes. Diabetes. 2012;61(11):2993–2997. doi:10.2337/db12-0224
11. Battelino T, Danne T, Bergenstal RM, et al. Clinical Targets for continuous glucose monitoring data interpretation: recommendations from the international consensus on time in range. Diabetes Care. 2019;42(8):1593–1603. doi:10.2337/dci1-0028
12. Monnier L, Colette C, Wojtusciszyn A, et al. Toward defining the threshold between low and high glucose variability in diabetes. Diabetes Care. 2016;dc161769.
13. Jin S-M, Kim T-H, Bae JC, et al. Clinical factors associated with absolute and relative measures of glycemic variability determined by continuous glucose monitoring: an analysis of 480 subjects. Diabetes Res Clin Pract. 2014;104(2):266–272.
14. Greven WL, Beulens JWJ, Biesma DH, Faiz S, de Valk HW. Glycemic variability in inadequately controlled type 1 diabetes and type 2 diabetes on intensive insulin therapy: a cross-sectional, observational study. Diabetes Technol Ther. 2010;12(9):695–699.
15. Hahr AJ, Molitch ME. Management of diabetes mellitus in patients with chronic kidney disease. Clin Diabetes Endocrinol. 2015;1:2.
16. Wang J, Yan R, Wen J, et al. Association of lower body mass index with increased glycemic variability in patients with newly diagnosed type 2 diabetes: a cross-sectional study in China. Oncotarget. 2017;8(42):73133–73143.
17. Chan WB, Tong PCY, Chow CC, et al. The associations of body mass index, C-peptide and metabolic status in Chinese Type 2 diabetic patients. Diabet Med. 2004;21(4):349–353.
18. Glucose Variability in a 26-week randomized comparison of mealtime treatment with rapid-acting insulin versus GLP-1 agonist in participants with type 2 diabetes at high cardiovascular risk. Diabetes Care. 2016;39(6):973–981.
19. Blonde L, Jendle J, Gross J, et al. Once-weekly dulaglutide versus bedtime insulin glargine, both in combination with prandial insulin lispro, in patients with type 2 diabetes (AWARD-4): a randomised, open-label, Phase 3, non-inferiority study. Lancet (London, England). 2015;385(9982):2057–2066.
20. Del Olmo García MI, Merino-Torres JF. GLP 1 receptor agonists, glycemic variability, oxidative stress and acute coronary syndrome. Med Hypotheses. 2020;136:109504.
21. Bajaj HS, Venn K, Ye C, et al. Lowest glucose variability and hypoglycemia are observed with the combination of a GLP-1 receptor agonist and basal insulin (VARIATION Study). Diabetes Care. 2017;40(2):194–200.
22. Sofizadeh S, Imberg H, Ólafsdóttir AF, et al. Effect of Liraglutide on times in glycaemic ranges as assessed by CGM for Type 2 Diabetes patients treated with multiple daily insulin injections. Diabetes Ther Res Treat Educ Diabetes Relat Disord. 2019;10(6):2115–2130.
23. Lind M, Hirsch IB, Tuomilehto J, et al. Liraglutide in people treated for type 2 diabetes with multiple daily insulin injections: randomised clinical trial (MDI Liraglutide trial). BMJ. 2015;351:h5364.
 © 2021 The Author(s). This work is published and licensed by Dove Medical Press Limited. The
full terms of this license are available at https://www.dovepress.com/terms
and incorporate the Creative Commons Attribution
- Non Commercial (unported, 3.0) License.
By accessing the work you hereby accept the Terms. Non-commercial uses of the work are permitted
without any further permission from Dove Medical Press Limited, provided the work is properly
attributed. For permission for commercial use of this work, please see paragraphs 4.2 and 5 of our Terms.
© 2021 The Author(s). This work is published and licensed by Dove Medical Press Limited. The
full terms of this license are available at https://www.dovepress.com/terms
and incorporate the Creative Commons Attribution
- Non Commercial (unported, 3.0) License.
By accessing the work you hereby accept the Terms. Non-commercial uses of the work are permitted
without any further permission from Dove Medical Press Limited, provided the work is properly
attributed. For permission for commercial use of this work, please see paragraphs 4.2 and 5 of our Terms.