Back to Journals » Diabetes, Metabolic Syndrome and Obesity » Volume 12
Clinic, Anthropometric And Metabolic Changes In Adults With Class III Obesity Classified As Metabolically Healthy And Metabolically Unhealthy
Authors Loureiro LM ![]() , Cordeiro A, Mendes R
, Cordeiro A, Mendes R ![]() , Luna M
, Luna M ![]() , Pereira S
, Pereira S ![]() , Saboya CJ
, Saboya CJ ![]() , Ramalho A
, Ramalho A
Received 30 March 2019
Accepted for publication 30 August 2019
Published 27 November 2019 Volume 2019:12 Pages 2419—2431
DOI https://doi.org/10.2147/DMSO.S210616
Checked for plagiarism Yes
Review by Single anonymous peer review
Peer reviewer comments 2
Editor who approved publication: Professor Ming-Hui Zou
Ligiane M Loureiro,1–3 Adryana Cordeiro,3,4 Rodrigo Mendes,5 Mariana Luna,3 Sílvia Pereira,3,6 Carlos J Saboya,3,6 Andrea Ramalho3,7
1Postgraduate Program, Doctorate in Nutritional Sciences, Federal University of Rio de Janeiro (UFRJ), Rio de Janeiro, Brazil; 2Health Sciences Institute, Faculty of Nutrition, Federal University of Pará (UFPA), Belém, Brazil; 3Center for Research on Micronutrients (NPqM), Institute of Nutrition Josué de Castro of UFRJ, Rio de Janeiro, Brazil; 4Biomedicine Department, Biochemistry Unit, Faculty of Medicine, University of Porto, Porto, Portugal; 5Pontifical Catholic University of Rio de Janeiro, Rio de Janeiro, Brazil; 6Multidisciplinary Center for Bariatric and Metabolic Surgery, Rio de Janeiro, Brazil; 7Department of Social and Applied Nutrition of the Institute of Nutrition, UFRJ, Rio de Janeiro, Brazil
Correspondence: Adryana Cordeiro
University of Porto, Alameda Prof. Hernâni Monteiro, Porto 4200-319, Portugal
Tel +55-091-98171-5886
Fax +351 22 551 3600
Email [email protected]
Ligiane M Loureiro
Federal University of Rio de Janeiro, Av. Carlos Chagas Filho, 373, Cidade Universitária, Rio de Janeiro, RJ, Brazil
Tel +55-091-98171-5886
Email [email protected]
Purpose: To describe clinical, biochemical and anthropometric profiles in adults with class III obesity classified as metabolically healthy obesity (MHO) and metabolically unhealthy obesity (MUHO).
Patients and methods: This is a cross-sectional study with patients classified as MHO and MUHO according to the NCEP-ATP III. Anthropometric, biochemical and clinical variables were analyzed.
Results: A total of 223 subjects were evaluated and 32.73% were classified as MHO and 67.26% as MUHO, respectively. The insulin resistance homeostasis model (HOMA-IR) showed elevation in the MUHO group (p=0.003) and anthropometric variables were correlated with bone markers [body index mass (BMI) vs phosphorus: r=0.31, p<0.001; BMI vs 25(OH)D: r=−0.31, p=0.041]. Visceral adiposity index was lower in MHO (p=0.001). Negative correlations between inflammatory markers and bone markers were observed in the MHO group (calcium vs C-reactive protein: −0.30, p=0.017; parathyroid hormone vs HOMA-IR: r=−0.28, p=0.017.
Conclusion: MHO individuals showed important metabolic changes, such as those observed in MUHO, despite lower prevalence and severity. Continuous monitoring of these individuals is suggested, given the transient nature of the MHO phenotype.
Keywords: obese, phenotype, bone markers, inflammatory markers
Introduction
The prevalence of overweight and obesity continues to exponentially increase worldwide1 and class III obesity has become the most prominent metabolic disorder over the last years.2 It is well established that excess body fat increases the risk of metabolic disorders (abdominal adiposity, dyslipidemia, hyperglycemia, systemic hypertension, insulin resistance) and increased inflammatory state3 and the risk of cardiometabolic disorders,4 in addition to other comorbidities, such as those related to impairment of hepatic5 and bone6 metabolism, common among individuals with severe obesity.7–10 Many metabolic disorders observed in class III obesity are favored by the inflammatory profile of obesity11 and by nutritional deficits,12,13 in addition to hormonal, metabolic and enzymatic changes14–21 to which these individuals are exposed. However, risks related to obesity may vary depending on whether the individual presents a metabolically healthy obesity (MHO) or a metabolically unhealthy obesity (MUHO).22 The existence of the MHO phenotype has become increasingly recognized, and its prevalence varies significantly in the literature, from 10 to 40% in the adult population,23 although some studies are still contradictory about this topic.24 Since MHO is considered the paradox of obesity, it has been massively investigated in relation with several chronic non-communicable diseases (NCDs)25–27 and risk of death26,28 a few years ago. Although having excess body fat, MHO individuals show a metabolic profile less compromised than MUHO individuals.29
However, many other questions remain unclear about the definitions, determinants and stability of this phenotype which may be of a transient nature.30 The lack of harmonization in the criteria for defining MHO plays an important role in the discrepancies observed among the available studies.31 Nonetheless, the healthy condition of the MHO phenotype has been widely debated, and studies have reported controversial and conflicting results.26 Moreover, it is unclear whether the “metabolically healthy” obese phenotype has a low risk for alteration of some metabolic markers, mainly related to inflammation, bone and hepatic metabolism. Our study is the first to investigate a set of clinical and biochemical variables and correlate them with obesity phenotypes in individuals with severe obesity. There is a shortage of studies, as far as we know, to evaluate this type of association.
Considering that studies on the characterization of the clinical, biochemical and anthropometric profiles of class III obesity individuals which include the MHO phenotype are insufficient, and that most of the available studies only investigated other obesity classes,16,32–34 further research is needed to investigate the different profiles of obesity phenotypes, especially in its more severe stages. Therefore, the aim of this study was to describe the difference between clinical, anthropometric and biochemical profiles in adults with class III obesity classified by both phenotypes, in order to identify possible differences that may support more assertive intervention strategies for those individuals in clinical practice, aiming to minimize the worsening of metabolic changes, given the transitional nature of the MHO phenotype.
Materials And Methods
Study Design And Population
This is a descriptive, cross-sectional study with a convenience sample including adults with class III obesity,35 attended at the Multidisciplinary Center for Bariatric and Metabolic Surgery (MCBMS) in Rio de Janeiro – RJ, Brazil. Data collection occurred from November 2014 to July 2016.
Adults of both genders were included, mean age ≥20 and <60 years and body mass index (BMI) ≥40 kg/m2 (diagnosed with class III obesity). Exclusion criteria were as follows: pregnancy or lactation, history and/or presence of chronic kidney diseases (defined by estimated glomerular filtration rate (GFR) <60 mL/min/1.73m2),36 liver diseases (except non-alcoholic fatty liver disease (NAFLD)), acute or chronic infections, elevated serum calcium levels, irritable bowel syndrome, previous restrictive and disabsorptive surgeries, neoplasias, diagnosis of endocrinopathies (hyperparathyroidism, hypothyroidism, hypercortisolemia), alcohol intake exceeding 20g/day for women and 40g/day for men, use of multivitamin and mineral supplements. This study was approved by the Research Ethics Committee of Hospital Universitário Clementino Fraga Filho (HUCFF) of the Universidade Federal do Rio de Janeiro (UFRJ) (Federal University of Rio de Janeiro) under Scientific Advice in accordance with Resolution nº 196 of the National Health Council (Research Protocol number 011/06-CEP) and the Declaration of Helsinki. Inclusion of patients in the project was carried out through their formal authorization with the signing of the Informed Consent Form in two copies that were printed and delivered to each patient on the day of data collection.
Definition Of The Obesity Phenotypes: MHO And MUHO
For classification of the obesity phenotypes, the criterion used was proposed by the Third Report of the National Cholesterol Education Program Expert Panel on Detection, Evaluation, and Treatment of High Blood Cholesterol in Adults (NCEP-ATP III).37 The subjects who had changes in ≥3 of the following 5 criteria were considered metabolically unhealthy obese (MUHO): 1) waist circumference (WC) >102cm for men and >88cm for women; 2) fasting glucose ≥100 mg/dL; 3) fasting triglycerides ≥150 mg/dL; 4) high density lipoprotein (HDL) <40mg/dL for men and <50mg/dL for women; and 5) blood pressure ≥130/≥85 mmHg. The metabolically healthy obese (MHO) phenotype was defined as obesity without metabolic syndrome (ie BMI ≥40 kg/m2 and presence of 2 components of metabolic syndrome).
Assessment Of Body Variables And Physical Activity
Height (using a Sany stadiometer) and weight (using a Welmy electronic platform scale with maximum weighing capacity of 300 kg) were measured with the participants standing without shoes and heavy outer garments. BMI was calculated as weight divided by height squared (kg/m2), according to the World Health Organization (WHO).35 Waist circumference (WC) was measured based on Lohman et al.38 with cutoff points according to the NCEP-ATP III.37 The measurement of the diameter (cm) of the waist circumference (WC) was performed with the patient standing straight, abdomen relaxed, arms beside the body and feet together without heavy outer garments and with emptied pockets, breathing out gently. To complement the nutritional diagnosis of individuals with obesity, one body indicator was selected, the visceral adiposity index (VAI), which is an empirical mathematical model, gender-specific, based on simple anthropometric data (BMI and WC) and biochemical parameters (TG, LDL-c and HDL-c), indicative of fat distribution and function, and was calculated according to Amato.39 All measurements were performed in duplicate by a single trained observer and variations up to 0.5 cm were accepted and mean was calculated. Physical activity was evaluated through the International Physical Activity Questionnaire (IPAQ) in its short version.40
Clinical Assessments
The clinical variables considered by the study were those determined from the frequencies of non-alcoholic fatty liver disease (NAFLD) and systemic hypertension (SH). Data on NAFLD and SH were obtained through the medical records of the patients. The diagnosis of NAFLD was determined by a complete abdominal ultrasound (CAU), conducted by a single physician with expertise on imaging diagnosis, following the methodology proposed by Pratt & Kaplan41 using a unit C display, Philips® 2–5 MHz Convex transducer (Barueri, São Paulo, Brazil). SH was diagnosed by a professional expert, following the methodology proposed by the VII Brazilian Guidelines of Systemic Hypertension (SOCIEDADE BRASILEIRA DE CARDIOLOGIA – SBC, 2016).42
Evaluation Of Circulating Biochemical And Metabolic Parameters
For biochemical and metabolic evaluation, a total of 5 mL blood sample was obtained via venipuncture after 12 hrs of fasting for biochemical evaluations to determine glucose and basal insulin, lipid profile and inflammatory profile. The overall analyses were performed in laboratory with certifications, in partnership with the Center for Research in Micronutrients of the Institute of Nutrition of the UFRJ and the MCBMS.
Laboratory tests were conducted in the serum to characterize lipid profile (total cholesterol, low-density lipoprotein cholesterol (LDL-c), high-density lipoprotein cholesterol (HDL-c) and triglycerides), to evaluate glucose, insulin, high sensitivity and the inflammatory profile of the sample.
The serum concentrations of total cholesterol and triglycerides were analyzed by the enzymatic colorimetric method (Labtest Diagnóstica S.A., Minas Gerais, Brazil), and the Low-Density Lipoprotein Cholesterol (LDL-c) and High-Density Lipoprotein Cholesterol (HDL-c) fractions were obtained by the selective inhibition method. LDL-c fraction was calculated in accordance with the Friedewald’s formula.43 Blood glucose was obtained by the enzymatic colorimetric method (Labtest Diagnóstica S.A., Minas Gerais, Brazil). Basal insulin was quantified by reversed-phase high-performance liquid chromatography (RP-HPLC) and the cutoff point adopted was 24.9 IU/mL. The cutoff points for total cholesterol and fractions, triglycerides and fasting glucose were those established by the NCEP-ATP III criteria.37
The evaluation of the inflammatory markers of the subjects included: insulin resistance (IR), serum c-reactive protein (CRP) and leptin levels. Insulin resistance was estimated by the formula of the homeostasis model assessment of insulin resistance (HOMA-IR) as follows: fasting insulin (µIU/mL) vs fasting glucose (mg/dL)/405,44 with ≥2.5 cutoff point.45
High-sensitivity C-reactive protein (hs-CRP) was quantified by the nephelometric method and the cutoff point to determine inflammation was >0.3 mg/dL,46 analyzed using the Tina-quant® C-reactive protein latex ultrasensitive assay (Roche Diagnostics GmbH, Mannheim, Germany). Leptin measurement was quantified using commercially available ultrasensitive ELISA kits according to the manufacturer’s recommendations (Abcam, Cambridge, MA, USA).
The bone metabolism markers selected for the study were parathyroid hormone, alkaline phosphatase, 25(OH)D, calcium and phosphorus. Parathyroid hormone (PTH) was analyzed by the immunoenzymatic method by chemiluminescence47 and serum alkaline phosphatase (AP) by the kinetic colorimetric enzymatic method,48 both with cutoff points for inadequacy >53.0 pg/mL (secondary hyperparathyroidism) and <130.0 U/L, respectively. The serum concentration of 25(OH)D was quantified by high-performance liquid chromatography-ultraviolet detection method (HPLC-UV) (Labtest Diagnóstica S.A., Lagoa Santa, Minas Gerais, Brazil). The nutritional status of vitamin D was analyzed by the quantification of the serum concentrations of 25(OH)D, and cutoff points were ≤20 ng/mL (deficiency), ≥20 ng/mL and <29 ng/mL (insufficiency), and ≥30 ng/mL and <100 ng/mL (adequacy).49 For complementing vitamin D evaluation, a study on the sun exposure of the participants was carried out by the application of a protocol validated by Hanwell et al.50 Phosphorus was the serum mineral quantified by the calorimetric method, with the cutoff points, respectively, for inadequacy <2.5 mg/dL.51 The nutritional status of calcium was determined by quantification of serum concentrations of ionic calcium by direct dosage by selective electrode, and the cutoff point for inadequacy was <4mg/dL.52
Statistical Analysis
Statistical analyses were performed using the Statistical Package for the Social Sciences (SPSS)53 for Windows version 21.0, IBM Corporation (Armonk, NY, USA). To verify the normality of the sample, the Kolmogorov–Smirnov test was performed. Continuous variables were expressed as mean and standard deviation (SD). Clinical, biochemical, anthropometric parameters, bone metabolism and inflammatory markers, calculated according to the MHO and MUHO phenotypes, were compared using the Student’s t-test. The Pearson’s chi-square test was applied to assess the categorical variables according to the MHO and MUHO groups and that test was used to test the homogeneity of proportions among the categorical variables. The Pearson’s Linear Correlation was used for the continuous variables. The significance level adopted was 5% (p<0.05).
Results
General Characterization Of The Studied Population
A total of 223 adults with obesity were recruited and were in the preoperative period of bariatric surgery. Of these, a total of 9 adults were excluded from the study because they did not meet any of the eligibility criteria, 2 were 60 years of age, 3 were diagnosed with class II obesity and the remainder had important information which could not be provided at the time of the consultation with the nutritionist for data collection.
The sample comprised 223 adults, mostly sedentary (79.82%), diagnosed with class III obesity, 76.23% females and 23.77% males, mean age of 41.20 ± 10.15 years, and no statistical difference between genders was observed (p=0.061). SH, NAFLD and IR were present in 70.40%, 97.58% and 76.23% of the studied sample, respectively. In relation to the bone metabolism parameters studied, 97.31% showed inadequacy of AP, 83.86% vitamin D deficiency, 79.82% inadequacy of PTH, 26.46% calcium deficiency and 12.11% phosphorus deficiency. Sun exposure time (min) among the individuals with obesity was 13.2 ± 5.2 mins/day, with reported use of sunscreen in 80% of the assessed adults, and no statistical difference was observed between them after their classification into MHO and MUHO phenotypes (p=0.254).
Characterization Of The Population According To The Obesity Phenotypes: MHO And MUHO
According to the classification of subjects, based on the NCEP-ATP III criteria, 32.73% were categorized as MHO and 67.26% as MUHO. Mean age between the MHO and MUHO groups was 38.86 ± 10.65 and 42.34 ± 9.73 years, respectively, and a statistical difference was found between the phenotypes (p=0.020). With respect to the physical activity level, mostly the obesity phenotypes, MHO and MUHO, respectively, were considered sedentary, 82.19% vs 78.67%. The remainder was considered inadequately inactive, 17.81% vs 21.33%, and no statistical difference (p=0.597) was observed between the groups.
In Figure 1, we can note a higher frequency (66.67%) of MUHO between the range of 35–56 years of age, while in MHO, the highest frequency (78.09%) was between 21 and 49 years of age, therefore the majority of younger subjects studied had the MHO phenotype.
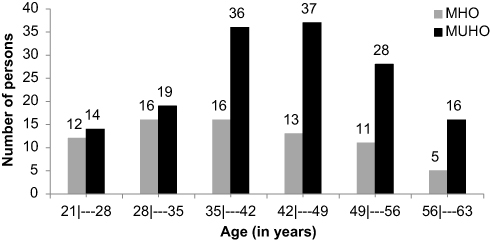 |
Figure 1 Frequency (%) of subjects by age group, according to obesity phenotypes, MHO and MUHO. Abbreviations: MHO, metabolically healthy obese; MUHO, metabolically unhealthy obese. |
Clinical, Biochemical And Anthropometric Variables According To The MHO And MUHO Phenotypes
The prevalence of NAFLD and IR were significantly higher (p<0.001) in the MUHO group, when compared to the MHO. As for the other metabolic variables (clinical and biochemical) in the NCEP-ATP III classification criteria, the prevalence of 36% of SH in the MHO group was significantly lower (p<0.001) when compared to the MUHO group where it reached 87%.
Similarly, significantly lower values of fasting glucose (mg/dL) 91.03 ± 15.99 vs 106.81 ± 30.42 (p<0.001), insulin (mg/dL) 16.36 ± 8.97 vs 19.73 ± 11.67 (p=0.018) and TG (mg/dL) 123.04 ± 140.94 vs 190.25 ± 239.38 (p=0.009) were found, in addition to significantly higher concentrations of HDL-c (mg/dL) 52.25 ± 11.64 vs 42.49 ± 8.96 (p<0.001) in the MHO group, when compared to the MUHO group.
We found statistically significant differences between the means of the anthropometric parameters, the VAI, 4.28 ± 3.56 vs 7.93 ± 8.70 (p=0.001), and of the inflammatory marker, HOMA-IR 3.74 ± 2.32 vs 5.40 ± 4.22 (p=0.002), regarding the MHO and MUHO groups, respectively. In the analyzed profile of bone metabolism markers selected for the study, AP showed a significant difference between the groups (p=0.016), lower in the MHO group (Table 1).
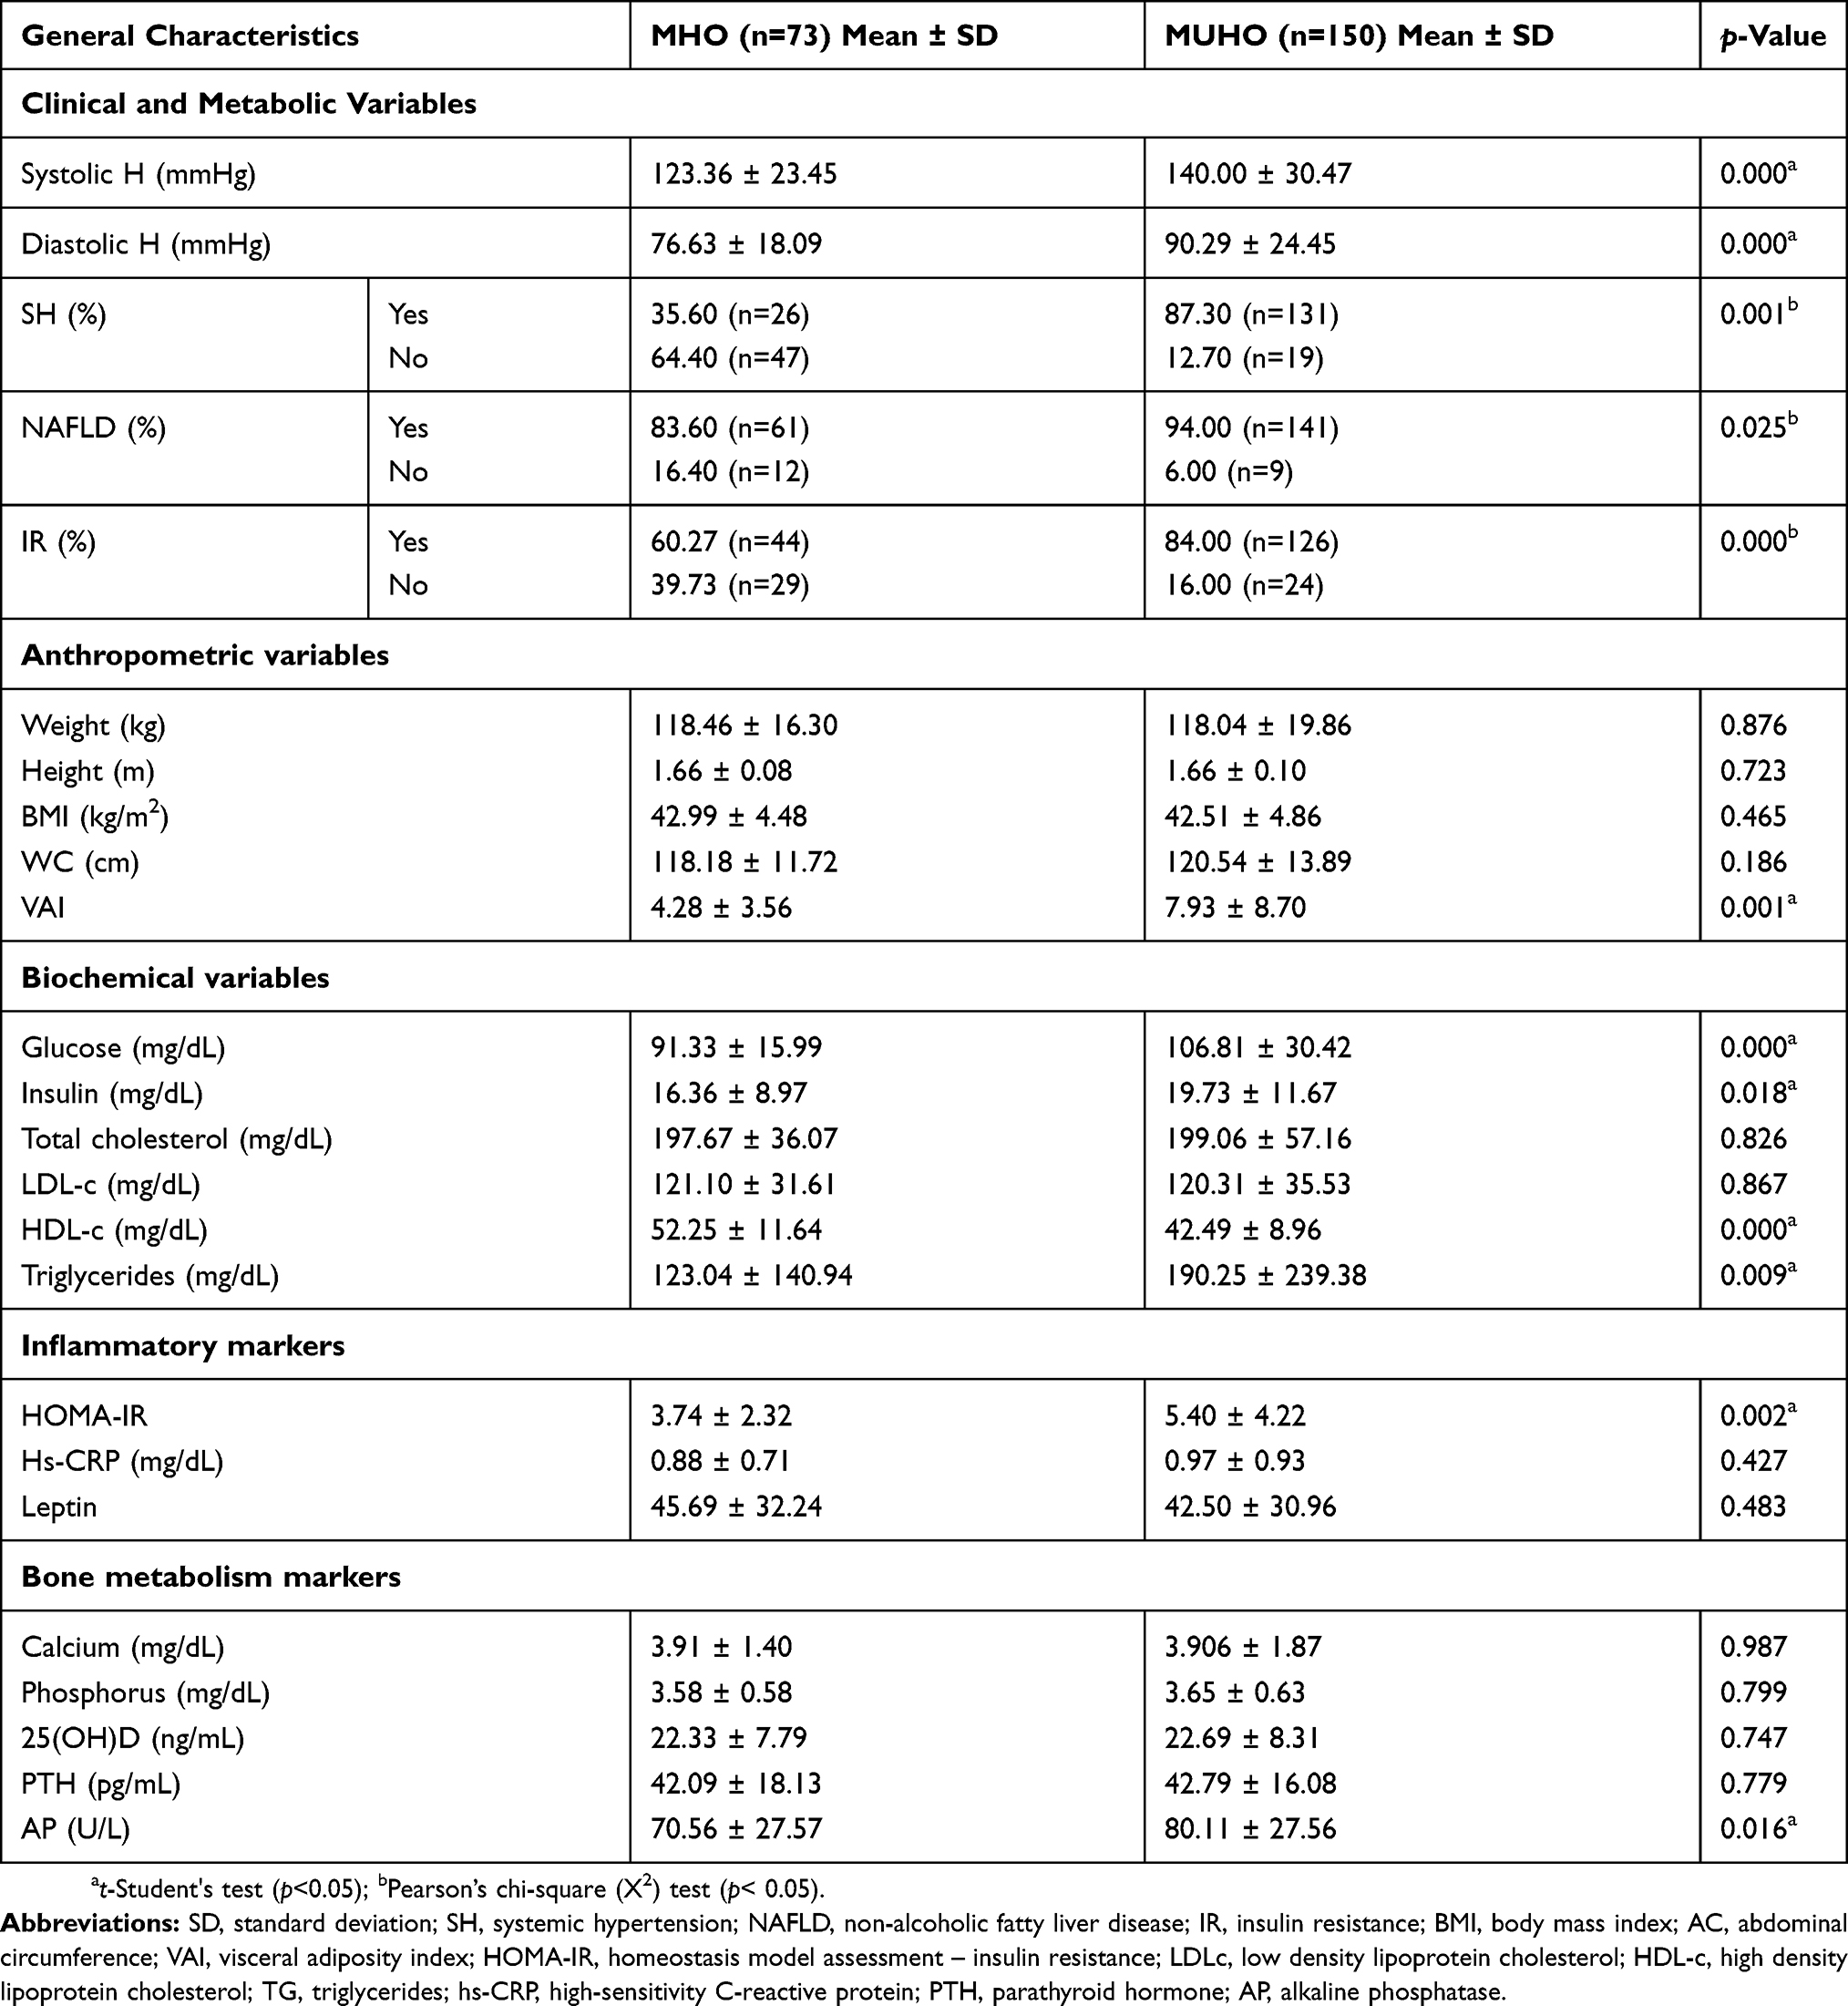 |
Table 1 Clinical, Biochemical And Anthropometric Characteristics Of The MHO And MUHO Phenotypes |
Correlation Between Bone Metabolism Markers And Anthropometric Parameters (BMI And VAI) And Inflammatory Markers According To The MHO And MUHO Phenotypes
Table 2 shows, in the MUHO group, a positive correlation between phosphorus and BMI (r=0.313; p<0.001), and a negative correlation between 25(OH)D and BMI (r=−0.307; p=0.041). When considering VAI, a negative correlation with calcium (r=−0.265; p=0.043) and a positive correlation with phosphorus (r=0.369; p=0.039) were also observed. Furthermore, regarding A Body Shape Index (ABSI), in the same group, we found negative correlations with calcium (r=−0.165; p=0.043) and phosphorus (r=−0.161; p=0.049). In the MHO group, no correlation was found between the bone metabolism variables and the body parameters studied.
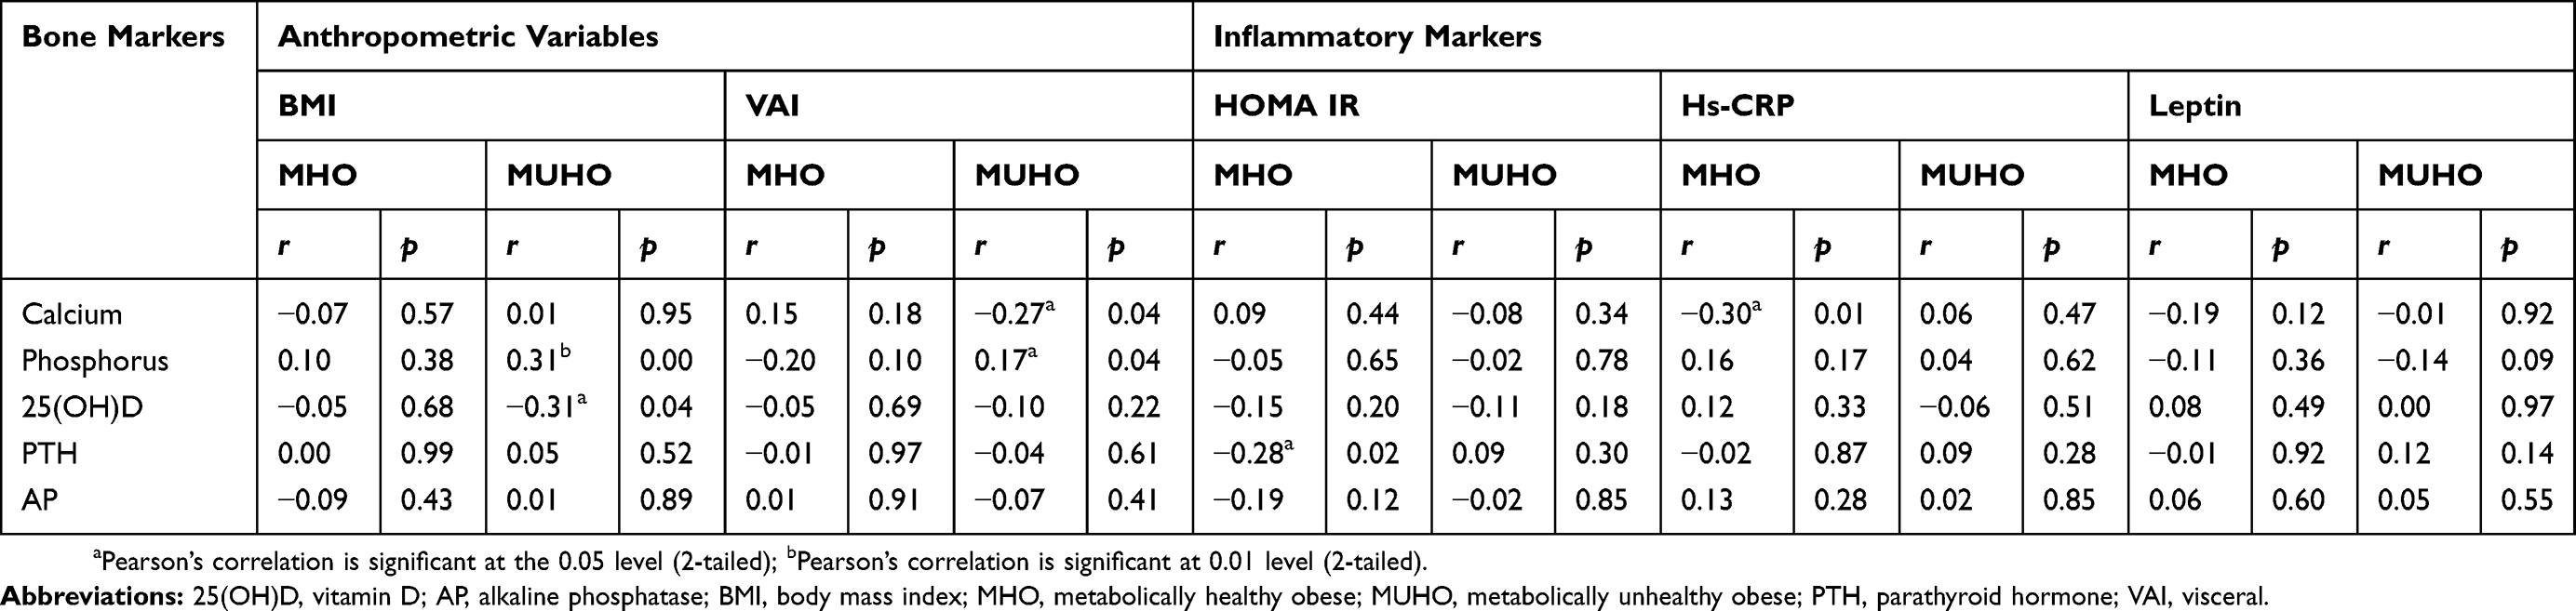 |
Table 2 Correlation Between Bone Metabolism Variables And Anthropometric Parameters And Inflammatory Markers (HOMA-IR, Hs-CRP And Leptin) According To The MHO And MUHO Phenotypes |
When the inflammatory markers were analyzed, in the MHO group, we found two negative correlations, the first, calcium with hs-CRP (r=−0.295; p=0.017) and the second, PTH with HOMA-IR (r=−0.279; p=0.017); and no correlation was found with leptin. In the MUHO group, no correlation was found between bone metabolism markers and inflammatory markers.
Discussion
The strong point of this study is that it was one of the few to report, in individuals with class III obesity, the relationship between the MHO phenotype and a set of biochemical variables and body fat distribution with importance for metabolic profile. The study presents two main findings. The first is the presence of the phenotype which, regardless of the classification in MHO or MUHO, was associated with changes in clinic, anthropometric and metabolic variables. The second is the combination of obesity with metabolically unhealthy status which was associated with greater impairment of the variables studied.
General Characterization Of The Population, According To The MHO And MUHO Phenotypes
We found a prevalence of the MHO phenotype (32.73%) in our study, according to the NCEP-ATP III criteria. Some evidence shows that 20–30% of individuals with obesity are classified as MHO.54,55 Data from the longitudinal study, ELSA-Brazil, which evaluated 14,545 adults and also used, as one of its criteria, the NCEP-ATP III found prevalence of 26.8% of MHO,56 which is lower than the prevalence found in our study. Other authors have reported frequencies of 14.9%,48 19.5%,55 36.6%57 and 39.2%.58 This variability can be explained by the study design, the characteristics of the population investigated, the number of individuals evaluated and the lack of standardization of a single criterion for the definition of the MHO phenotype. In those studies, different classes of obesity were evaluated, using different methods to classify the MHO phenotype, which could also justify the differences found. Regarding age, there was association with the MHO phenotype. Among the older adults with obesity (35–56 years of age), we found a higher prevalence (66.67%) related to the MUHO phenotype. Following the trend of previous findings,33,59 in our study, subjects classified as MUHO were significantly older than the ones classified as MHO. The MHO phenotype appears to be a transient status57,60 for about one-third of individuals.61 We cannot state that this transition occurred with some of our individuals classified as MUHO since our study is a cross-sectional study, therefore, without follow-up. Longitudinal studies have shown that the MHO status, because unstable, progresses to an unhealthy metabolic state in a considerable proportion of patients.34,62 However, there is still no consensus as to the time for this progression and whether all individuals will transition to the MUHO phenotype, since some remained MHO.63 Recent evidence also suggests that the MHO phenotype is related to a healthy lifestyle,64 including diet quality65 and practice of physical activity.66 In the present study, it was possible to observe that among the evaluated subjects, there was no association of the MHO or MUHO phenotypes with the habit of practicing or not physical activity, as described in the study by Donini et al.67 Although the underlying determinants and molecular mechanisms of this phenotype are not yet fully elucidated, the accumulated evidence suggests that it is influenced not only by environmental factors (i.e. diet and exercise) but also by biological and genetic factors,61 which could help to justify the result found in our study.
Clinical, Biochemical And Anthropometric Parameters According To The Obesity Phenotypes: MHO And MUHO
The fat content in the liver is an additional marker that has been considered very important in the context of the MHO phenotype definition. The prevalence of NAFLD appears to be significantly lower in MHO adults compared to MUHO.31,68 In our study, we found a high frequency (90.58%) of NAFDL among obese individuals, mainly in the MUHO group (94%), suggesting that there is an important relationship with the MHO phenotype that needs to be further investigated.
In our study, even among MUHO subjects, there was a higher prevalence of hypertension and IR (84%), suggesting that there is a relation between this parameter and the MHO phenotype. Our results are in accordance with previous findings,55,56,69–71 but the values we found for prevalence of hypertension and IR were higher when compared to these studies. Probably, this discrepancy is explained by the difference in the severity of obesity studied among the selected studies since our work was the only one among them evaluating class III obesity.
Both phenotypes presented significant inadequacy in four of the five variables of the NCEP-ATP III criteria with the exception of CA, which we believe did not defer since we evaluated individuals with severe class III obesity.72,73 Hypertension was the one that was most strongly associated with the MHO phenotype, presenting a high prevalence (87%) among the MUHO. Those findings highlight the importance of the profile of the variables that make up the MHO phenotype classification criterion.
Obese individuals have different patterns of body fat distribution and are related to different metabolic phenotypes.60 In our study, we found significantly lower values of VAI in the MHO subjects when compared to the MUHO, which showed that this tool was sensitive to detect the difference found between the phenotypes. This fact leads us to suggest that there is a difference between the MHO and MUHO phenotypes with regard to the site of greater deposition of body fat. In accordance with our study, Kang et al (2017)74 in a study with 2204 individuals with the MHO phenotype observed that higher VAI values were associated with a more compromised metabolic profile, MUHO. Moreover, these authors, in the same study, also observed that VAI correlated better with the MHO prognosis and was considered a good predictor in the determination of the conversion of the MHO phenotype into MUHO.
Although the difference between the majority of the studied bone metabolism markers (calcium, phosphorus, vitamin D, and PTH) was not significant in the groups, these data deserve attention since they are involved in metabolic disorders common in individuals with obesity. Several studies indicate that deficits in calcium, vitamin D and phosphorus in the long term, especially when associated with obesity, increase the risk of fractures and may be associated with a higher prevalence of osteoporosis, osteoarthritis, sarcopenia75,76 and other factors such as osteosarcopenic obesity5,77 and liver diseases.72,78 Vitamin D deficiencies and calcium and hormonal changes such as secondary hyperparathyroidism, when untreated, result in bone diseases.8,79 We observed that AP was related to the MHO phenotype. Higher plasma concentrations of the marker were observed in the most metabolically compromised phenotype, MUHO. This marker tends to be more concentrated when there is vitamin D deficiency. It is also influenced by the homeostasis of PTH, calcium and vitamin D.80 Therefore, even if the other markers have not differed between the phenotypes, MHO and MUHO, it is important to evaluate in a deeper way the significance of the observed changes in our study since they are indicative of greater bone remodeling.
We believe that the differences in the clinical, biochemical, anthropometric and metabolic profiles between MHO and MUHO groups observed in our study, added to other findings reported by several other prior studies, are results of several mechanisms still not clarified for interaction between genetic, environmental and behavioral factors. These factors affect the distribution of abdominal fat, accumulation of visceral and ectopic fat in the liver and muscle, IR, and determine the MHO phenotype,61 and can increase or decrease the risk for several diseases.
Correlation Between Bone Metabolism Markers And Anthropometric Parameters (BMI And VAI) And Inflammatory Markers According To The MHO And MUHO Phenotypes
In our study, we noted that among the MUHO individuals, plasma vitamin D levels varied inversely with BMI (r=−0.307, p=0.04). Previous findings have shown results similar to ours, where obese individuals presented lower serum vitamin D values when compared to normal weight ones. In addition, the plasma concentration of vitamin D was negatively correlated with body weight, BMI and fat mass.81,82 In the study by Vimaleswaran et al (2013)83 with 42,024 obese individuals, the same correlation was observed. It was shown that each increase of 1kg/m2 of BMI would be associated with 1.15% reduction of 25(OH)D. However, Seo et al (2012),84 when evaluating sarcopenic obesity in relation to plasma levels of vitamin D, did not find the same association. It is worth emphasizing that even though the evaluated individuals were also obese, sarcopenic obesity applies more criteria for diagnosis, which go beyond BMI. In the study, there was a negative association of vitamin D with visceral fat.
It is clear that vitamin D is related to obesity, and the correlation found in our study can be attributed to the liposolubility of this hormone and its biodistribution in the adipose tissue.85 The literature also reports that there are a number of possible mechanisms that can cause the lowest concentration of 25(OH)D in obesity, since that is multifactorial. Among them, deficiency could occur due to less exposure to sunlight,86 the lack of the habit of using sunscreen87 as observed throughout the studied sample, regardless of the classification from the obesity phenotypes, in addition to the age factor,81,88 considering that the individuals classified as MUHO were older than the MHO in our study, which could therefore favor the occurrence of vitamin D deficiency, as well as changes in the binding protein or metabolization of this vitamin.88
In the MUHO group, the correlations found between indicators of phosphorus and BMI (r=−0.313, p=0.00) and VAI (r=0.369, p=0.04), respectively, as well as between VAI and calcium (r=−0.265, p=0.04), can be partly explained by vitamin D deficiency and its secondary endpoints in the metabolism of these two nutrients (phosphorus and calcium), in addition to any more compromised clinical and metabolic profile of the group when compared to MHO. We believe that the difference between the profile of body and visceral adiposity observed in the phenotypes was significantly more impaired in the MUHO phenotype. When it was associated with vitamin D deficiency as a function of the greater volume of body tissue in the obese,75 it favored the lowest concentrations of serum calcium and phosphorus. Calcium and phosphorus play a key role in the maintenance of bone metabolism18,89,90 and their deficits are related to severity of obesity.91,92 Calcium is the most abundant mineral in the body, and the bone is a metabolic marker that must always be in balance with the blood. Phosphorus is the second most abundant mineral in the body. Its main function in bone metabolism is to combine with calcium to provide bone stiffness.80
Although no significant difference was found between the plasma vitamin D levels between the MHO and MUHO groups, MUHO, which is the most metabolically compromised phenotype, seems to have been more affected by vitamin D deficiency. Since there was a correlation with the BMI parameter, it may indirectly have influenced the correlations found of other markers (calcium and phosphorus) with VAI.
Regarding the HOMA-IR and the hs-CRP parameters, despite the high plasma levels of hs-CRP, they did not differ significantly between the phenotypes. In the MHO group, the inverse correlation of CRP with serum calcium levels (r=−0.295, p=0.01) can be explained by the probable link between the pathophysiological mechanisms of obesity and other syndromes such as osteoporosis, osteoarthritis, osteopenia, sarcopenia and sarcopenic obesity, diseases that are often associated with class III obesity6–8,75 and that quite possibly could be affecting a significant number of subjects in the studied sample. These diseases are characterized by long-term deficiency of nutrients such as calcium, vitamin D and increased secretion of PTH93 which are influenced by mechanisms of the inflammatory framework typical of obesity17,94,95 and characterized by higher levels of tumor necrosis factor alpha (TNFα), leptin, CRP, IR and other inflammatory cytokines in the adipose tissue.96
This hypothesis, related to inflammation, may explain the correlation between HOMA-IR and PTH (r= 0.279; p=0.02). The HOMA-IR parameter also reflects the inflammatory profile and it was significantly less compromised in the MHO group. This fact could influence the secretion of PTH from vitamin D deficiency. PTH is often used as an indicator of vitamin D status.97 Normally, low levels of 25(OH)D provide lower calcium absorption and increased bone turnover.75 Even though no significant difference was found between the groups in relation to vitamin D, the most preserved clinical and metabolic profile was impacted differently, justifying this correlation because it was less IR. In the study by Choi et al (2016),5 a progressive association between HOMA-IR and vitamin D levels was observed regardless of sarcopenic obesity in men. HOMA-IR and C-reactive protein were correlated with sarcopenic obesity in women.77 In the skeleton, PTH promotes the increase of bone resorption, besides being mainly responsible for acutely and rapidly regulating the serum calcium.98,99
The correlations found in our results need further investigation. No previous study, to our knowledge, has evaluated the correlation of this set of biochemical markers (clinical, anthropometric and metabolic) with the MHO phenotype in individuals with class III obesity, with promising results that could contribute to the development of complementary studies. However, we assume limitations in the present study: the reduced number of variables related to the inflammatory profile, the fact that it is a cross-sectional design study, so it was impossible to determine a causal relationship between the variables analyzed, as well as the impossibility of evaluating the stage of NAFDL since we only had data of complete abdominal ultrasound.
Conclusion
The MHO phenotype does not protect adults with class III obesity from developing clinic, anthropometric and metabolic changes that can negatively impact on the health of these individuals. Our study highlights that the MHO presents important metabolic changes such as those observed in the MUHO, although with lower prevalence and severity. This also occurs if we consider other clinical and metabolic variables outside the classificatory profile proposed by the NCEP-ATP III. These findings suggest continuous monitoring of these individuals in order to prevent the progression of the changes evaluated, since MHO seems to be a transient status, aiming at the effective reduction of the metabolic risks to which these individuals are exposed. In addition, the results presented here seem promising for the development of future studies related to obesity phenotypes and, as such, we suggest the conduction of further longitudinal studies to investigate the phenotype stability, the significance of our findings and the impact of the observed correlations.
Abbreviations
MS, metabolic syndrome; CRP, C-reactive protein; AP, alkaline phosphatase; MHO, metabolically healthy obesity phenotype; MUHO, metabolically unhealthy obesity phenotype; WC, waist circumference.
Acknowledgments
The authors acknowledge the support received from Fundação Carlos Chagas Filho de Amparo à Pesquisa do Estado do Rio de Janeiro (FAPERJ – Carlos Chagas Filho Foundation for Research Support of the State of Rio de Janeiro; Scientist of Our State), Conselho Nacional de Desenvolvimento Científico e Tecnológico (CNPq – National Council for Scientific and Technological Development) and CAPES – Brazilian Federal Agency for Support and Evaluation of Graduate Education within the Ministry of Education of Brazil.
Author Contributions
All authors contributed to data analysis, drafting or revising the article, gave final approval of the version to be published, and agree to be accountable for all aspects of the work.
Disclosure
The authors report no conflicts of interest in this work.
References
1. Ng M, Fleming T, Robinson M, et al. Global, regional, and national prevalence of overweight and obesity in children and adults during 1980–2013: a systematic analysis for the global burden of disease study 2013. Lancet. 2014;384:
2. NCD. Risk factor collaboration (NCD-RisC). Trends in adult body-mass index in 200 countries from 1975 to 2014: a pooled analysis of 1698 population-based measurement studies with 19·2 million participants. Lancet. 2016;387(10026):1377–1396. doi:10.1016/S0140-6736(16)30054-X
3. National Cholesterol Education Program Expert Panel on Detection, Evaluation, and Treatment of High Blood Cholesterol in Adults (Adult Treatment Panel III). Third report of the National Cholesterol Education Program (NCEP) expert panel on detection, evaluation, and treatment of high blood cholesterol in adults (adult treatment panel III) final report. Circulation. 2002;106:3143–3421.
4. Dervaux N, Wubuli M, Megnien JL, Chironi G, Simon A. Comparative associations of adiposity measures with cardiometabolic risk burden in asymptomatic subjects. Atherosclerosis. 2008;201(2):413–417. doi:10.1016/j.atherosclerosis.2007.11.032
5. Choi KM. Sarcopenia and sarcopenic obesity. Korean J Intern Med. 2016;31(6):1054–1060. doi:10.3904/kjim.2016.193
6. Tovo C, Fernandes SA, Buss C, de Mattos AA. Sarcopenia and non-alcoholic fatty liver disease: is there a relationship? A systematic review. World J Hepatol. 2017;28(9):326–332. doi:10.4254/wjh.v9.i6.326
7. Chen YY, Fang WH, Wang CC, et al. Body fat has stronger associations with bone mass density than body mass index in metabolically healthy obesity. PLoS One. 2018;13(11):e0206812. doi:10.1371/journal.pone.0206812
8. Bano G, Trevisan C, Carraro S, et al. Inflammation and sarcopenia: a systematic review and meta-analysis. Maturitas. 2017;96:10–15. doi:10.1016/j.maturitas.2016
9. Fazel Y, Koenig AB, Sayiner M, Goodman ZD, Younossi ZM. Epidemiology and natural history of non-alcoholic fatty liver disease. Metabolism. 2016;65(8):1017–1025. doi:10.1016/j.metabol.2016.01.012
10. Targher G, Lonardo A, Rossini M. Nonalcoholic fatty liver disease and decreased bone mineral density: is there a link? J Endocrinol Invest. 2015;38(8):817–882. doi:10.1007/s40618-015-0315-6
11. Wolf E, Utech M, Stehle P, Büsing M, Stoffel-Wagner B, Ellinger S. Preoperative micronutrient status in morbidly obese patients before undergoing bariatric surgery: results of a cross-sectional study. Surg Obes Relat Dis. 2015;11(5):1157–1163. doi:10.1016/j.soard.2015.03.018
12. Via MA, Mechanick JI. Nutritional and micronutrient care of bariatric surgery patients: current evidence update. Curr Obes Rep. 2017;6(3):286–296. doi:10.1007/s13679-017-0271-x
13. Faé C, Liberali R, Coutinho VF. Deficiência de nutrientes a longo prazo no pós-operatório de cirurgia bariátrica – revisão sistemática. SaBios. 2015;10(2):46–53.
14. Manoy P, Anomasiri W, Yuktanandana P, et al. Elevated serum leptin levels are associated with low vitamin D, sarcopenic obesity, poor muscle strength, and physical performance in knee osteoarthritis. Biomarkers. 2017;19:1–8. doi:10.1080/1354750X.2017.1315615
15. Chen XX, Yang T. Roles of leptin in bone metabolism and bone diseases. J Bone Miner Metab. 2015;33(5):474–485. doi:10.1007/s00774-014-0569-7
16. Hashimoto Y, Hamaguchi M, Fukuda T, Ohbora A, Kojima T, Fukui M. Fatty liver as a risk factor for progression from metabolically healthy to metabolically abnormal in non-overweight individuals. Endocrine. 2017;57(1):89–97. doi:10.1007/s12020-017-1313-6
17. Yang CW, Li CI, Li TC, et al. Association of sarcopenic obesity with higher serum high-sensitivity C-reactive protein levels in chinese older males – a community-based study (Taichung Community Health Study-Elderly, TCHS-E). PLoS One. 2015;10(7):e0132908. doi:10.1371/journal.pone.0132908
18. JafariNasabian P, Inglis JE, Kelly OJ, Ilich JZ, Jafari-Narsabian. Osteosarcopenic obesity in women: impact, prevalence, and management challenges. Int J Womens Health. 2017;9:33–42. doi:10.2147/IJWH.S106107
19. Szeljf C, Parra-Rodriguéz L, Rosas-Carrasco O. Osteosarcopenic obesity: prevalence and relation with frailty and physical performance in middle-aged and older women. J Am Med Dir Assoc. 2017;18(8):733e1–733e5. doi:10.1016/j.jamda.2017.02.023
20. Cabral JAV, Souza GP, Nascimento JA, Simoneti LF, Marchese C, Sales-Peres SH. Impact of vitamin D and calcium deficiency in the bones of patients undergoing bariatric surgery: a systematic review. Arq Bras Cir Dig. 2016;29(1 Suppl. 1)):120–123. doi:10.1590/0102-6720201600S10029
21. Bekaert M, Verhelst X, Geerts A, Lapauw B, Calders P. Association of recently described adipokines with liver histology in biopsy proven non-alcoholic fatty liver disease: a systematic review. Obes Rev. 2016;17(1):68–80. doi:10.1111/obr.12333
22. Liu C, Wang C, Guan S, et al. The prevalence of metabolically healthy and unhealthy obesity according to different criteria. Obes Facts. 2019;12(1):78–90. doi:10.1159/000495852
23. Primeau V, Coderre L, Karelis AD, et al. Characterizing the profile of obese patients who are metabolically healthy. Int J Obes. 2011;35:971e81. doi:10.1038/ijo.2010.216
24. Estrella ML, Pirzada A, Durazo-Arvizu RA, et al. Correlates of and Body Composition Measures Associated with metabolically healthy obesity phenotype in hispanic/latino women and men: the Hispanic Community Health Study/Study of Latinos (HCHS/SOL). J Obes. 2019;2019:1–10. doi:10.1155/2019/1251456
25. Stefan N, Häring HU, Hu FB, Schulze MB. Metabolically healthy obesity: epidemiology, mechanisms, and clinical implications. Lancet Diabetes Endocrinol. 2013;1(2):152–162. doi:10.1016/S2213-8587(13)70062-7
26. Lassale C, Tzoulaki I, Moons KGM, et al. Separate and combined associations of obesity and metabolic health with coronary heart disease: a pan-European case-cohort analysis. Eur Heart J. 2018;39(5):397–406. doi:10.1093/eurheartj/ehx44
27. Bell JA, Kivimaki M, Hamer M. Metabolically healthy obesity and risk of incident type 2 diabetes: a meta-analysis of prospective cohort studies. Obes Rev. 2014;15(6):504–515. doi:10.1111/obr.12157
28. Zheng R, Zhou D, Zhu Y. The long-term prognosis of cardiovascular disease and all-cause mortality for metabolically healthy obesity: a systematic review and meta-analysis. J Epidemiol Community Health. 2016;70(10):1024–1031. doi:10.1136/jech-2015-206948
29. Hinnouho GM, Czernichow S, Dugravot A, Batty GD, Kivimaki M, Singh-Manoux A. Metabolically healthy obesity and risk of mortality: does the definition of metabolic health matter? Diabetes Care. 2013;36:2294–2300. doi:10.2337/dc12-1654
30. Phillips CM. Metabolically healthy obesity: personalised and public health implications. Trends Endocrinol Metab. 2016;27(4):189–191. doi:10.1016/j.tem.2016.02.001
31. Ortega FB, Lavie CJ, Blair SN. Obesity and cardiovascular disease. Circ Res. 2016;118:1752e70. doi:10.1161/CIRCRESAHA.115.306883
32. Pujia A, Gazzaruso C, Ferro Y, et al. Individuals with metabolically healthy overweight/obesity have higher fat utilization than metabolically unhealthy individuals. Nutrients. 2016;8(1):2. doi:10.3390/nu8010002
33. Chang Y, Jung HS, Zhang Y, et al. Metabolically healthy obesity and the development of nonalcoholic fatty liver disease. Am J Gastroenterol. 2016;111(8). doi:10.1038/ajg.2016.178
34. Blüher S. Schwarz:metabolicallyhealthy obesity from childhood to adulthood – does weight status alone matter? Metabolism. 2014;63(9):1084–1092. doi:10.1016/j.metabol.2014.06.009
35. World Health Organization (WHO). Obesity: Preventing and Managing the Global Epidemic. Geneva: WHO; 2004.
36. National Kidney Foundation. KDOQI clinical practice guidelines for chronic kidney disease: evaluation, classification, and stratification. 2002. Available from: https://www.kidney.org/sites/default/files/docs/ckd_evaluation_classification_stratification.pdf.
37. Grundy SM, Cleeman JI, Merz CN, et al. Implications of recent clinical trials for the National Cholesterol Education Program Adult Treatment Panel III guidelines. Circulation. 2004;110(2):227–239. doi:10.1161/01.CIR.0000133317.49796.0E
38. Lohman T, Caballero B, Davis S. Pathways: A school-based program for the primary prevention of obesity in American Indian children. J Nutr Sept. 1998;9(9):535–543.
39. Amato MC, Giordano C, Galia M, et al. Visceral adiposity index: a reliable indicator of visceral fat function associated with cardiometabolic risk. Diabetes Car. 2010;33(4):920–922. doi:10.2337/dc09-1825
40. Craig CL, Marshall AL, Sjostrom M, et al. International physical activity questionnaire: 12-country reliability and validity. Med Sci Sports Exerc. 2003. doi:10.1249/01.MSS.0000078924.61453.FB
41. Pratt DS, Kaplan MM. Avaliação da função hepática [Liver function assessment]. In: Braunwald E, Fauci AS, Kasper DL, Hauser SL, Longo DL, Jameson LR, editors. Harrison Medicina Interna [harrison Internal Medicine].
42. Sociedade Brasileira de Cardiologia (SBC). VII Diretriz Brasileira de Hipertensão Arterial. 2016.Available from:http://publicacoes.cardiol.br/2014/diretrizes/2016/05_HIPERTENSAO_ARTERIAL.pdf.
43. Friedewald WT, Levy RI, Fredrickson DS. Estimation of the concentration of low-density lipoprotein cholesterol in plasma, without use of the preparative ultracentrifuge. Clin Chem. 1972;18(6):499–502.
44. Matthews DR, Hosker JP, Rudenski AS, Naylor BA, Treacher DF, Turner RC. Homeostasis model assessment: insulin resistance and beta-cell function from fasting plasma glucose and insulin concentrations in man. Diabetologia. 1985;28(7):412–419. doi:10.1007/bf00280883
45. Durward CM, Hartman TJ, Nickols-Richardson SM. All-cause mortality risk of metabolically healthy obese individuals in NHANES III. J Obes. 2012;2012:460321. doi:10.1155/2012/460321
46. Pearson TA, Mensah GA, Alexander RW, et al. Markers of inflammation and cardiovascular disease: application to clinical and public health practice: a statement for healthcare professionals from the Centers for Disease Control and Prevention and the American Heart Association. Circulation. 2003;107:499–511. doi:10.1161/01.cir.0000052939.59093.45
47. Kao PC. Parathyroid hormone assay. Mayo Clin Proc. 1982.
48. Bramer JA, Abudu AA, Tillman RM, Carrter SR, Sumathi VP, Grimer RJ. Pre and post chemotherapy alkaline phosphatase levels as prognostic indicators in adults with localized osteosarcoma. Eur J Cancer. 2005;41(18):2846–2852. doi:10.1016/j.ejca.2005.07.024
49. Holick MF, Chen TC. Vitamin D deficiency: a worldwide problem with health consequences. Am J Clin Nutr. 2008;87(4):1080S–6S. doi:10.1093/ajcn/87.4.1080S
50. Hanwell HEC, Vieth R, Cole DE, et al. Sun exposure questionnaire predicts circulating 25-hydroxyvitamin D concentrations in Caucasian hospital workers in southern Italy. J Steroid Biochem Mol Biol. 2010;121(1–2):334–337. doi:10.1016/j.jsbmb.2010.03.023
51. Daly JA, Ertingshausen G. Direct method for determining inorganic phosphate in serum with the “centrifiChem”. Clin Chem. 1972;18(3):263–265.
52. World Health Organization (WHO). The World Health Report, Fighting Disease, Fostering Development. 1996. Available from: www.who.int/whr/1996/en/.
53. IBM Cor:Released. IBM SPSS Statistics for Windows, Version 21.0. Armonk, NY: IBM Corp; 2012.
54. Goday A, Calvo E, Vázquez LA, et al. Prevalence and clinical characteristics of metabolically healthy obese individuals and other obese/non-obese metabolic phenotypes in a working population: results from the Icaria study. BMC Public Health. 2016;16:248. doi:10.1186/s12889-016-2921-4
55. Latifi SM, Karandish M, Shahbazian H, Taha JM, Cheraghian B, Moradi M. Prevalence of Metabolically Health Y Obesity (MHO) and its relation with incidence of metabolic syndrome, hypertension and type 2 diabetes amongst individuals aged over 20 years in Ahvaz: a 5 year cohort study (2009–2014). Diabetes Metab Syndr. 2017;11(Suppl.2):S1037–S1040. doi:10.1016/j.dsx.2017.07.036
56. Diniz MFH, Beleigoli AMR, Ribeiro ALP, et al. Factors associated with metabolically healthy status in obesity, overweight, and normal weight at baseline of ELSA-Brasil. Medicine. 2016;95(27):e4010. doi:10.1097/MD.0000000000004010
57. Hwang YC, Hayashi T, Fujimoto WY, et al. Visceral abdominal fat accumulation predicts the conversion of metabolically healthy obese subjects to an unhealthy phenotype. Int J Obes (Lond). 2015;39(9):1365–1370. doi:10.1038/ijo.2015.75
58. Phillips CM. Metabolically healthy obesity: definitions, determinants and clinical implications. Rev Endocr Metab Disord. 2013;14(3):219–227. doi:10.1007/s11154-013-9252-x
59. Van Vliet-Ostaptchouk JV, Noutio ML, Slagter SN, et al. The prevalence of metabolic syndrome and metabolically healthy obesity in Europe: a collaborative analysis of ten large cohort studies. BMC Endocr Disord. 2014;14:9. doi:10.1186/1472-6823-14-9
60. Stefan N, Haring HU, Hu FB, Schulze MB. Metabolically healthy obesity: epidemiology, mechanisms, and clinical implications. Lancet Diabetes Endocrinol. 2013;1(2):152–162. doi:10.1016/S2213-8587(13)70062-7
61. Phillips CM. Metabolically healthy obesity across the life course: epidemiology, determinants, and implications. Ann N Y Acad Sci. 2017;1391(1):85–100. doi:10.1111/nyas.13230
62. Arnlov J, Sundstrom J, Ingelsson E, Lind L. Impact of BMI and the metabolic syndrome on the risk of diabetes in middle-aged men. Diabetes Care. 2011;34(1):61–65. doi:10.2337/dc10-0955
63. Hamer M, Bell JA, Sabia S, Batty GD, Kivimaki M. Stability of metabolically healthy obesity over 8 years: the english longitudinal study of ageing. Eur J Endocrinol. 2015;173(5):703–708. doi:10.1530/eje-15-0449
64. Schröder H, Ramos R, Baena-Díez JM, et al. Determinants of the transition from a cardiometabolic normal to abnormal overweight/obese phenotype in a Spanish population. Eur J Nutr. 2014;53(6):1345–1353. doi:10.1007/s00394-013-0635-2
65. Bell LK, Edwards S, Grieger JA. The relationship between dietary patterns and metabolic health in a representative sample of adult Australians. Nutrients. 2015;7(8):6491–6505. doi:10.3390/nu7085295
66. de Rooij BH, van der Berg JD, van der Kallen CJ, et al. Physical activity and sedentary behavior in metabolically healthy versus unhealthy obese and nonobese individuals – the maastricht study. PLoS One. 2016;11(5):e0154358. doi:10.1371/journal.pone.0154358
67. Donini LM, Merola G, Poggiogalle E, et al. Disability, physical inactivity, and impaired health-related quality of life are not different in metabolically healthy Vs. unhealthy obese subjects. Nutrients. 2016;8(12):759. doi:10.3390/nu8120759
68. Abenavoli L, Peta V. Role of adipokines and cytokines in non-alcoholic fatty liver disease. Rev Recent Clin Trials. 2014;9(3):134–140.
69. Kim HT, Kim HJ, Ahn HY, Hong YH. An analysis of age-related loss of skeletal muscle mass and its significance on osteoarthritis in a Korean population. Korean J Intern Med. 2016;31(3):585–593. doi:10.3904/kjim.2015.156
70. Lee TH, Jeon WS, Han KJ, et al. Comparison of serum adipocytokine levels according to metabolic health and obesity status. Endocrinol Metab (Seoul). 2015;30(2):185–194. doi:10.3803/EnM.2015.30.2.185
71. Shaharyar S, Roberson LL, Jamal O, et al. Obesity and metabolic phenotypes (metabolically healthy and unhealthy variants) are significantly associated with prevalence of elevated c-reactive protein and hepatic steatosis in a large healthy brazilian population. J Obes. 2015;2015. doi:10.1155/2015/178526
72. Cordeiro A, Pereira A, Saboya CJ, Ramalho A. Relationship between nonalcoholic fatty liver disease and vitamin D nutritional status in extreme obesity. Can J Gastroenterol Hepatol. 2017;2017. doi:10.1155/2017/9456897
73. Cordeiro A, Pereira SE, Saboya SE, Ramalho A. Nonalcoholic fatty liver disease relationship with metabolic syndrome in class III obesity individuals. Biomed Res Int. 2015;2015:839253. doi:10.1155/2015/839253
74. Huh JH, Kim KJ, Kim SU, et al. Obesity is more closely related with hepatic steatosis and fibrosis measured by transient elastography than metabolic health status. Metabolism. 2017;66:23–31. doi:10.1016/j.metabol.2016.10.003
75. Walsh JS, Bowles S, Evans AL. Vitamin D in obesity. Curr Opin Endocrinol Diabetes Obes. 2017;24(6):389–394. doi:10.1097/MED.0000000000000371
76. Avenell A, Mak JC, O’Connell D. Vitamin D and vitamin D analogues for preventing fractures in post-menopausal women and older men. Cochrane Database Syst Rev. 2014;4:1–170. doi:10.1002/14651858.CD000227.pub4
77. Kim TN, Park MS, Lim KI, et al. Relationships between sarcopenic obesity and insulin resistance, inflammation, and vitamin D status: the Korean Sarcopenic Obesity Study. Clin Endocrinol (Oxf). 2013;78(40):525–532. doi:10.1111/j.1365-2265.2012
78. Severson TJ, Besur S, Bonkovsky HL. Genetic factors that affect nonalcoholic fatty liver disease: a systematic clinical review. World J Gastroenterol. 2016;22(29):6742–6756. doi:10.3748/wjg.v22.i29.6742
79. Murray TÉ, Williams D, Lee MJ. Osteoporosis, obesity, and sarcopenia on abdominal CT: a review of epidemiology, diagnostic criteria, and management strategies for the reporting radiologist. Abdom Radiol (NY). 2017;42(9):2376–2386. doi:10.1007/s00261-017-1124-5
80. Christakos S, Dhawan P, Porta A, Mady LJ, Seth T. Vitamin D and intestinal calcium absorption. Mol Cell Endocrinol. 2011;347(1–20):25–29. doi:10.1016/j.mce.2011.05.038
81. Walsh JS, Evans AL, Bowles S, et al. Free 25-hydroxyvitamin D is low in obesity, but there are no adverse associations with bone health. Am J Clin Nutr. 2016;103(6):1465–1471. doi:10.3945/ajcn.115.120139
82. Samuel L, Borrell LN. The effect of body mass index on optimal vitamin D status in U.S. adults: the National Health and Nutrition Examination Survey 2001–2006. Ann Epidemiol. 2013;23(7):409–414. doi:10.1016/j.annepidem.2013.05.011
83. Vimaleswaran KS, Berry DJ, Lu C, et al. Causal relationship between obesity and vitamin D status: bi-directional mendelian randomization analysis of multiple cohorts. PLoS Med. 2013;10(2):1–13. doi:10.1371/journal.pmed.1001383
84. Seo JA, Cho H, Eun CR, et al. Association between visceral obesity and sarcopenia and vitamin D deficiency in older Koreans: the Ansan Geriatric Study. J Am Geriatr Soc. 2012;60(4):700–706. doi:10.1111/j.1532-5415.2012.03887.x
85. Wimalawansa SJ. Vitamin D deficiency is a surrogate marker for visceral fat content, metabolic syndrome, type 2 diabetes, and future metabolic complications. J Diabetes Metab Disord Control. 2016;3(1):00059. doi:10.15406/jdmdc.2016.03.00059
86. Kull M, Kallikorm R, Lember M. Body mass index determines sunbathing habits: implications on vitamin D levels. Intern Med J. 2009;39(4):256–258. doi:10.1111/j.1445-5994.2009.01900.x
87. Shea MK, Houston DK, Tooze JA, et al. Correlates and prevalence of insufficient 25-hydroxyvitamin D status in black and white older adults: the health, aging and body composition study. J Am Geriatr Soc. 2011;59(7):1165–1174. doi:10.1111/j.1532-5415.2011.03476.x
88. Winters SJ, Chennubhatla R, Wang C, Miller JJ. Influence of obesity on vitamin D-binding protein and 25-hydroxy vitamin D levels in African American and white women. Metabolism. 2009;58(4):438–442. doi:10.1016/j.metabol.2008.10.017
89. Fischer V, Haffnet-Luntzer M, Prystaz K, et al. Calcium and vitamin-D deficiency marginally impairs fracture healing but aggravates posttraumatic bone loss in osteoporotic mice. Sci Re. 2017;7:7223. doi:10.1038/s41598-017-07511-2
90. Ormsbee MJ, Prado CM, Ilich JZ, et al. Osteosarcopenic obesity: the role of bone, muscle, and fat on health. J Cachexia Sarcopenia Muscle. 2014;5(3):183–192. doi:10.1007/s13539-014-0146-x
91. Kelly OJ, Gilman JC, Kim Y, Ilich JZ. Micronutrient intake in the etiology, prevention and treatment of osteosarcopenic obesity. Curr Aging Sci. 2016;9(4):260–268.
92. Lo Menzo E, Cappellani A, Zanghì A, Di Vita M, Berretta M, Szomstein S. Nutritional implications of obesity: before and after bariatric surgery. Bariatr Surg Pract Patient Care. 2014;9(1):9–17. doi:10.1089/bari.2014.9969
93. Demirağ MD, Özkan S, Haznedaroğlu Ş, et al. Associations between obesity and the radiographic phenotype in knee osteoarthritis. Turk J Med Sci. 2017;47(2):424–429. doi:10.3906/sag-1512-26
94. Poonpet T, Honsawek S. Adipokines: biomarkers for osteoarthritis? World J Ortho. 2014;5(3):319–327. doi:10.5312/wjo.v5.i3.319
95. Dutra MT, Avelar BP, Souza VC, et al. Relationship between sarcopenic obesity-related phenotypes and inflammatory markers in postmenopausal women. Clin Physiol Funct Imaging. 2017;37(2):205–210. doi:10.1111/cpf.12287
96. Gonçalves CG, Glade MJ, Meguid MM. Metabolically healthy obese individuals: key protective factors. Nutrition. 2016;32(1):14–20. doi:10.1016/j.nut.2015.07.010
97. Snijder MB, Van Dam RM, Visser M, et al. Adiposity in relation to vitamin D status and parathyroid hormone levels: a population-based study in older men and women. J Clin Endocrinol Metab. 2005;90(1):4119–4123. doi:10.1210/jc.2005-0216
98. Vilaça T. Obesidade, Doenças Osteometabólicas, Gota e Osteoartrose. In: Mancini CM, Geloneze B, Salles JE, Lima JG, Carra M, editors. Tratado De Obesidade.
99. Cusano NE, Rubin MR, Irani D, Sliney J
 © 2019 The Author(s). This work is published and licensed by Dove Medical Press Limited. The
full terms of this license are available at https://www.dovepress.com/terms
and incorporate the Creative Commons Attribution
- Non Commercial (unported, 3.0) License.
By accessing the work you hereby accept the Terms. Non-commercial uses of the work are permitted
without any further permission from Dove Medical Press Limited, provided the work is properly
attributed. For permission for commercial use of this work, please see paragraphs 4.2 and 5 of our Terms.
© 2019 The Author(s). This work is published and licensed by Dove Medical Press Limited. The
full terms of this license are available at https://www.dovepress.com/terms
and incorporate the Creative Commons Attribution
- Non Commercial (unported, 3.0) License.
By accessing the work you hereby accept the Terms. Non-commercial uses of the work are permitted
without any further permission from Dove Medical Press Limited, provided the work is properly
attributed. For permission for commercial use of this work, please see paragraphs 4.2 and 5 of our Terms.