Back to Journals » Integrated Pharmacy Research and Practice » Volume 4
Clients’ expectations from and satisfaction with medicine retail outlets in Gondar town, northwestern Ethiopia: a cross-sectional study
Authors Workye M, Admasu S, Abura T, Belete Y, Getaye Y ![]() , Teni FS
, Teni FS ![]() , Surrur A
, Surrur A
Received 14 October 2014
Accepted for publication 9 December 2014
Published 28 January 2015 Volume 2015:4 Pages 1—12
DOI https://doi.org/10.2147/IPRP.S75819
Checked for plagiarism Yes
Review by Single anonymous peer review
Peer reviewer comments 4
Editor who approved publication: Professor Jonathan Ling
Video abstract presented by Fitsum Sebsibe Teni
Views: 1947
Mulualem Workye,1 Sewunet Admasu,2 Tamrat Abura,1 Yared Belete,1 Yonas Getaye,2 Fitsum Sebsibe Teni,1 Abdrrahman Shemsu Surur3
1Pharmaceutics and Social Pharmacy Unit, 2Clinical Pharmacy Unit, 3Pharmaceutical Chemistry Unit, School of Pharmacy, College of Medicine and Health Sciences, University of Gondar, Gondar, Amhara Regional State, Ethiopia
Purpose: The aim of this study was to assess clients' level of expectation from and satisfaction with medicine retail outlets (MROs) in Gondar town, northwestern Ethiopia.
Patients and methods: An institutions-based cross-sectional study was conducted from April 20 to May 5, 2014, by sampling five pharmacies and eight drug stores through simple random sampling. Clients, 424, who came to the MROs during the study period were included in the study. Data were collected using structured questionnaires measuring expectations and satisfaction of clients using a Likert scale of 1–5 through face-to-face interviews.
Results: Out of the total 424 interview encounters, 422 (99.5% response rate) questionnaires were included in the analysis, of which 61.1% were of males. The overall mean expectation of respondents toward MRO setting and services was 3.82 and that of satisfaction of the respondents was 3.02. More than three-quarters (76.8%) of the respondents expected medicines in affordable prices from MROs, but nearly half (44.8%) were not satisfied with it. Much more than half (58.5%) of the respondents were dissatisfied with the comfort and convenience of private counseling area. Also, nearly half (47.6%) of the respondents claimed that pharmacy professionals did not provide information regarding the storage condition of medications. There was statistically significant difference in overall expectation (t=2.707, P=0.007) and satisfaction (t=2.260, P=0.024) with the setting and services of MROs between respondents who claimed to know the difference between a pharmacy and a drug store and those who claimed they did not.
Conclusion: Clients’ expectation from MRO services was high, with average satisfaction. The overall expectation and satisfaction of the respondents toward MROs were lower in those who reported they did not know the difference between a pharmacy and a drug store than in those who claimed to know the difference. Supportive supervision by the town’s health bureau on the MROs is recommended to help improve clients' satisfaction.
Keywords: community, drug store, pharmacy, pharmacy professional, services
Introduction
Client satisfaction can be defined as a personal evaluation of the patient on the health care services and providers.1 It is an integral component of the quality of health care.2 Satisfaction reflects the realities of care as well as the preferences and expectations of the patient.3 To ensure higher quality of pharmaceutical services and better outcomes, enhancement in the communication, convenience, and courtesy are important. High satisfaction promotes positive health behaviors, such as compliance and continuity with providers. Adhering to medication schedules and stability in visiting the same health care professionals are improved with higher satisfaction levels.4,5
Knowledge of consumer expectation and satisfaction is extremely important in determining the success of service provision.6 Satisfaction of patients with the services provided in community pharmacies is among the important elements in making the services successful.7
Different instruments such as Patient Satisfaction with Pharmaceutical Care: Update of a Validated Instrument, validated Patient Satisfaction with Pharmacy Performance Questionnaire (PSPP-Q), and other tools have been developed and validated to measure patients’ expectations and satisfaction toward medicine retail outlet (MRO) services.7,8 By using these instruments, different studies were done in various countries, including Qatar, England, Canada, and different results of client expectations and satisfaction have been reported.9–11
In Ethiopia, pharmacy services in the community settings are provided by pharmacies, drug stores, and rural drug vendors. These institutions are collectively known as MROs. Based on this classification, a pharmacy is an establishment retailing medicines which is managed by a pharmacist registered with a relevant body and licensed to dispense medicines for humans and compound prescribed preparations. A drug store, on the other hand, is a medicines retail establishment managed by a pharmacist or druggist (a pharmacy professional with a diploma level of qualification) registered and licensed to dispense medicines for humans. A rural drug vendor is categorized in Ethiopia as a medicines retail establishment led by a druggist or a pharmacy technician (lower level of qualification than druggists) registered and licensed to dispense medicines for humans. In addition to this, pharmacy, drug store, and rural drug vendors also differ among them with regard to the legal requirements they have to fulfill to function and the scope of services and medicines provided in them. Pharmacies are required to have rooms for dispensing, storage, and compounding (if compounding service is provided), an office, and a restroom. Similarly, drug stores and rural drug vendors are expected to contain a dispensing room, a store, an office, and a restroom. However, the size of the required rooms varies among the MROs, and the variety of medicines and medical devices handled in them increases from rural drug vendors through drug stores to pharmacies.12
Most of the limited researches in the area of pharmaceutical sciences and services in our country have been focused on health institution-based prescription pattern assessments and some basic researches.13–15 To the best of literature searches done, there were no studies which assessed expectations and satisfaction of MRO clients toward the services they get in Ethiopia. However, there have been reports of various complaints about the service by community drug retail outlets, with no empirical evidence to support them. So this study was done to help narrow the information gap in this respect by documenting the satisfaction level of clients of MROs of Gondar town.
The objective of this study was to assess clients’ level of expectations from and satisfaction with MROs in Gondar town, northwestern Ethiopia.
Methods
Study area and design
The study was conducted on clients of MROs in Gondar town, northwestern Ethiopia. The town has one referral and teaching hospital, one private general hospital, a number of health centers and private clinics, and 53 MROs (19 pharmacies and 34 drug stores).16 An institutions-based cross-sectional study design was employed to assess the level of expectation from and expectations and satisfaction of clients with services of MROs.
Sample size determination and sampling procedure
The sample size was determined by using a single mean formula:17
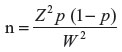
where n is the sample size required; W, marginal error of 5% (W=0.05); Z, the degree of accuracy required at 95% confidence level =1.96; and p=2.5 out of 5 on a Likert scale, or 0.5 (50%) level of satisfaction. This was done because no previously published finding on MROs was found in our country to the best of literature search done. Using the aforementioned formula, the sample size was calculated as follows:
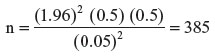
After adding 10% of the calculated sample size for possible nonresponse, the final sample size was 424 clients.
The sampling procedure followed in this study involved two steps. First, the selection of MROs was performed by simple random sampling. Among the total 53 MROs (19 pharmacies and 34 drug stores) in the town, 5 pharmacies and 8 drug stores were selected. These constituted about 25% of the respective MRO which was chosen as a compromise between representativeness and feasibility. After this, the number of clients to be involved in the study from each MRO was calculated based on the average daily client flow to each, and this was used to proportionally allocate the calculated total sample size to the MROs (Figure S1).
Following the aforementioned approach, 261 (61.5%) of the total number of questionnaires were administered to clients attending the sampled drug stores and 163 (38.5%) of the questionnaires were administered to clients attending the sampled pharmacies in the study period based on the proportion of client flow.
Data collection and management
The data collection format used in the study was adopted from previous studies and was prepared in English. This was translated to Amharic and then back translated to English to ensure that the translated version gives the proper meaning.7–10,18 The questionnaire included three major parts which focused on sociodemographic and related information, expectations of clients of MROs, and their satisfaction with them. The part concerning expectations of clients had two subsections focusing on expectations in relation to the settings of MROs and the services provided in the MROs. In relation to expectations, the setting-related questions focused on assessing expectations from the physical aspects and the organization of the MROs. On the other hand, the subsection of services emphasized on items that can help assess the expectations toward the activities of pharmacy professionals in providing various medicines-related services.
The part focusing on satisfaction was also divided into two parts focusing on the settings and the services of MROs. The items assessing the settings centered on the physical and organizational aspects of the MROs, and those assessing the satisfaction with the service aspects focused on how pharmacy professionals approached clients and how pharmacy services, including dispensing and counseling, were provided.
The part of the questionnaire focusing on expectations of clients used a Likert scale of 1–5, where “1” represented “Strongly disagree”, “2” denoted “Disagree”, “3” indicated “Neutral”, “4” described “Agree”, and “5” stood for “Strongly agree”. Similarly, the parts of the questionnaire concerning satisfaction of clients used a Likert scale of 1–5, where “1” stood for “Poor”, “2” for “Fair”, “3” for “Good”, “4” for “Very good”, and “5” for “Excellent”.
The questionnaire was pretested on 25 clients prior to the actual data collection on MROs, which were not included in the study, and relevant modifications were instituted. Data collection was performed by five of the principal investigators through interviewer-administered questionnaires. The collection was done from April 20 to May 5, 2014.
Data entry, analysis, and interpretation
The data collected using quantitative method were entered to and analyzed using IBM SPSS Statistics for Windows, version 21.0.19 Frequencies, percentages, t-test, and ANOVA (analysis of variance) with post hoc test were used to analyze different variables. P-value less than 0.05 and 95% confidence interval (CI) were used as cut off points for determining statistical significance of associations among different variables.
Ethical considerations
This study was approved by the ethical review committee of the School of Pharmacy, College of Medicine and Health Sciences, University of Gondar. Consent from MROs was obtained; informed consent from participants was also obtained prior to conducting the study. Participants’ information obtained from the questionnaires was kept confidential. Participants were also informed that participation was voluntary and that they could withdraw from the study at any stage if they desired.
Results
Sociodemographic characteristics
During the 2-week data collection period, of the total 424 interview encounters, questionnaires of 422 participants (99.5% response rate) were included in the analysis. The mean age of participants was 31 years, with a standard deviation (SD) of 10 years. Majority of the respondents were males (61.1%) and Orthodox Christians (81.1%). About two-third (60.9%) of the respondents were attending/had attended college or university, and almost all (93.4%) were urban residents and Amhara in ethnicity (90.3%). There were comparable married (48.8%) and unmarried (48.1%) participants. More than half of the respondents were students (29.9%) and government employees (28.7%). One-third of the participants (34.8%) reported a monthly income of less than 500 Ethiopian birr (ETB), followed by those who earned 2,500 ETB and more (26.8%) (Table 1).
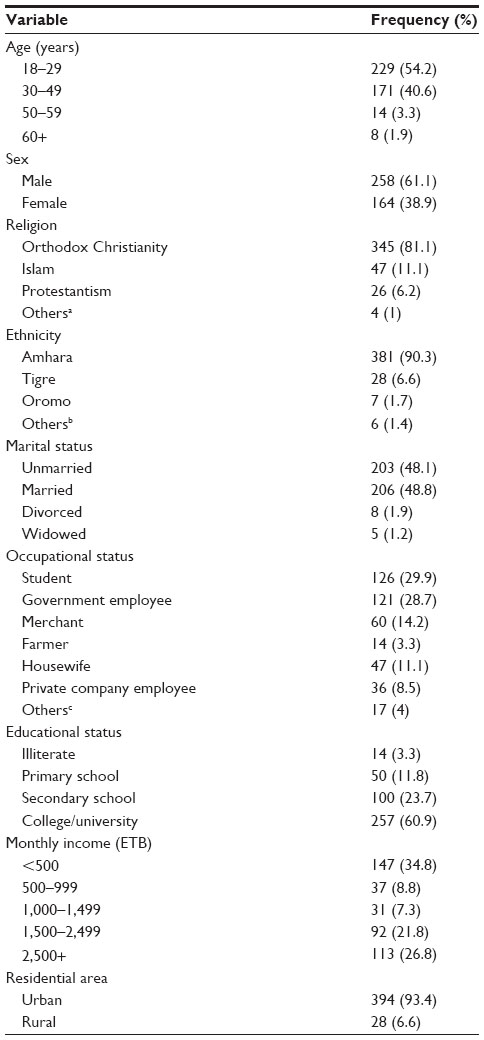 | Table 1 Distribution of respondents by sociodemographic characteristics, Gondar, 2014 |
General information related to MRO services
More than half of the respondents’ (54.1%) reason for visit to the MROs was to take medicines for themselves. More than two-thirds (68.7%) of the respondents had repeated visits to the MROs. More than half (55%) of the respondents claimed that they did not know the difference between a pharmacy and a drug store (Figures S2–S4).
Clients’ expectations from MRO setting
Looking specifically into parameters related to settings of MROs, more than two-thirds of the respondents expected comfortable waiting area (Agree =49.9%, Strongly agree =19%) and good appearance of MROs (Agree =52.7%, Strongly agree =25.8%). More than three-quarters (76.8%) of the participants expected the required medicines to be available at affordable cost (Table 2).
 | Table 2 Percentage distribution of respondents’ expectation toward MRO setting, Gondar, 2014 |
One-way ANOVA test showed significant difference in expectation toward MRO setting among different age groups (F (3,403) =3.020, P=0.03) (Table 3). Post hoc analysis indicated that respondents within the age group of 30–49 years (mean =3.90) had higher expectation of MRO setting than those in the age group of 18–29 years (mean =3.66) (P=0.025).
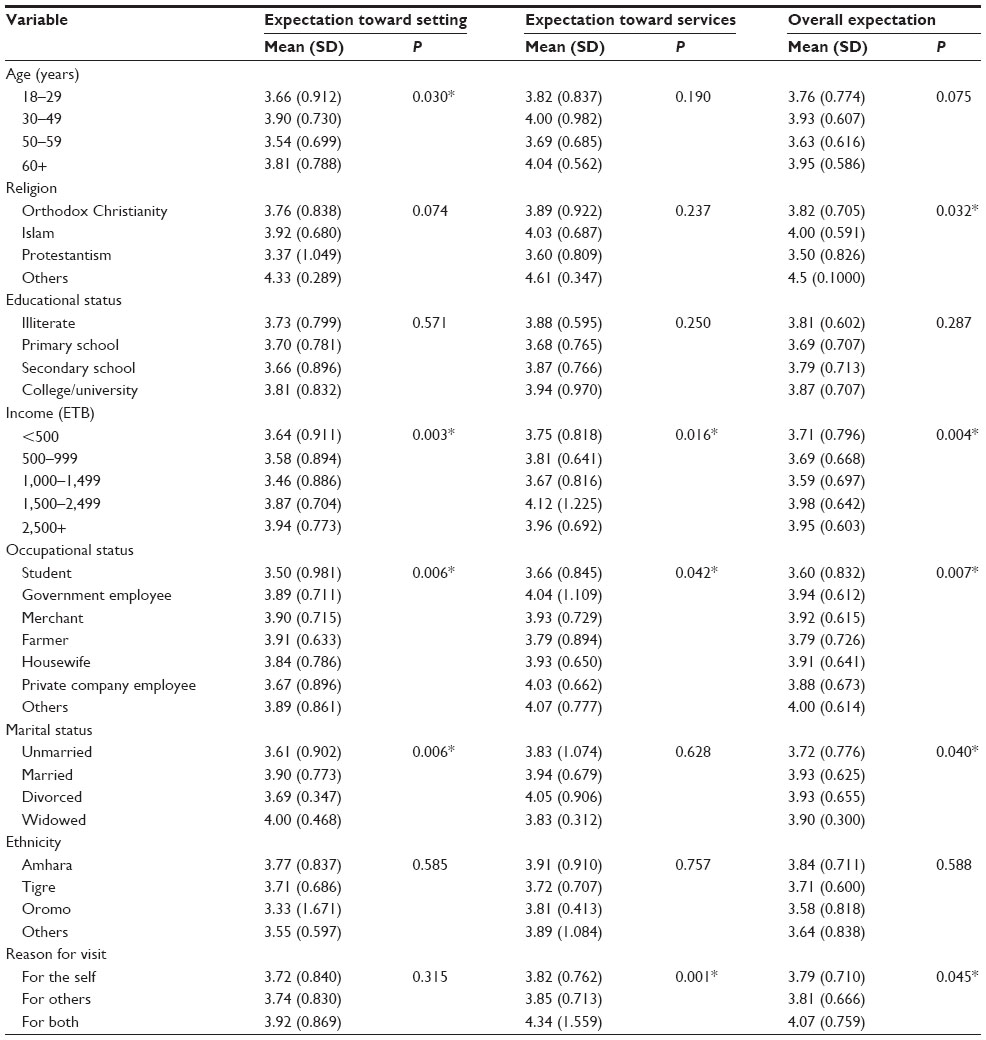 | Table 3 Statistical test (one-way ANOVA) of differences among categories of respondents in expectation toward MROs, Gondar, 2014 |
Clients’ expectations from MRO services
As to services, most respondents expected pharmacy professionals to check their prescription (Agree =44.8%, Strongly agree =41.9%) and to advise/counsel them in detail about their medication(s) (Agree =40%, Strongly agree =40.7%). Fifty-seven percent of the respondents expected pharmacy professionals to monitor safe and effective use of medicines and progression of their health. More than two-thirds (66.6%) of the respondents said that they would seek advice from pharmacy professionals for the treatment of minor ailments. More than three-quarters (80.2%) of the participants expected pharmacy professionals to label their medications (Table 4).
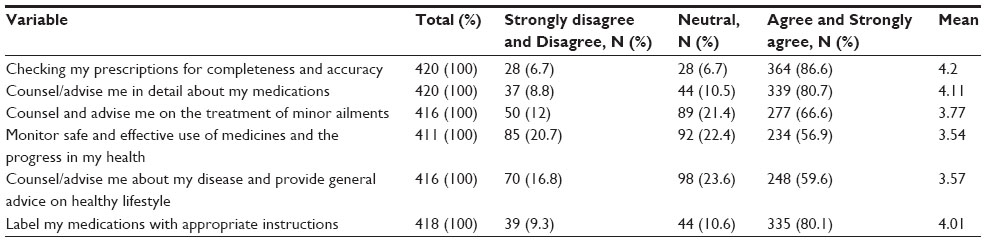 | Table 4 Percentage distribution of respondents’ expectation toward MRO services, Gondar, 2014 |
Clients’ overall expectation from MROs
The overall mean expectation toward MRO setting and pharmacy professional services was 3.82 on a 5-point Likert scale (Tables 2 and 4). There was a statistically significant difference (t=2.707, P=0.007) in the overall expectation toward setting and services of MROs between respondents who claimed to know the difference between a pharmacy and a drug store and those who claimed they did not know. The mean expectation of the respondents who did not know (mean =3.74) the difference was lower than that of those who claim to know the difference (mean =3.93) (Table 5).
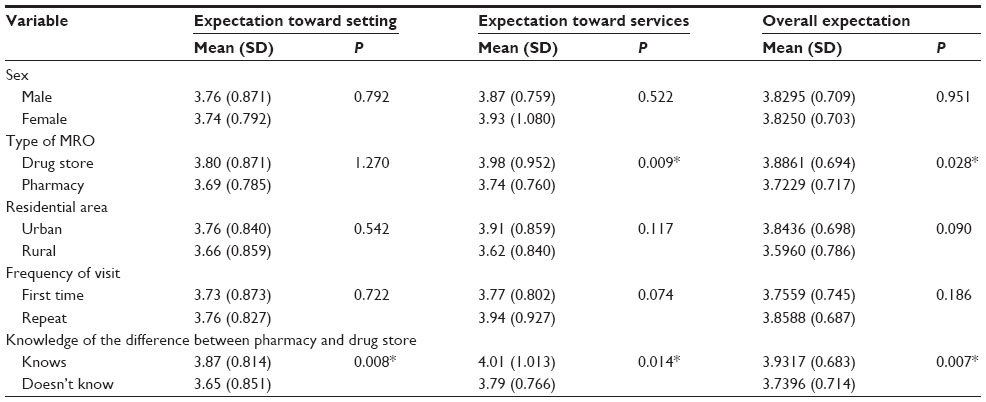 | Table 5 Statistical test (t-test) of differences between categories of respondents in expectation toward MROs, Gondar, 2014 |
There were significant overall expectation differences among groups with different levels of income (F (5,401) =3.667, P=0.004) (Table 3). Post hoc analysis indicated that groups with a monthly income of 1,500–2,499 ETB had higher expectation (mean =3.97) than did respondents with an income of less than 500 ETB (P=0.047). The one-way ANOVA test also revealed that there was a statistically significant difference in the overall expectation toward MROs among clients with different occupational status (F (6,385) =3.027, P=0.007) (Table 3). The post hoc test showed that the overall expectation toward MROs was higher in those who were government employees (mean =3.94) than in those who were students (mean =3.6), P=0.005.
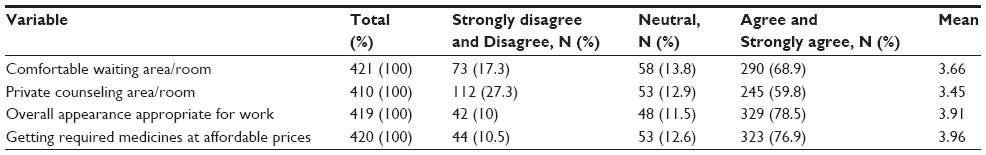
Clients’ satisfaction with MRO setting
The respondents had a relatively low mean satisfaction on the comfort and convenience of waiting area, cost of the medicine, and comfort and convenience of the counseling room, with a mean satisfaction of 2.78, 2.67, and 2.43, respectively. But they were satisfied on the waiting time (mean =3.65) (Table 6).
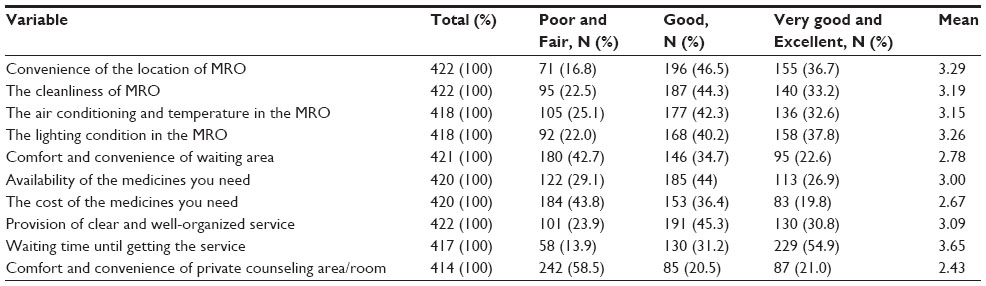 | Table 6 Percentage distribution of respondents’ satisfaction with MRO setting, Gondar, 2014 |
Clients’ satisfactions with MRO services
Among the parameters the participants rated low in their satisfaction level was the question whether pharmacy professionals’ main effort was to improve the former’s health and not to get a profit. In this parameter the participants’ mean satisfaction was 2.52. Most respondents claimed that pharmacy professionals did not advise about proper storage, initiate counseling without being asked for advice, or tell about side effects, with a mean satisfaction of 2.63, 2.74, and 2.67, respectively (Table 7).
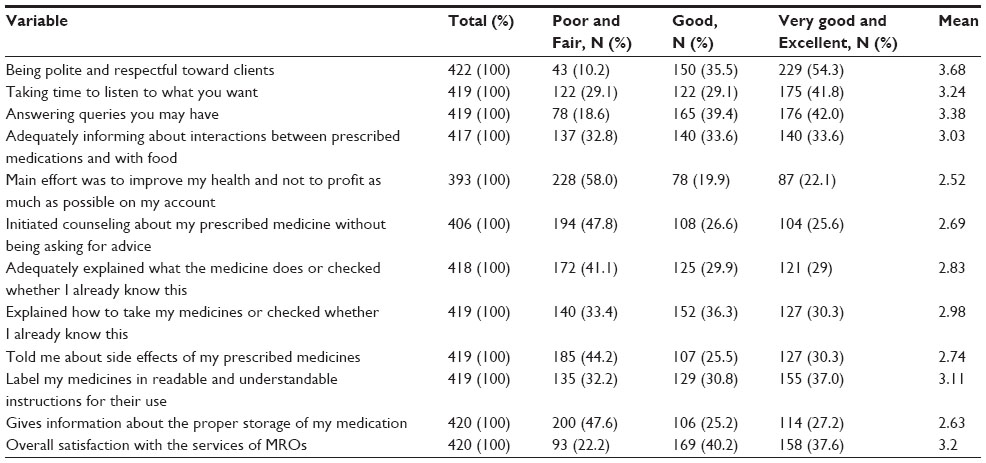 | Table 7 Percentage distribution of respondents’ satisfaction with MRO services, Gondar, 2014 |
There was a statistically significant difference in the satisfaction toward MRO services among clients with different reasons for visit (F (2,381) =5.866, P=0.003) (Table S1). Post hoc analysis showed the satisfaction of respondents to MRO services to be higher in those who took medicines for both (for self and others) (mean =3.17) compared with those who took for themselves (mean =2.96) (P=0.004).
Clients’ overall satisfaction with MROs
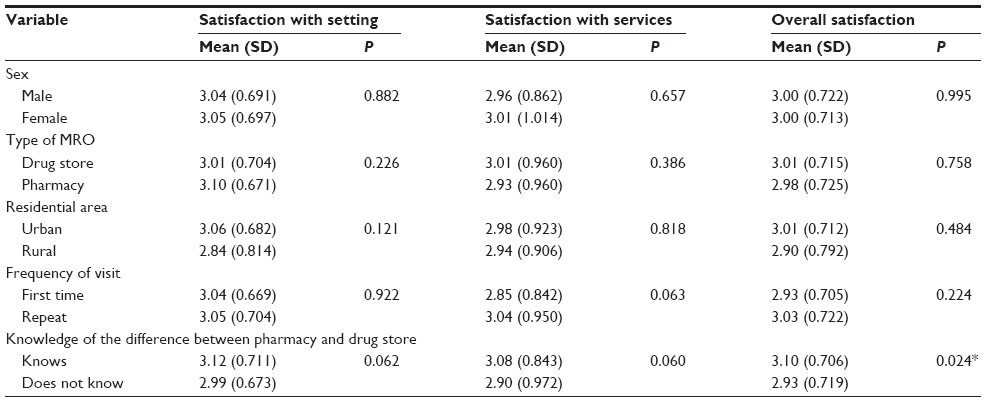
The respondents were considered as satisfied with the services in the MROs when the average was higher than 3 (a score considered as “Good”). The overall satisfaction of the respondents was 3.02. Respondents who claimed to know the difference between a pharmacy and a drug store reported a higher level of satisfaction (mean =3.1) than did respondents who claim they did not know (mean =2.93) (t=2.260, P=0.024) (Table S2).
Discussion
Assessing the level of expectations and satisfaction of clients with their health care services has become important globally.20 Similarly, considerable research supports using satisfaction rating to measure the quality of care from the patients’ perspective.21 Among the 422 participants, the overall mean expectation toward MRO setting and pharmacy professional services was high (mean =3.82). This showed a promising result for pharmacy professionals, as their role as health care providers seems to be understood by clients. Similar high levels of expectations from different aspects of community pharmacy services were reported by studies in Saudi Arabia and Spain.22,23
Fifty-seven percent of the respondents agreed that they expected pharmacy professionals to monitor the safe and effective use of medicines as well as the progress of clients’ health. In a pilot study in Qatar that interviewed clients, more than 70% of respondents disagreed that the pharmacy professional was expected to monitor the patients’ health progress to ensure the safe and effective use of medications. In contrast, the present study reported better awareness on the roles of pharmacy professionals.9
Two-thirds (66.6%) of the respondents said that they would seek the pharmacist’s advice in the case of minor illnesses. This was comparable with the findings in Jordan (63%) and Northern Ireland, which reported that 67% of the clients would not hesitate to ask the pharmacist for advice regarding the treatment of minor ailments.24,25 This finding can be considered as an indication of a potential area for the future in further developing and raising the standards of practice to meet these expectations among clients in the town.
A very high proportion (87%) of the participants agreed or strongly agreed that they expected pharmacy professionals to check the completeness and accuracy of the prescription. This might be related to the fact that filling prescriptions is the most common duty of pharmacy professionals known to clients as it is the major role currently.
There was a statistically significant difference in the overall expectation toward setting as well as services of MROs between the respondents who claimed to know the difference between a pharmacy and a drug store and those who claimed they did not. The mean expectation of respondents who claimed to know (3.93) is higher than the mean expectation of respondents who did not claim to know (3.74), with a P-value of 0.007. This may be because of better awareness among clients who claimed to know the difference about MROs, which in turn pushed up their expectations.
This study revealed that clients who visited drug stores had higher expectations toward the overall services of MROs (P=0.028). This may be due to a lack of knowledge on the difference between a pharmacy and a drug store, or there may not be actual service difference between a pharmacy and a drug store, or else the service quality of the drug store may be better.
The overall result of the study showed a significant difference of expectation among groups with different monthly income (P-value of 0.004). The post hoc analysis indicated that groups with a monthly income of 1,500–2,499 ETB had a higher overall expectation than those whose income was less than 500 ETB. This might have resulted as the majority of the respondents in this group were government employees (mean expectation =3.94, P=0.007) who had higher education and had good awareness toward MROs.
More than half of the respondents in this study were dissatisfied by the comfort and convenience of private counseling area; this might have resulted from the absence of private counseling area/room in the MROs.
A very large proportion (86.2%) of the study participants were satisfied with waiting time to get service; this could be explained by the fact that pharmacy professionals do not provide detailed information about drugs, as supported by other findings in this study (advice about side effects [mean =2.74] and about storage condition [mean =2.63]). Nearly half (44.8%) of the respondents were not comfortable with the cost of medicines; this could relate to the higher price of drugs in private MROs compared with reduced price of medicines in public/aid organizations’ MROs.
More than 70% of the respondents agreed that the pharmacy professionals took time to listen and answer their questions. This was very much higher than that reported in the Qatar study, which was 37% for the same question.9 About 42% of the respondents rated the question related to the idea that pharmacy professionals’ main effort was to improve their health instead of profiting on clients’ account as satisfactory. This was higher than the Qatar study report (28%) and the England study report (26%).9,11
About 90% of the respondents claimed that pharmacy professionals were polite and respectful toward clients. This might be explained through the idea that being polite and respectful toward customers improves business prospects, or it could show professional ethics being followed in this respect. Half of the respondents agreed that pharmacy professionals initiate advice without being asked. This is comparatively higher than the finding of the study in Saudi Arabia, which was 38.5%.22
Almost half of the respondents reported being dissatisfied as information regarding the storage of medicines was not provided to them. This might be pharmacy professionals’ ignorance in delivering such information with thought that the clients do know this information, or it might be related to the common dispensing shortcomings such as poor labeling and packaging/repackaging practices.26
This study showed that the overall satisfaction of the respondents was 60.5%, which was lower than the satisfaction rate of USA (85% satisfaction level).27 It was better than the findings reported in Zambia (a 36% satisfaction).28 This study showed an overall mean satisfaction of 3.02, which was better than that reported by the study conducted in Addis Ababa to assess the quality of pharmacy services in government hospitals (a mean satisfaction of 2.7).29
Statistical test (t-test) of the analysis showed a significant difference of satisfaction among respondents who claimed to know the difference between a pharmacy and a drug store. The mean satisfaction of those who claimed to know the difference was higher (P=0.024). This might be because clients who knew the difference had a better understanding of the services provided in the MROs.
Conclusion
In this study, the overall client expectation from MRO services was high. The highest expectation was found regarding checking prescriptions for completeness and accuracy, and the lowest went to monitoring safe and effective use of the medicines to ensure the progress of their health. The overall expectation of the respondents toward MROs was low in those who did not know the difference between a pharmacy and a drug store compared than in those who claimed to know the difference.
On the other hand, the overall satisfaction level of clients with MROs was found to be average. Areas of lower satisfaction level were found regarding comfort and convenience of private counseling area. A relatively high satisfaction level was reported regarding the pharmacy professionals’ polite approach and high respect and also the waiting time to get services. From these findings, it was recommended that the Gondar Town Health Bureau should take initiatives in providing regular supportive supervision to MROs to help them maintain the standard and quality of their settings and services, which will improve the satisfaction of their clients.
Acknowledgments
The authors acknowledge the support of the School of Pharmacy, College of Medicine and Health Sciences, University of Gondar, in facilitating the data collection process. The authors also appreciate the clients who participated in the study and the MROs for their cooperation in the data collection.
Disclosure
No financial support was gained in the conduct of this study. The authors report no conflicts of interest in this work.
References
Oparah BC, Kikanme LC. Consumer satisfaction with community pharmacies in Warri, Nigeria. Res Social Adm Pharm. 2006;2(4):499–511. | |
Donabedian A. Explorations in quality assessment and monitoring: the definition of quality and approaches to its assessment. Ann Arbor, MI: Health Administration 1992;3(5):123–125. | |
Sitzia J, Wood N. Patient satisfaction: a review of issues and concepts. Soc Sci Med. 1997;45:1829–1843. | |
Ware JE, Davies AR. Behavioral consequences of consumer dissatisfaction with medical care. Eval Program Plann. 1983;6:185–210. | |
Zastowny TR, Roghmann KJ, Cafferata GL. Patient satisfaction and the use of health services: explorations in causality. Med Care. 1989;27: 705–723. | |
Farris KB, Stenton SB, Samnani M, Samycia D. How satisfied are your patients? Can Pharm J. 2000;133(8):32–36. | |
Larson LN, Rovers JP, MacKeigan LD. Patient satisfaction with pharmaceutical care: update of a validated instrument. J Am Pharm Assoc. 2002;42:44–50. | |
Hovart N, Kos M. Development and initial validation of a partial satisfaction with pharmacy performance questionnaire (PSPPQ). Eval Health Prof. 2010; 33:197–215. | |
El Hajj MS, Salem S, Mansoor H. Public’s attitudes towards community pharmacy in Qatar: a pilot study. Patient Prefer Adherence. 2011;5: 405–422. | |
Kamei M, Teshima K, Fukushima, N, Nakamura T. Investigation of patients’ demand for community pharmacies: relationship between pharmacy services and patient satisfaction. Yakugaku Zasshi. 2001;121(3):215–220. | |
Hargie O, Morrow N, Woodman C. Consumer perceptions of and attitudes to community pharmacy services. Pharm J. 1992; 249,988–991. | |
Ethiopian Food Medicine and Health Care Administration and Control Authority (EFMHACA). Model Directive for Inspection and Licensing of Medicines Retail Outlets (in Amharic). Addis Ababa, Ethiopia. [Cited December 2013]. Available from: http://www.fmhaca.gov.et/documents/Directive%20%20for%20Medicine%20Manufucturing%20Establishmen%20%202013.pdf. Accessed April 20, 2014. | |
Desta Z, Abula T, Gebre-Yohannes A, Worku A. Drug prescribing patterns for outpatients in three hospitals in north-west Ethiopia. Ethiop J Health Dev. 2002;16(2):183–189. | |
Desta Z, Abula T, Beyene L, Fantahun M, Yohannes AG, Ayalew S. Assessment of rational drug use and prescribing in primary health facilities in northwest Ethiopia. East Afr Med J. 1997;74(12):758–763. | |
Federal Ministry of Health, World Health Organization. Rational Drug Use. Assessment of the Pharmaceutical Sector in Ethiopia, Federal Ministry of Health, World Health Organization; 2003. | |
Gondar Town Health Bureau. Report on the number of medicines retail outlets in Gondar town [unpublished report]; 2014. | |
Lwanga SK, Lemeshow S. Sample Size Determination for Health Studies: A Practical Manual. Geneva, Switzerland: World Health Organization; 1991:1–5. | |
Briesacher B, Corey R. Patient satisfaction with pharmaceutical services at independent and chain pharmacies. Am J Health Syst Pharm. 1997;54: 531–536. | |
IBM Corp. IBM SPSS Statistics for Windows, Version 21.0. Armonk, NY: IBM Corp. Released 2012. | |
Smith M, Engelbrecht B. Guide to assessing client satisfaction at district hospitals. A collaborative project between the National Department of Health and the Health Systems Trust; 2001. Available from: http://www.hst.org.za/sites/default/files/clientguide.pdf. Accessed April 17, 2014. | |
Ware JE, Davies AR, Rubin HR. Patients’ assessments of their care. In: The Quality of Medical Care: Information for Consumers. Washington, DC: US Office of Technology Assessment; 1988:231–247. | |
Al-Arifi M. Patients’ perception, views and satisfaction with pharmacists’ role as health care provider in community pharmacy setting at Riyadh, Saudi Arabia. Saudi Pharm J. 2012;20:323–330. | |
Gastelurrutia MA, de San Vicente OG, Erauncetamurgil O, Odriozola I, Ferna´ndez-Llimos´ F. Customers’ expectations and satisfaction with a pharmacy not providing advanced cognitive services. Pharm World Sci. 2006;28(6):374–376. | |
Wazaify M, Younes A, Abu-Gharbieh E, Tahaineh L. Societal perspectives on the role of community pharmacists and over-the-counter drugs in Jordan. Pharm World Sci. 2008;30:884–889. | |
McElnay JC, Nicholl AJ, Grainger Rousseau TJ. The role of the community pharmacist – a survey of public opinion in Northern Ireland. Int J Pharm Pract. 1993;2:95–100. | |
Food, Medicine and Healthcare Administration and Control Authority (FMHACA) of Ethiopia. Manual for Medicines Good Dispensing Practice. 2nd ed. Addis Ababa, Ethiopia. [Cited May 2012]. Available from: http://www.fmhaca.gov.et/documents/Medicines_Good_Dispensing_Manual_second_edition_2012.pdf. Accessed April 18, 2014. | |
Stergachis A, Maine LL, Brown L. The 2001 national pharmacy consumer survey. J Am Pharm Assoc. 2002;42:568–576. | |
Victor M. Client satisfaction with pharmacy care in Lusaca district, Zambia. Pharm World Sci. 32:145–147. | |
Eshetu E, Gedif T. Quality of pharmaceutical care in government hospitals of Addis Ababa, Ethiopia [Master’s Thesis]. Department of Pharmaceutics and Social Pharmacy, Addis Ababa University; 2010. |
Supplementary materials
 | Table S1 Statistical test (one-way ANOVA) of differences among categories of respondents in satisfaction toward MROs, Gondar, 2014 |
 | Table S2 Statistical test (t-test) of differences between categories of respondents in satisfaction with MROs, Gondar, 2014 |
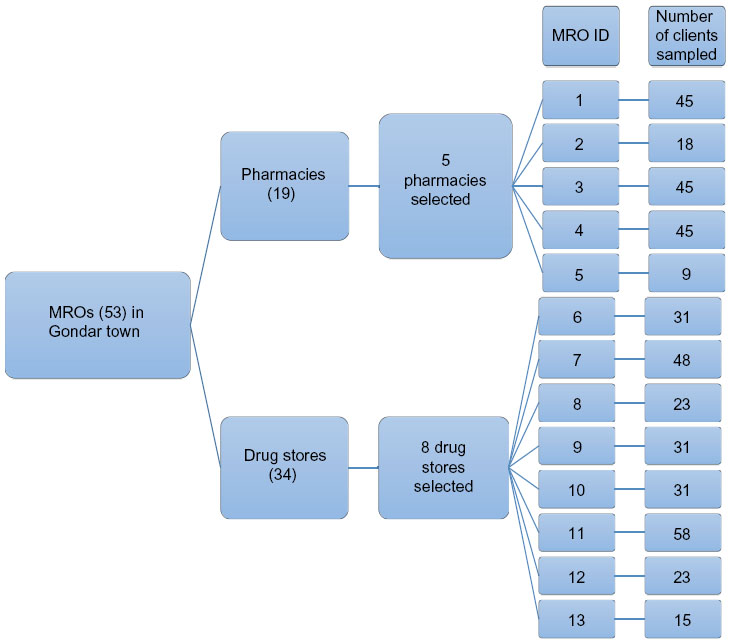 | Figure S1 Flowchart of sampling procedure (selected from each MRO using average daily client flow). |
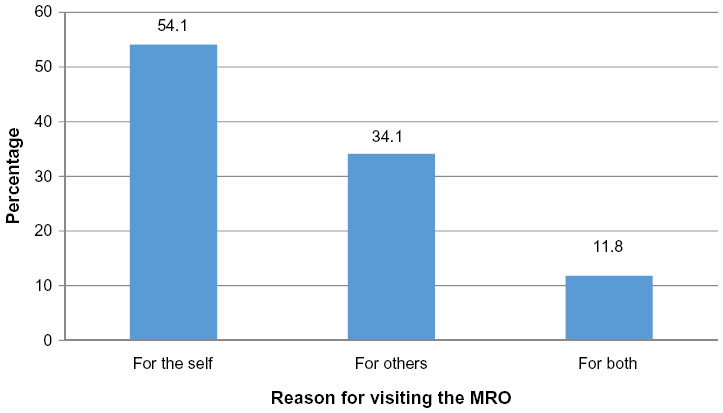 | Figure S2 Respondents’ reasons for visit to the MROs, Gondar, 2014. |
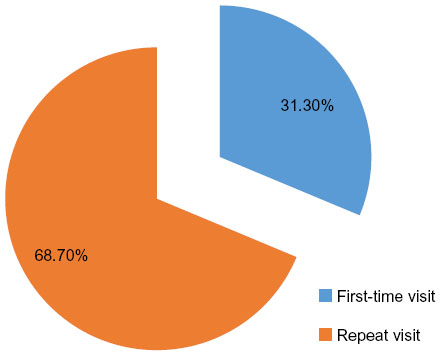 | Figure S3 Respondents’ response on the frequency of visit to the MROs, Gondar, 2014. |
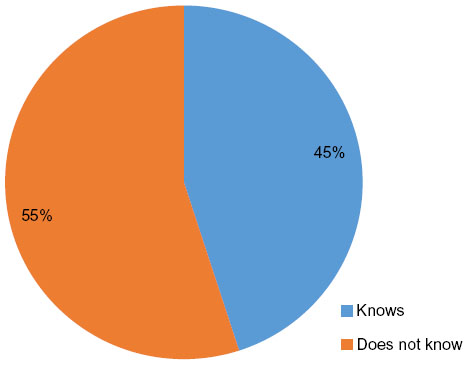 | Figure S4 Respondents’ response of knowledge on difference between pharmacy and drug store, Gondar, 2014. |
 © 2015 The Author(s). This work is published and licensed by Dove Medical Press Limited. The
full terms of this license are available at https://www.dovepress.com/terms
and incorporate the Creative Commons Attribution
- Non Commercial (unported, 3.0) License.
By accessing the work you hereby accept the Terms. Non-commercial uses of the work are permitted
without any further permission from Dove Medical Press Limited, provided the work is properly
attributed. For permission for commercial use of this work, please see paragraphs 4.2 and 5 of our Terms.
© 2015 The Author(s). This work is published and licensed by Dove Medical Press Limited. The
full terms of this license are available at https://www.dovepress.com/terms
and incorporate the Creative Commons Attribution
- Non Commercial (unported, 3.0) License.
By accessing the work you hereby accept the Terms. Non-commercial uses of the work are permitted
without any further permission from Dove Medical Press Limited, provided the work is properly
attributed. For permission for commercial use of this work, please see paragraphs 4.2 and 5 of our Terms.