Back to Archived Journals » Cell Health and Cytoskeleton » Volume 6
Classification of axonal subtypes based on cytoskeletal components
Authors Spector YZ, Zhao Q, Zhao X, Feuer W, Maravich P, Huang X
Received 5 November 2013
Accepted for publication 12 December 2013
Published 11 April 2014 Volume 2014:6 Pages 1—10
DOI https://doi.org/10.2147/CHC.S57081
Checked for plagiarism Yes
Review by Single anonymous peer review
Peer reviewer comments 2
Ye Z Spector,1,2 Qi Zhao,3 Xiaopeng Zhao,2 William J Feuer,2 Portia Lynn Maravich,2 Xiang-Run Huang1,2
1Department of Biomedical Engineering, College of Engineering, University of Miami, Miami, FL, USA; 2Department of Ophthalmology, Bascom Palmer Eye Institute, University of Miami, Leonard M Miller School of Medicine, Miami, FL, USA; 3Department of Ophthalmology, The Second Affiliated Hospital of Dalian Medical University, Dalian, Liaoning, People's Republic of China
Background: Retinal ganglion cells are often classified into different subtypes according to their morphology or physiological functions. The axons of RGCs contain three major cytoskeletal components: actin filaments (F-actin); microtubules; and neurofilaments (NFs). The contents of these components vary among axons. Our objective was to classify axons into subtypes based on the contents of cytoskeletal components and study their distributions across the retina in normal rodent retinas.
Methods: Whole-mounted retinas of female Wistar rats were stained with phalloidin to label F-actin, anti-β-tubulin monoclonal antibody to mark microtubules, and antineurofilament antibody to label NFs. A confocal laser scanning microscope was used to provide en face images of retinal nerve fiber bundles with a resolution of 0.24 µm/pixel. Staining intensity profiles across axons were obtained for each cytoskeletal component. Axonal subtypes were then determined from the relative contents, indicated by the staining intensity, of these components. Linear density was used to investigate topographical distribution of each subtype across the retina.
Results: Normal axons could be classified into seven subtypes – FMN, FM, FN, and MN subtypes, (in which at least two or three cytoskeletal components were intensely stained), and F, M, and N subtypes, (in which only one cytoskeletal component was intensely stained within an axon). The FMN subtype was the most abundant subtype. There was no preferential distribution of subtypes around the optic nerve head. However, the densities of the axonal subtypes that contained NFs were found significantly different in the central and peripheral retinal regions. Axonal sizes were subtype-dependent.
Conclusion: Axons of retinal ganglion cells can be classified into different subtypes, based on the contents of axonal cytoskeletal components. The classified subtypes will provide a new means to study selective damage of axonal ultrastructures in ocular neuropathic diseases.
Keywords: retina, cytoskeletal components, F-actin, microtubules, neurofilaments
Introduction
Retinal ganglion cells (RGCs) are the neurons located near the inner surface of the retina.1 A RGC consists of a cell body (or soma), short branching fibers called dendrites, and a long nerve fiber, known as an axon, which conducts electrical impulses away from the cell body.2 RGCs can be classified into different subtypes according to their morphology, including the RGCs’ soma sizes, dendritical branching patterns, or axonal myelination.3–11 They can also be classified into subtypes based on physiological functions, such as their responses to light or the propagation speed of electrical impulses along axons.3–5,12–14
Axons of RGCs contain three major types of protein filaments: actin filaments (F-actin), microtubules (MTs), and neurofilaments (NFs).15 These cytoskeletal components, individually and in association with each other, play an important role in axonal function and architecture.16–26 F-actin, as a major component maintaining cytoarchitecture, provides a substrate for the MT transport and affects the structural organization of MTs.18–20,26 MTs closely coordinate with F-actin to maintain cell shape and position cellular organelles. NFs are a major determinant of the calibers of myelinated axons. NFs also play a role in controlling MT polymerization. In turn, MTs are required for NF transport in growing axons.21,22
Electron microscopy (EM) demonstrates that the contents of MTs and NFs vary among axons.27,28 The relative numbers of MTs and NFs change with axonal caliber. In nonmyelinated axons of rat sciatic nerves, MTs are more numerous than NFs in small axons while larger axons contain more NFs than MTs. This finding suggests that MTs are a dominant component in small axons, while the NFs are dominant in larger axons.
In this study, we hypothesized that the content of each cytoskeletal component differed among the axons; hence, the axons could be classified into different subtypes based on the contents of these components. We used immunochemical staining of F-actin, MTs, NFs, and high-resolution confocal imaging to identify these components within axons and studied the distribution of the classified axonal subtypes across normal rat retinas.
Many ocular neuropathic diseases cause the degeneration of the axons of RGCs.29–35 The selective damage of axons is often found in these diseases. The classification of axonal subtypes based on the contents of cytoskeletal components will help to understand the underlying damage mechanisms of these neuropathic diseases.
Materials and methods
Tissue preparation and immunohistochemical staining
Female Wistar rats, about 6 months old and weighing 250–350 g, were used in the study. Animals were housed under a 12-hour light and a 12-hour dark cycle, with standard food and water provided ad libitum. All experiments adhered to The Association for Research in Vision and Ophthalmology Statement for the Use of Animals in Ophthalmic and Vision Research. The protocol for the use of animals was approved by the Animal Care and Use Committee of the University of Miami.
Animals were anesthetized with intraperitoneal ketamine (KetaVed by VEDCO, Inc.) (50 mg/kg) and xylazine (TranquiVed, by VEDCO, Inc., Saint Corporate, MO, USA) (5 mg/kg). Proparacaine 1% eye drops were applied to the eyeballs. The right eyes of each animal were quickly removed, and the animal was euthanized. Preparation of an isolated retina followed previously developed procedures.36,37 Briefly, an eye cup of 5 mm diameter that included the optic nerve was excised and placed in a dish with a warm (33°C–35°C) oxygenated physiologic solution. The retina was isolated free from the retinal pigment epithelium and choroid with a laboratory made glass probe and placed on a membrane (EMD Millipore, Billerica, MA, USA) with the photoreceptor side against the membrane. It was then fixed in a 4% paraformaldehyde solution (ElectroMicroscopySciences, Harfield, PA, USA) for 30 minutes at room temperature. After being rinsed thoroughly with phosphate-buffered saline (PBS) (VWR International, Radnor, PA, USA), the tissue was removed from the membrane for further immunohistochemical staining. Retinal orientation was documented by first marking the caudal side of the eye in situ with a skin marker and then, after dissection, cutting a notch into the eye cup and retinal edge at the marked position.
The cytoskeletal components of axons were simultaneously labeled with phalloidin (Invitrogen, Carlsbad, CA, USA) to stain F-actin, anti-β-tubulin monoclonal antibody (Sigma-Aldrich, St Louis, MO, USA) to mark MTs, and antineurofilament antibody (Sigma-Aldrich) to label NFs. The staining procedures have been described briefly here.32 A whole-mounted retina was permeabilized in PBS containing 0.8% TritonX-100 EMS for 1 hour, then followed by incubation in blocking serum (5% goat serum (Sigma-Aldrich) and 0.8% TritonX-100) for 1 hour at room temperature. The tissue was transferred into a primary antibody solution (1:500; rabbit antineurofilament; 200 kDa; Sigma-Aldrich) overnight at 4°C. After the tissue was washed in PBS (three changes of 10 minutes each), it was incubated in a mixed solution with the secondary antibody (1:250; Alexa Fluor® 647 goat antirabbit immunoglobulin G; Invitrogen) and anti-β-tubulin antibody (1:100; Cy3® conjugated; Sigma-Aldrich) overnight at 4°C. The tissue was washed again in PBS and then transferred into a solution of phalloidin (1:100, Alexa Fluor® 488 phalloidin; Invitrogen) for 1 hour at room temperature. The stained retina was rinsed thoroughly and mounted on a glass slide (VWR International) with an antifade mounting medium (VECTASHIELD®; Vector Laboratories, Inc., Burlingame, CA, USA). The prepared retina was stored at 4°C for confocal microscopy imaging.
To confirm the specificity of fluorescence labeling, control experiments were performed: 1) to examine autofluorescence, if any, normal retinas were mounted in the mounting medium without any immunohistochemical processing; 2) to determine the affinity of the secondary antibody for NF labeling, normal retinas were processed following regular procedures with deletion of incubation with the primary antibody for NFs; and 3) to test spectral bleed-through signals between the fluorescence detectors, four normal retinas were prepared with each stain individually and then imaged under typical confocal system settings used for normally stained retinas.
Confocal laser scanning imaging
A confocal laser scanning microscope (Leica TCS SP5; Leica Microsystems, Bannockburn, IL, USA) was used to provide en face images of whole-mounted fluorescently stained retinas. A 63× oil objective with a full field of view of 246 μm × 246 μm and a resolution limited to the sampling density of 0.24 μm/pixel was used. For each retina, four regions – dorsal, rostral, ventral, and caudal retina – around the optic nerve head (ONH) were imaged, with each region scanned by 2 × 3 or 3 × 2 tiled arrays. For a subset of retinas, a peripheral retinal region with a distance to the ONH center of around 1.25 mm was also scanned. For each array position, en face images were collected at evenly spaced positions in depth (1 μm apart in tissue) starting from the retinal nerve fiber layer (RNFL) surface through the retina to a depth at least including the RGC layer.
To identify the locations of the bundles imaged by a 63× objective in a whole-mounted retina, a 10× objective and a 40× oil objective were also used to take en face images at the middle depth of the RNFL. A tiled array of images with a 10× objective was taken to provide a full field view of a whole-mounted retina. A tiled array of images with a 40× objective, covering a retinal area of at least 1.2 mm2 with the ONH at the center, provided a clear view of the bundles and the blood vessels around the ONH. The en face images taken with 10×, 40×, and 63× objectives were registered by matching bundles and blood vessels shown in the images. The registered images were then used to identify the bundle and axon locations in the retina.
Except for detector gain, which was adjusted for each detector to display nerve fiber bundles at approximately full dynamic range without inducing spectral bleed-through between channels for each objective, the same confocal parameters were applied to all tissues. Scans of different fluorescent channels were collected sequentially. The image resolution and the Z-step size were read from the system with no additional calibration. No deconvolution was applied to the images.
Selection of bundle locations
Axonal subtypes were studied across the retina (Figure 1). To study the distributions of axonal subtypes along bundles, the bundles were selected in the central retina at distances of 0.25 mm, 0.35 mm, and 0.45 mm from the ONH center and in the peripheral retina at distances ranging from 1.0–1.5 mm. To determine subtype distribution around the ONH, bundles were chosen from four quadrants: dorsal; rostral; ventral; and caudal retina.
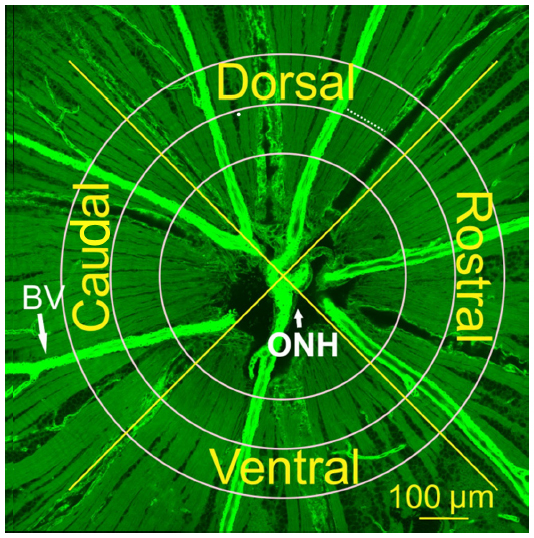 | Figure 1 Selection of bundle locations for studying axonal subtypes. |
Classification of axonal subtypes
Axonal subtypes were determined in en face images taken at a depth of 2–3 μm and 4–6 μm under the RNFL surface. With a 63× oil objective, F-actin, MTs, and NFs were identified as the thin strands running along bundles (Figure 2A–C). Staining intensity, which was measured by pixel values of images, reflected the contents of cytoskeletal components.
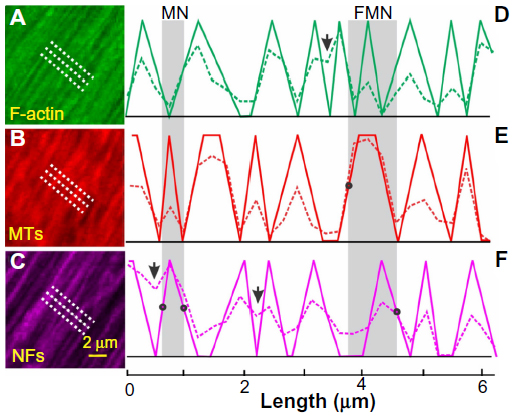 | Figure 2 Classification of axonal subtypes. |
To determine the relative contents of each cytoskeletal component across axons, three parallel lines, 1 μm apart across cytoskeletal strands, were defined within a selected nerve fiber bundle (Figure 2A–C). The lines were perpendicular to the long axis of the bundle. The intensity profiles along the parallel lines were obtained for each component. An average of these three intensity profiles (dashed lines in Figure 2D–F) was then used to describe the intensity distribution of a cytoskeletal component across axons. In this study, the classification was based on the relative contents of the individual components across axons within the same bundle. There was no quantitative comparison of contents between the different components and between the retinas; hence, the intensity unit was arbitrary.
To simplify the classification of axonal subtypes, an intensity profile was converted into a sawtooth binary curve with 1s for strong stain and 0s for weak stain (solid lines in Figure 2D–F). Note that – along a binary curve – the 0s, which corresponds to the gaps between the strands in an en face image, could indicate either low content of a cytoskeletal component or a lack of this specific component. For ambiguous intensity peaks (arrows in Figure 2D and F), they were visually examined in the corresponding en face images and determined as either separated strands or a single strand.
To determine an axon, a window with an adjustable width was moved along the sawtooth curves of F-actin, MTs, and NFs. The width of a window varied from 0.24–2 μm with the low value equal to the confocal imaging resolution and the high value determined by the reported axonal sizes found in rat RNFL.38 As illustrated in Figure 2D–F, the left side of a window was defined when it crossed at least one middle point of the upward side of the sawtooth without containing any downward sides that had more than one-half the height of the sawtooth; similarly, the right side of a window was defined when it crossed at least one middle point of the downward side of sawtooth without containing any upward sides that had more than one-half the height of the sawtooth.
Subtypes of axons were then determined by the intensely stained components. For instance, axons with intensely stained MTs and NFs (1s for MT and NF) but weak or no stain of F-actin (0s for F-actin) were classified as MN subtypes; axons with intensely stained F-actin, MTs, and NFs (1s for all three) were classified as FMN subtypes (gray areas in Figure 2D–F). A linear density of each subtype was calculated as the number of the subtype found along a line divided by the line length.
Note that in the experiments, the fluorescent staining of F-actin and MTs well penetrated the whole layer of RNFL near the ONH. An antibody stain of NFs was approximately uniform until a depth of around 8 μm under the RNFL surface and then the penetration gradually decreased with depth in thick bundles. In this study, subtypes were classified in the en face images, taken at depths of 2–3 μm and 4–6 μm under the RNFL surface for bundles both in the central and peripheral retinas. The paired Student’s t-test did not find a significant difference between the linear densities measured at the two depths (P>0.1). Hence, the average values of the linear densities measured at these depths were used in this study.
Determination of strand size and axon size
The strand size of a cytoskeletal component was defined as the full width at one-half of the maximum of the sawtooth. An axon size was defined as the width of a window described previously.
Repeatability and reproducibility test
To determine the repeatability and reproducibility of the classification of the axonal subtypes, two subjects were trained with the developed methods and then independently classified axonal subtypes of the same selected bundles. Both subjects repeated classification of the same bundles at least 2 weeks later.
Statistical analysis
For topographic distribution analysis, all the data were fitted in mixed linear models with location around the ONH as factors and distances to the ONH included as a covariate. Each rat was also included as a random effect. The paired measurements were compared with the paired Student’s t-test for means. The significance level was set at P<0.05.
The averaged values are reported as mean ± standard error of the mean.
Results
Cytoskeletal components in retinal nerve fiber bundles
Axonal F-actin, MTs, and NFs were identified as bright stripes in en face confocal images by fluorescent staining. Each labeled structure demonstrated tightly packed retinal nerve fiber bundles that converged into the ONH (Figure 3A–C). Within bundles, cytoskeleton appeared as thin, long strands running along the bundles as shown in Figure 3D–F, a magnified view of the bundle region outlined in Figure 3A–C. The size of strands ranged from 0.2–1.5 μm, which was within the range of the axonal diameter.38–40 The result indicates that the strands of cytoskeletal components represent axons within retinal nerve fiber bundles.
 | Figure 3 En face images of a normal RNFL. |
Strands with intensely stained F-actin, MTs, and NFs may or may not colocalize with each other as shown in the merged images of Figure 3G–I. For example, Figure 3H shows several intensely stained F-actin and NF strands that were interleaved within a bundle.
Control experiments showed that retinas had weak autofluorescence, which did not localize to any specific retinal layers or cytoskeletal components, and no significant spectral bleed-through signals were noted between the three fluorescence detectors. The control experiment also confirmed the specificity of the secondary antibody for NFs labeled by the primary antibody.
Axonal subtypes across the retina
The strand localization of the cytoskeletal components determined the subtype of an axon. By using converted intensity profiles, as illustrated in Figure 2D–F, axons were classified into seven subtypes: FMN, FM, FN, MN, F, M, and N subtypes. A total of 2,238 axons in the 60 bundles were classified in the central retina. For each selected nerve fiber bundle, at least 15 axons were analyzed. Figure 4A summarizes the linear densities of classified axonal subtypes in the central retina. The densities combined all measurements from different distances and quadrants. The FMN subtype, which contained all intensely stained components, had the highest density among all subtypes, followed by the FM and MN subtypes.
 | Figure 4 Axonal subtypes in normal rat retinas. |
In the central retina around the ONH, the FMN subtype was also the most abundant subtype, which took up 42% of the total counted axons. A total of 79% axons contained at least two intensely stained components (FMN, FM, FN, and MN subtypes). For subtypes with one intensely stained component (F, M, and N subtypes), each took up <8%. A percentage distribution of these subtypes is summarized in Figure 4B.
It is worthwhile to point out that the classified subtypes indicated the dominant components in axons and did not suggest the outright exclusion of other components within the same axons. For instance, the subtype FM, which contained intensely stained F-actin and MT strands without identifiable NF strands, was dominated by F-actin and MTs, but it may also contain NFs, but with comparative low content.
Distribution of axonal subtypes around the ONH and along bundles
To study the distribution of each subtype around the ONH, the data displayed in Figure 4A were regrouped by combining measurements taken at different radii. For each quadrant, at least 14 bundles were included. Figure 4C shows the distribution of each subtype around the ONH. The densities of all subtypes did not changed significantly across the retinal quadrants in the central retina (P>0.05).
To study distributions of axonal subtypes along bundles, the data in Figure 4A were regrouped by combining the measurements from all retinal quadrants. At least 29 bundles were included in each radius. As shown in Figure 4D, there was no significant change of the linear density at distances ranging from 0.25–0.45 mm (P>0.11).
To compare subtype distribution in the central and peripheral retinas, 48 bundles in the same eight retinas were also studied with bundles selected at the distances of 1.0–1.5 mm from the ONH center. Figure 4E shows that the linear densities of the subtypes which had low or no contents of NFs – that is, subtypes FM, F, and M – were not significantly different between the central and peripheral retinas, while the linear densities of the subtypes FN, MN, and N were significantly lower in the peripheral region (P<0.005). However, the linear density of the subtype FMN was significantly higher in the peripheral region (P=0.03). The linear density of all subtypes that contained NF strands was found significantly higher in the central retina.
Relationship between axonal subtype and size
The sizes of F-actin, MT, and NF strands, 0.45±0.04 μm, 0.46±0.04 μm, and 0.49±0.04 μm respectively, in the central retina were not significantly different (P>0.5). Similar results were found in the peripheral retina. No significance was found between the sizes of each axonal subtype in the central and the peripheral retinas (P>0.11).
Figure 5 shows the relationship between the axonal subtype and the size. The axonal size was highly significantly different by subtype with the size of subtype FMN significantly higher than all the other subtypes (P<0.005).
 | Figure 5 Axonal sizes of subtypes. |
Repeatability and reproducibility of classification of axonal subtypes
Also, 20 bundles at three retinas were used to determine repeatability and reproducibility of classification of axonal subtypes. Table 1 shows two repeat measurements by subject 1. Similar results of subject 2 were not shown. Linear densities of each subtype measured by the same subject at different times were not significantly different. Table 1 also compares the linear densities of subtypes measured by the two subjects. The linear densities were the average of two measurements by each subject. No significant difference was found between the measurements by the subjects.
 | Table 1 Repeatablility and reproducibility of linear densities of axonal subtypes |
Discussion
F-actin, MTs, and NFs closely associate with each other to maintain the rigid architecture and provide the function aid of axons.16–26 The EM images, however, demonstrate that the content of each cytoskeletal component differs among axons.14,28,41,42 The relative contents of MTs and NFs vary with axonal calibers.27,28 The EM provides identification of individual cytoskeletal components in axons and allows quantitative measurements of each component within axons. However, EM provides a limited number of axons to be examined. Also, it is difficult to locate analyzed axons in the retina, limiting a whole view of cytoskeletal distribution across the retina. In this study, we used immunohistochemical staining and confocal imaging to classify subtypes of axons based on the contents of F-actin, MTs, and NFs within axons. Because whole-mounted retinas were used, the distributions of axonal subtypes were investigated across the whole retina.
With high-resolution confocal imaging, strands of F-actin, MTs, and NFs were found running along nerve fiber bundles.43–46 The strand sizes were within the range of axonal size. Note that confocal imaging did not identify a single cytoskeletal component as imaged by EM. The strand of a component in confocal images represented a number of this component clustering together within an axon. In normal rat retinas, an axon may or may not contain all strands of F-actin, MTs, and NFs (Figure 3G–I). This study developed a method that used an intensity profile of fluorescent staining to identify axons that contained F-actin, MTs, and/or NFs strands. We found that not all axons contained strands of F-actin, MTs, and NFs, that is, the subtype of FMN. However, the FMN subtype was the most abundant subtype axon in normal rat retinas. About 79% axons contained at least two or more cytoskeletal strands, indicating that most of the axons require at least two dominant cytoskeletal components. The space between strands, represented by a low value of fluorescent intensity, may not suggest noncontent of a cytoskeletal component; rather a subtype with one component, for instance the subtype F, may contain MTs and NFs but with very low contents comparing with their contents in the neighboring axons.
Note that the intensity variation along profiles (Figure 2D–F) reflected relative contents of an individual component among axons; yet the intensity did not provide a quantitative measurement of the component because of the nonlinear relationship between fluorescence intensity and antibody binding. More accurate methods, such as EM, should be used to obtain the quantitative measurements of each component in axonal subtypes. It is also important to point out that NFs are assemblies of three protein subunits: neurofilament-light (NF-L); neurofilament intermediate (NF-M); and neurofilament-heavy (NF-H).47 In this study, the staining of NFs identified NF-H only. Because the three protein units are usually associated together,47,48 staining all three subunits of NFs may result in similar results found in this study.
In this study, the linear densities of subtypes were used to quantitatively describe the distributions of axonal subtypes across the retina. The linear density of each subtype was not significantly different around the ONH. The result suggests that there is no preferential distribution of any axonal subtype around the ONH in normal rat retinas. However, studies by others find that the topographic distribution of RGCs varies substantially across the retina and among animals as well.43,49–51 The uniform distribution of axonal subtypes found in this study could be due to averaging the linear densities across different retinas.
By comparing the central and peripheral retinas, the density of the FMN subtype was significantly lower in the central retina, while the densities of any other subtypes that contained NF strands were significantly higher in the same region. The linear densities of all subtypes that contained NF strands were significantly higher in the central retina. Difference of a subtype’s density in central and peripheral retinas may suggest that the axonal architecture and the function are different in these regions.14,43,49–51 The study also found that the size of axons associated with classified subtypes, which is consistent with the evidence that the axonal size can serve as a reasonable parameter to distinguish different classes of RGCs.52,53
The current study focused on the development of a new concept of the RGC classification method. Converted intensity profiles were manually determined and visually checked with confocal images. In future studies, robust and automated classification methods should be developed, and the manual method developed in this study will be used to validate any new methods. More importantly, future studies should investigate the association between axonal subtypes and functions and understand the relationship between axonal subtypes and RGC subtypes classified by other methods.3–14
To the authors’ best knowledge, RGCs have not been classified based on the contents of axonal cytoskeletal components. The classification method developed in this study will be useful to study interrelationships between different cytoskeletal components in axons. In normal axons, F-actin is more directly coupled to MTs to maintain axonal architecture and provide axonal transport. In contrast, F-actin is not essential for NF transport; rather, MTs are the substrate for NF transport.17,20,24 The relative contents of these components in axons may indicate functional requirements for each component.
The variation of component contents in axons should suggest that these axons play different roles in maintaining normal axonal function. The classification method will also provide a new means to investigate selective damage of axons in many ocular neuropathic diseases, including glaucoma.29–35 Preferential distortion of cytoskeletal components happens in the optic nerve with early glaucomatous damage.29,31 In the central retina, distortion of axonal F-actin occurs prior to the change of MTs and NFs.32 These findings suggest that each cytoskeletal component responds differently to disease damage. The classification of axons based on the contents of cytoskeletal components will provide an enhanced understanding of damage mechanisms of axons in glaucoma and other ocular neuropathic diseases.
Acknowledgments
This study was supported by US National Institutes of Health grant R01-EY019084 and BrightFocus Foundation (formerly the American Health Assistance Foundation) G2008-033. This study was also supported by a US National Institutes of Health Center grant P30-EY014801, the US Department of Defense Career Development Award, and an unrestricted grant from Research to Prevent Blindness, Inc.
Disclosure
The authors report no conflicts of interest in this work.
References
Purves D, Augustine GJ, Fitzpatrick D, Hall WC, LaMantia AS, White LE. Vision: The Eye In: Neuroscience. 5th ed. Sunderland, MA: Sinauer Associates; 2011; Chapter 11, page 229. | |
Peters A, Palay SL, Webster H. The Fine Structure of the Nervous System: Neurons and Their Supporting Cells. 3rd ed. New York: Oxford University Press; 1991. | |
Sernagor E, Eglen SJ, Wong RO. Development of retinal ganglion cell structure and function. Prog Retin Eye Res. 2001;20(2):139–174. | |
Wässle H, Boycott BB. Functional architecture of the mammalian retina. Physiol Rev. 1991;71(2):447–480. | |
Rodieck RW. The First Steps in Seeing. Sunderland, MA: Sinauer Associates; 1998. | |
Garraghty PE, Sur M. Competitive interactions influencing the development of retinal axonal arbors in cat lateral geniculate nucleus. Physiol Rev. 1998;73(3):529–545. | |
Yamagata M, Sanes JR. Lamina-specific cues guide outgrowth and arborization of retinal axons in the optic tectum. Development. 1995;121(1):189–200. | |
Friedlander MJ, Tootle JS. Postnatal anatomical and physiological development of the visual system. In: Coleman JR, editor. Development of Sensory Systems in Mammals. New York: Wiley-Interscience; 1990:61–124. | |
Münch M, Kawasaki A. Intrinsically photosensitive retinal ganglion cells: classification, function and clinical implications. Curr Opin Neurobiol. 2013;26(1):45–51. | |
Kim TJ, Jeon CJ. Morphological classification of parvalbumin- containing retinal ganglion cells in mouse: single-cell injection after immunocytochemistry. Invest Ophthalmol Vis Sci. 2006;47(7):2757–2764. | |
Fletcher LN, Coimbra JP, Rodger J, et al. Classification of retinal ganglion cells in the southern hemisphere lamprey Geotria australis (Cyclostomata). J Comp Neurol. Epub July 29, 2013. | |
Dacey DM. Primate retina: cell types, circuits and color opponency. Prog Retin Eye Res. 1999;18(6):737–763. | |
Fukuda Y. A three-group classification of rat retinal ganglion cells: histological and physiological studies. Brain Res. 1977;119(2):327–334. | |
Fukuda Y, Watanabe M, Wakakuwa K, Sawai H, Morigiwa K. Intraretinal axons of ganglion cells in the Japanese monkey (Macaca fuscata): conduction velocity and diameter distribution. Neurosci Res. 1988;6(1):53–71. | |
Darnell J, Lodish H, Baltimore D. Molecular Cell Biology. New York: Scientific American Books; 1990. Available from: http://www.ncbi.nlm.nih.gov/books/NBK21475/. Accessed February 7, 2014. | |
Sato M, Leimbach G, Schwarz WH, Pollard TD. Mechanical properties of actin. J Biol Chem. 1985;260(14):8585–8592. | |
Fath KR, Lasek RJ. Two classes of actin microfilaments are associated with the inner cytoskeleton of axons. J Cell Biol. 1988;107(2):613–621. | |
Goode BL, Drubin DG, Barnes G. Functional cooperation between the microtubule and actin cytoskeletons. Curr Opin Cell Biol. 2000;12(1):63–71. | |
Zhou FQ, Waterman-Storer CM, Cohan CS. Focal loss of actin bundles causes microtubule redistribution and growth cone turning. J Cell Biol. 2002;157(5):839–849. | |
Hasaka TP, Myers KA, Baas PW. Role of actin filaments in the axonal transport of microtubules. J Neurosci. 2004;24(50):11291–11301. | |
Hoffman PN, Cleveland DW, Griffin JW, Landes PW, Cowan NJ, Price DL. Neurofilament gene expression: a major determinant of axonal caliber. Proc Natl Acad Sci U S A. 1987;84(10):3472–3476. | |
Hoffman PN. Review: the synthesis, axonal transport, and phosphorylation of neurofilaments determine axonal caliber in myelinated nerve fibers. Neuroscientist. 1995;1(2):76–83. | |
Cooper GM. Structure and organization of actin filaments. In: The Cell: A Molecular Approach. 2nd ed. Sunderland, MA: Sinauer Associates; 2000. | |
Dent EW, Kalil K. Axon branching requires interactions between dynamic microtubules and actin filaments. J Neurosci. 2001;21(24):9757–9769. | |
Etienne-Manneville S. Microtubules in cell migration. Annu Rev Cell Dev Biol. 2013;29:471–499. | |
Wehrle-Haller B, Imhof BA. Actin, microtubules and focal adhesion dynamics during cell migration. Int J Biochem Cell Biol. 2003;35(1):39–50. | |
Friede RL, Samorajski T. Axon caliber related to neurofilaments and microtubules in sciatic nerve fibers of rats and mice. Anat Rec. 1970;167(4):379–388. | |
Peters A, Vaughn JE. Microtubules and filaments in the axons and astrocytes of early postnatal rat optic nerves. J Cell Biol. 1967;32(1):113–119. | |
McKerracher L, Essagian C, Aguayo AJ. Temporal changes in beta-tubulin and neurofilament mRNA levels after transection of adult rat retinal ganglion cell axons in the optic nerve. J Neurosci. 1993;13(6):2617–2626. | |
Villegas-Pérez MP, Vidal-Sanz M, Bray GM, Aguayo AJ. Influences of peripheral nerve grafts on the survival and regrowth of axotomized retinal ganglion cells in adult rats. J Neurosci. 1988;8(1):265–280. | |
Balaratnasingam C, Morgan WH, Bass L, Cringle SJ, Yu DY. Time-dependent effects of elevated intraocular pressure on optic nerve head axonal transport and cytoskeleton proteins. Invest Ophthalmol Vis Sci. 2008;49(3):986–999. | |
Huang X, Kong W, Zhou Y, Gregori G. Distortion of axonal cytoskeleton: an early sign of glaucomatous damage. Invest Ophthalmol Vis Sci. 2011;52(6):2879–2888. | |
Jakobs TC, Libby RT, Ben Y, John SW, Masland RH. Retinal ganglion cell degeneration is topological but not cell type specific in DBA/2J mice. J Cell Biol. 2005;171(2):313–325. | |
Fu CT, Sretavan D. Laser-induced ocular hypertension in albino CD-1 mice. Invest Ophthalmol Vis Sci. 2010;51(2):980–990. | |
Huang XR, Knighton RW. Altered F-actin distribution in retinal nerve fiber layer of a rat model of glaucoma. Exp Eye Res. 2009;88(6):1107–1114. | |
Huang XR, Knighton RW, Shestopalov V. Quantifying retinal nerve fiber layer thickness in whole-mounted retina. Exp Eye Res. 2006;83(5):1096–1101. | |
Knighton RW, Huang XR. Visible and near-infrared imaging of the nerve fiber layer of the isolated rat retina. J Glaucoma. 1999;8(1):31–37. | |
Hildebrand C, Waxman SG. Regional node-like membrane specializations in non-mylineated axons of rat retinal nerve fiber layer. Brain Res. 1983;258(1):23–32. | |
Drenhaus U, von Gunten AV, Rager G. classes of axons and their distribution in the optic nerve of the tree shrew (Tupaia belangeri). Anat Rec. 1997;249(1):103–116. | |
Stone J, Holländer H. Optical nerve axon diameters measured in the cat retina: some functional considerations. Exp Brain Res. 1971;13(5):498–503. | |
Sugimoto T, Fukuda Y, Wakakuwa K. Quantitative analysis of a cross-sectional area of the optic nerve: a comparison between albino and pigmented rats. Exp Brain Res. 1984;54(2):266–274. | |
O’Connor TM, Houston LL, Samson F. Stability of neuronal microtubules to high pressure in vivo and in vitro. Proc Natl Acad Sci. 1974;71(10):4198–4202. | |
Soto I, Pease ME, Son JL, Shi X, Quigley HA, Marsh-Armstrong N. Retinal ganglion cell loss in a rat ocular hypertension model is sectorial and involves early optic nerve axon loss. Invest Ophthalmol Vis Sci. 2011;52(1):434–441. | |
Villegas-Perez M, Mayor-Torroglosa S, Salazar JJ, et al. Laser-induced ocular hypertension causes an alteration of the retrograde axoplasmic transport in adult rats. Invest Ophthalmol Vis Sci. 2005;46(5):1234. | |
Ou B, Ohno S, Tsukahara S. Ultrastructural changes and immunocytochemical localization of microtubule-associated protein 1 in guinea pig optic nerves after acute increase in intraocular pressure. Invest Ophthalmol Vis Sci. 1998;39(6):963–971. | |
Balaratnasingam C, Morgan WH, Bass L, Matich G, Cringle SJ, Yu DY. Axonal transport and cytoskeletal changes in the laminar regions after elevated intraocular pressure. Invest Ophthalmol Vis Sci. 2007;48(8):3632–3644. | |
Lee MK, Cleverland DW. Neuronal intermediate filaments. Annu Rev Neurosci. 1996;19:187–217. | |
Ruiz-Ederra J, García M, Hicks D, Vecino E. Comparative study of the three neurofilament subunits within pig and human retinal ganglion cells. Mol Vis. 2004;10:83–92. | |
Danias J, Shen F, Goldblum D, et al. Cytoarchitecture of the retinal ganglion cells in the rat. Invest Ophthalmol Vis Sci. 2002;43(3):587–594. | |
Danias J, Shen F, Kavalarakis M, et al. Characterization of retinal damage in the episcleral vein cauterization rat glaucoma model. Exp Eye Res. 2006;82(2):219–228. | |
Nadal-Nicolás FM, Jiménez-López M, Sobrado-Calvo P, et al. Brn3a as a marker of retinal ganglion cells: qualitative and quantitative time course studies in naive and optic nerve-injuried retinas. Invest Ophthalmol Vis Sci. 2009;50(8):3860–3868. | |
Williams RW, Chalupa LM. An analysis of axon caliber within the optic nerve of the cat: evidence of size groupings and regional organization. J Neurosci. 1983;3(8):1554–1564. | |
Fitzgibbon T, Reese BE. Organization of retinal ganglion cell axons in the optic fiber layer and nerve of fetal ferrets. Vis Neurosci. 1996;13(5):847–861. |
 © 2014 The Author(s). This work is published and licensed by Dove Medical Press Limited. The
full terms of this license are available at https://www.dovepress.com/terms
and incorporate the Creative Commons Attribution
- Non Commercial (unported, 3.0) License.
By accessing the work you hereby accept the Terms. Non-commercial uses of the work are permitted
without any further permission from Dove Medical Press Limited, provided the work is properly
attributed. For permission for commercial use of this work, please see paragraphs 4.2 and 5 of our Terms.
© 2014 The Author(s). This work is published and licensed by Dove Medical Press Limited. The
full terms of this license are available at https://www.dovepress.com/terms
and incorporate the Creative Commons Attribution
- Non Commercial (unported, 3.0) License.
By accessing the work you hereby accept the Terms. Non-commercial uses of the work are permitted
without any further permission from Dove Medical Press Limited, provided the work is properly
attributed. For permission for commercial use of this work, please see paragraphs 4.2 and 5 of our Terms.