Back to Journals » Clinical Ophthalmology » Volume 12
Circumpapillary structure-function relationships with microperimetry and spectral domain optical coherence tomography in glaucoma: a pilot study
Authors Kita Y ![]() , Holló G
, Holló G ![]() , Murai A, Kita R, Saito T, Hirakata A
, Murai A, Kita R, Saito T, Hirakata A
Received 6 September 2018
Accepted for publication 29 October 2018
Published 6 December 2018 Volume 2018:12 Pages 2535—2544
DOI https://doi.org/10.2147/OPTH.S186739
Checked for plagiarism Yes
Review by Single anonymous peer review
Peer reviewer comments 2
Editor who approved publication: Dr Scott Fraser
Yoshiyuki Kita,1 Gábor Holló,2 Akiko Murai,1 Ritsuko Kita,1 Tsunehiro Saito,1 Akito Hirakata1
1Department of Ophthalmology, Kyorin University School of Medicine, Tokyo, Japan; 2Department of Ophthalmology, Semmelweis University, Budapest, Hungary
Purpose: To compare the relationships between circumpapillary microperimetry (MP)-sensitivity measurements and various circumpapillary retinal thickness parameters in healthy and primary open-angle glaucoma (POAG) eyes.
Methods: In 14 eyes of 14 healthy subjects and 22 early–moderate POAG eyes of 22 patients, circumpapillary optical coherence tomography thickness measurements (RS-3000 Advance OCT, NIDEK) of the retinal nerve fiber layer (cpRNFL), total retina (cpTR), and ganglion cell complex (cpGCC) and outer retina (cpOR) and circumpapillary MP-sensitivity measurements (MP-3 microperimeter, NIDEK) were made in 12 sectors of identical circumpapillary circles. The structure-function relationship was investigated in each sector.
Results: Statistically significant correlations with circumpapillary MP-sensitivity values were found for cpRNFL in five sectors, cpTR in nine sectors, cpGCC in nine sectors, and cpOR in three sectors. The structure-function relationship was strong (r=0.4–0.69) in three sectors for cpRNFL, in six for cpTR, in four for cpGCC, and in one for cpOR. The relationship was very strong (r>0.7) in one sector for cpRNFL, cpTR, and cpGCC, and in no sectors for cpOR. The very strong relationships all occurred in sector 5 (inferotemporal sector).
Conclusion: In our pilot study, the circumpapillary structure-function relationship was more extensive for cpTR thickness and cpGCC thickness than for cpRNFL thickness, which suggests that the former parameters may require greater attention in structure-function research into glaucoma.
Keywords: circumpapillary ganglion-cell complex, circumpapillary total retina thickness, circumpapillary retinal nerve-fiber-layer thickness, glaucoma, microperimetry sensitivity, structure-function relationship
Introduction
Microperimetry (MP) is a relatively new technology that allows high-precision investigations of retinal sensitivity. Most MP investigations address the macula region to obtain a better understanding of the clinical features of age-related macular degeneration (AMD), other macular diseases, and/or glaucoma.1–5 Circumpapillary MP (cpMP) is a recent focus within MP.6 In cpMP, retinal sensitivity is studied around a predefined circle around the center of the optic nerve head (ONH).6 The measuring circle used in cpMP avoids the macular area, which potentially allows clinicians to use the technique in eyes with macular disease. In glaucoma research, cpMP offers a useful new way to study retinal function, particularly when macular function is negatively influenced by AMD, one of the most common eye diseases among the elderly. Unfortunately, AMD is common in the open-angle glaucoma (OAG) population.7,8 Therefore, finding a method for functional evaluation of glaucoma and structure-function investigations that avoids the macular area is of great clinical importance.
In a recent pilot study, we compared the diagnostic performance of cpMP sensitivity and circumpapillary retinal nerve fiber layer (cpRNFL) thickness in 12 equally sized sectors of the same measuring circle in Japanese eyes using an MP-3 microperimeter and RS-3000 Advance optical coherence tomography (OCT) system.6 We found favorable diagnostic performance and strong correlations, particularly in the inferotemporal peripapillary area, which is known to be most severely affected by glaucomatous deterioration. We also found higher diagnostic accuracy for glaucoma using the circumpapillary ganglion cell complex (cpGCC) than with cpRNFL thickness.9 This result suggests that the relationship between cpMP-sensitivity values and cpGCC (a novel parameter) may be stronger than that between cpMP-sensitivity values and cpRNFL thickness (an established parameter). Therefore, in the current investigation we compared circumpapillary structure-function relationships between cpMP sensitivity and four circumpapillary OCT parameters: total retinal (cpTR) thickness, cpGCC thickness, cpRNFL thickness, and outer retinal (cpOR) thickness.
Materials and methods
This was a prospective study. It included 36 consecutive Japanese patients (22 glaucoma patients and 14 healthy subjects) who underwent examinations at Kyorin University Hospital (Tokyo, Japan) between November 2016 and June 2017. The study protocol was approved by the institutional review board for human research at Kyorin University and conformed to the Declaration of Helsinki. All subjects were scheduled to undergo cross-sectional examinations and provided written informed consent before entering the study. Half the subjects in the current study participated in our previous investigation addressing the capacity of cpMP to detect glaucoma.6 One randomly selected eye in each subject was examined in this study. Complete ophthalmologic examinations, including a dilated stereoscopic fundus examination, gonioscopy, visual acuity testing, standard automated perimetry, Goldmann applanation tonometry, and slit-lamp biomicroscopy, were performed in all subjects. An autorefractor/keratometer was used to assess noncycloplegic refraction. The resultant data were converted into spherical equivalents, which were calculated as spherical power (in diopters) plus 50% of the cylindrical power. The Swedish interactive threshold algorithm 30-2 standard test was used for perimetry evaluations, which were conducted using a Humphrey visual field analyzer (HFA; Humphrey-Zeiss Systems, Dublin, CA, USA). False-positive and false-negative frequencies <15% and a fixation-loss rate <20% were used to indicate reliable visual-field test results. Findings used to identify glaucomatous visual fields were a hemifield defect or generalized depression, a nasal step, inferior and/or superior paracentral or arcuate scotoma, an abnormal result in the glaucoma hemifield test, a pattern standard deviation (PSD) <5%, or three nonperipheral test sites with abnormal sensitivity thresholds (<5% probability of being normal), with one site demonstrating pattern deviation <1%.10
The healthy control group was made up of subjects whose ONH appeared normal and who exhibited reliable normal visual-field test results, clear optical media, normal open anterior-chamber angles, normal intraocular pressure (IOP) (<21 mmHg), best-corrected visual acuity ≥20/20, refractive cylindrical error <3 D, and refractive spherical error of +3 to −6 D in both eyes. A normal ONH was defined as when a stereoscopic fundus examination revealed an interocular difference <0.2 in the vertical cup-to-disc ratio, a vertical cup-to-disc ratio ≤0.6, and a uniform neuroretinal rim, and did not identify any ONH abnormalities (eg, localized or diffuse thinning of the neuroretinal rim) or RNFL defects. Healthy subjects with a history of laser treatment or intraocular surgery were excluded. Furthermore, healthy subjects with a medical history of IOP elevation (eg, iridocyclitis), eye disease, or conditions that may have affected the visual field, RNFL, ganglion cells, or cpMP measurements (eg, pituitary lesions, demyelinating disease, and diabetic retinopathy) were excluded.
Glaucoma patients all displayed open anterior-chamber angles on gonioscopy, best-corrected visual acuity ≥20/20, cylindrical refractive error <3 D, clear optical media, and spherical refractive error of +3 to −6 D in both eyes or the examined eye. Eyes with normal-tension glaucoma or POAG were included. Glaucoma patients all exhibited characteristic glaucomatous optic neuropathy, ie, a visible RNFL defect, narrowing of the neuroretinal rim at the periphery of the optic disk together with notching, and/or excavation, and a reproducible glaucomatous visual field, according to the HFA Swedish interactive threshold algorithm 30-2 test (mean deviation [MD] up to −12 dB).11 Glaucoma patients who had previously undergone retinal laser treatment or intraocular surgery, had diabetes, or were suffering from neurological disease or other types of retinal pathology were excluded. All the glaucomatous eyes were treated with topical IOP-lowering medication. Table 1 lists subjects’ demographic data.
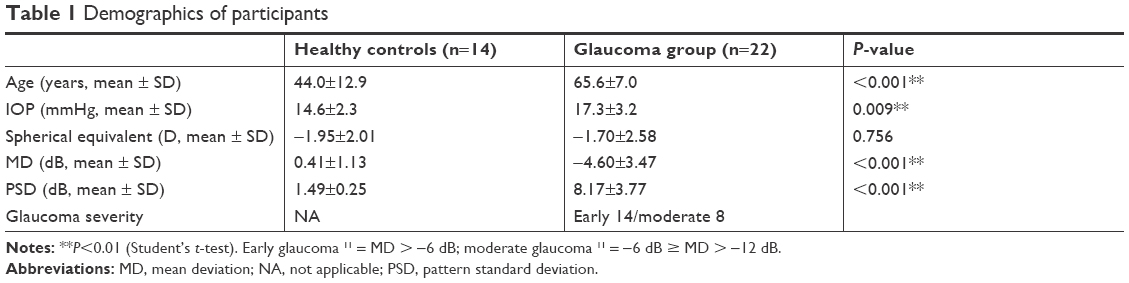 | Table 1 Demographics of participants |
OCT examinations and MP tests for each subject were carried out on the same day, and all HFA and MP tests were conducted within 1 month.
OCT6
The RS-3000 Advance OCT (software version 1.4.2.1; Nidek; Gamagori, Japan) was used for the OCT imaging. This system includes spectral domain OCT equipment, which is used to obtain 3-D tomographic images, and a confocal laser-scanning ophthalmoscope, which is used to monitor fundus images.12 The RS-3000 uses an 880 nm laser-scanning diode to obtain microstructural ocular images. It exhibits axial depth resolution and transverse resolution values of 7 μm and 20 μm, respectively, and can acquire individual 3-D data sets within 1.6 seconds. In the present study, the built-in software included with the RS-3000 was used to assess various circumpapillary retinal thickness parameters (cpRNFL, cpTR, cpOR, and cpGCC; Figure 1A) automatically. For each subject, a well-trained operator obtained high-quality (signal strength index >7) OCT images after the subject’s pupil had been dilated. All subjects were subjected to internal fixation. In circumpapillary retinal imaging, raster scans with a scan density of 512 A-scans (horizontal) ×128 B-scans (vertical) were performed over a 6×6 mm2 area. The center of the optic disk was located in the middle of the 6×6 mm2 area. Circumpapillary retinal thickness measurements were made around a circle measuring 3.45 mm in diameter, which was automatically positioned around the optic disk. The 12 circumpapillary retinal sectors (size 30°) were numbered, starting from the 1 o’clock position of the left eye (Figure 1B). Sectors in the right eye were mirrored and converted into left-eye sectors. No regions of parapapillary atrophy were included in the circumpapillary measurement circle in any of the subjects.
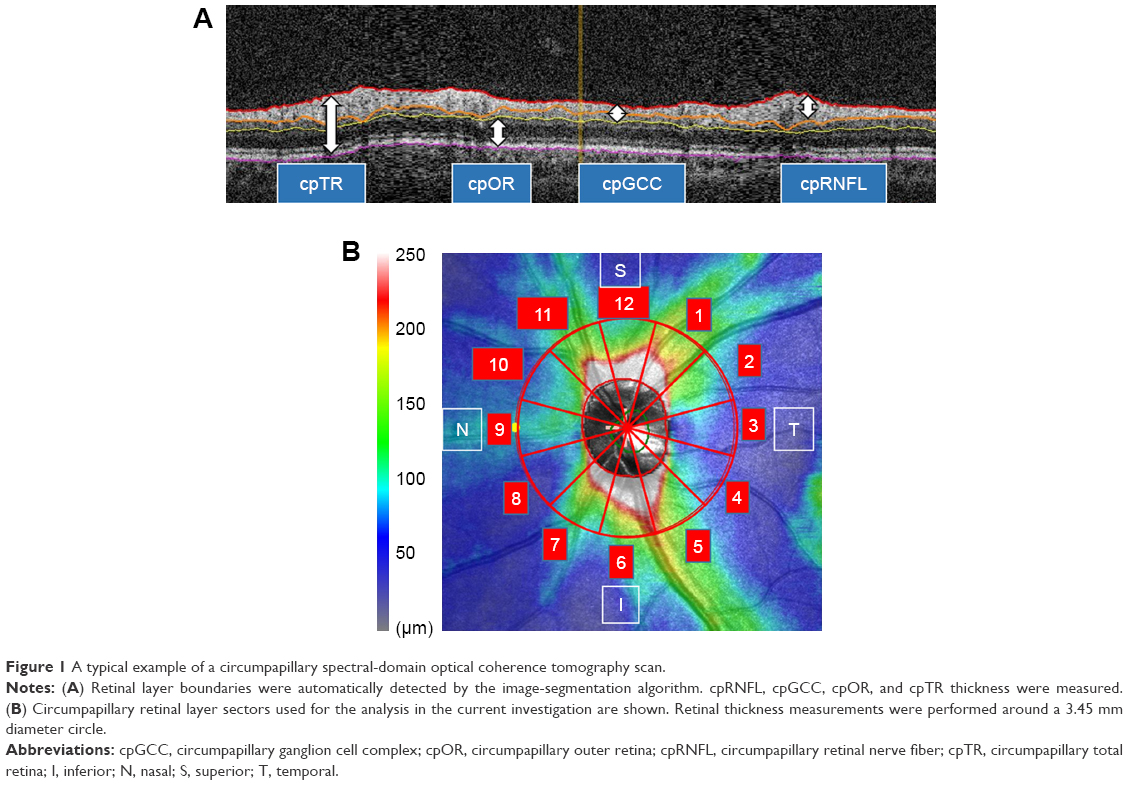 | Figure 1 A typical example of a circumpapillary spectral-domain optical coherence tomography scan. |
Microperimetry6
The MP-3 microperimeter (Nidek) was used to carry out MP examinations. The measurement protocol involved test sites arranged in a circle centered on the middle of the optic disk (Figures 2H and 3H).6 The diameter of the measurement circle, which was manually positioned at the center of the optic disk, was 3.45 mm, and 24 or 12 measurement sites were distributed evenly around the circle (1.5° or 3.0° apart). The eye-tracking function of the MP-3 microperimeter was used during the examinations, which were performed in a dimly lit room, after subjects’ pupils had been dilated with eyedrops containing a combination of 0.5% phenylephrine hydrochloride and 0.5% tropicamide. The stimulus was equal in size to a Goldmann III stimulus. Background luminance was set at 31.4 apostilbs, maximum luminance was 10,000 apostilbs, the dynamic range of the stimulus was set at 34 dB, and a single red cross at 1° was employed as a fixation target. A 4-2 staircase-threshold strategy was used to estimate visual sensitivity.5 Only stable-fixation test results (ie, those for which the subject exhibited fixation control within 1° of the center of the fixation target in ≥75% of tests) were included. Each subject underwent an MP-test training session involving a measurement circle with 12 test sites before being subjected to the same test again or a test involving a measurement circle with 24 test sites. Test sites were numbered, starting at the 1 o’clock position of the left eye (Figure 3H). Right-eye numbers were mirrored and converted into left-eye numbers. The first 18 eyes underwent the 24-site MP test, and the following 18 eyes underwent the 12-site MP test.
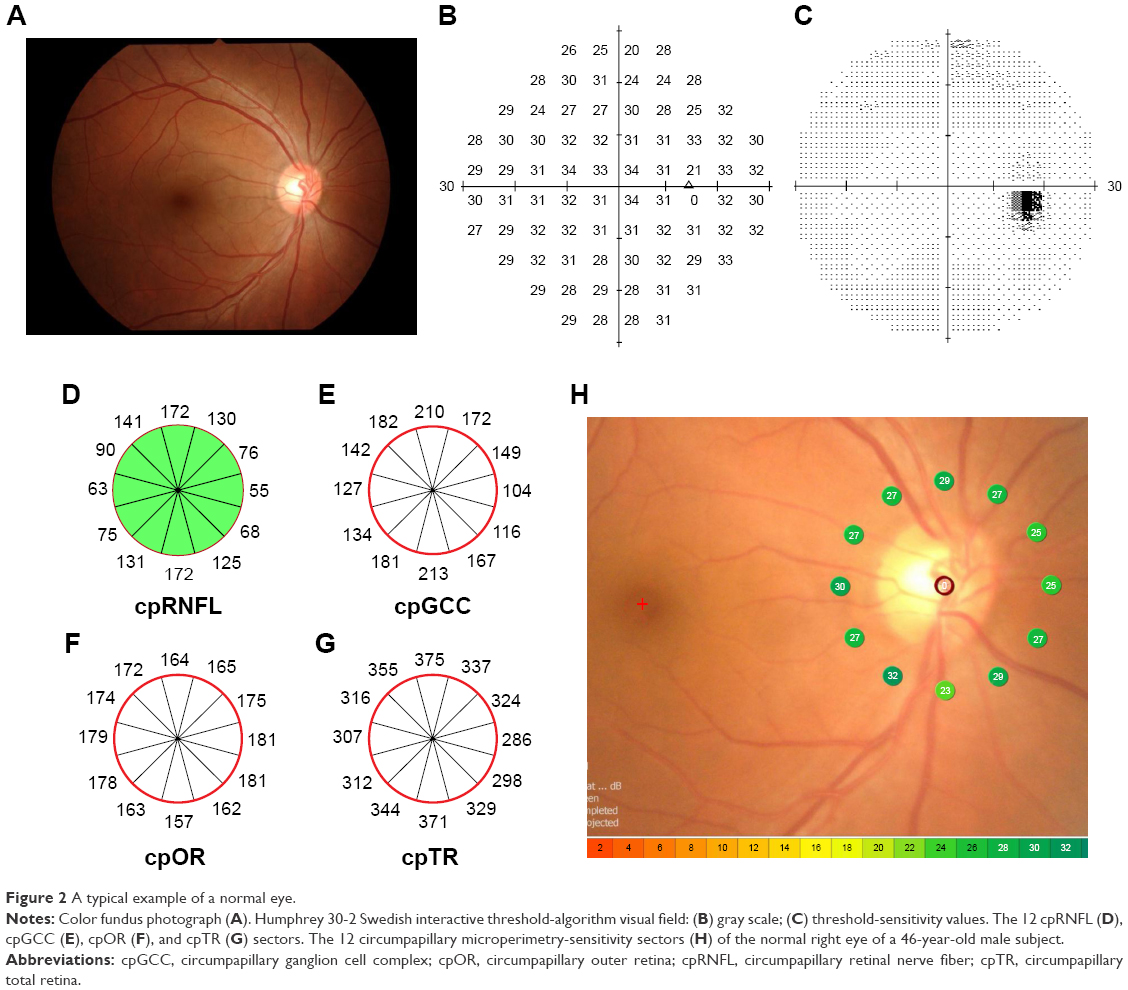 | Figure 2 A typical example of a normal eye. |
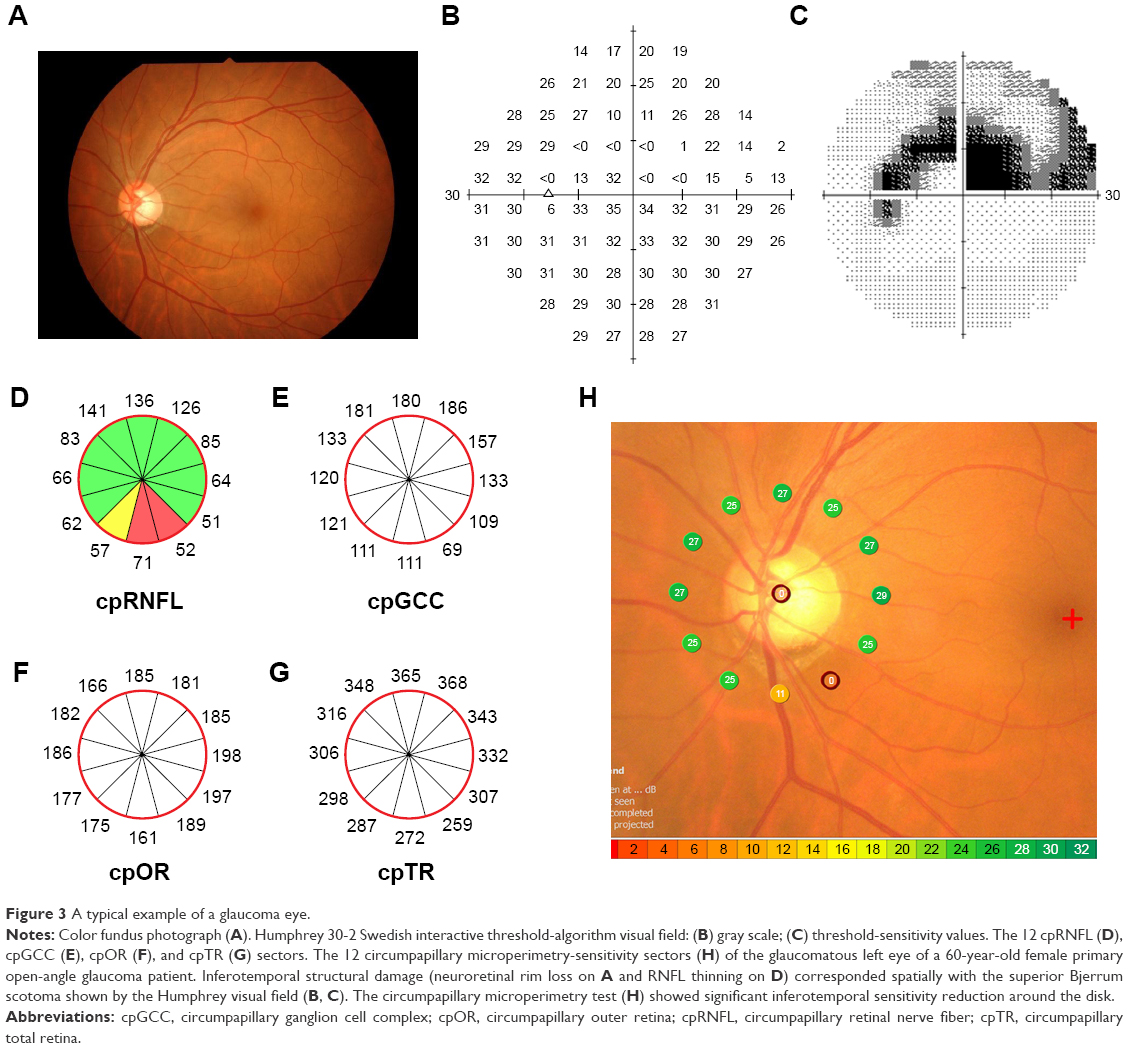 | Figure 3 A typical example of a glaucoma eye. |
Spatial correspondence of cpMP and circumpapillary retinal thickness sectors
The 360° circumpapillary circle was separated into 12 OCT and 12 cpMP sectors (Figures 2 and 3). For eyes tested with the 24-site MP test pattern, values for each set of two MP test sites (spatially corresponding with one MP test-site location in the 12-site MP test) were averaged and mean values used for the structure-function investigation. Corresponding OCT sectors and MP test sites were given the same numbers (Figure 1).
Statistical analyses
All statistical analyses were carried out using SPSS (version 23.0, IBM, Armonk, NY, USA). The significance of intergroup differences was determined using Student’s t-test or Mann–Whitney U test, as appropriate. Relationships between the corresponding OCT-thickness and MP-sensitivity values were assessed using Spearman’s rank correlation coefficient. Spearman’s rank correlation was used to investigate the relationship between visual field MD and cpMP sensitivity in inferotemporal and superotemporal areas, respectively. The Shapiro–Wilk test was used to evaluate the normality of the study sample’s distribution. Descriptive statistics are presented as mean ± standard deviation for normally distributed variables and medians and inter-quartile ranges for abnormally distributed variables. P<0.05 was considered statistically significant. r-Values of ≥0.7, 0.4–0.69, 0.3–0.39, 0.2–0.29, and 0.01–0.19 were considered to indicate very strong, strong, moderate, weak, and negligible relationships, respectively.
Results
Of the 38 eyes that qualified for inclusion, two were excluded due to poor fixation in the MP tests. The final analysis included 36 eyes. No significant difference in refraction was seen between the groups (P=0.756). Age, IOP, MD, and PSD all differed significantly between the groups (P<0.001, P=0.009, P<0.001, and P<0.001, respectively; Table 1). Statistically significant differences between the healthy controls and the glaucoma group were found in ten of 12 sectors for cpRNFL thickness and cpGCC thickness, in eleven of 12 sectors for cpTR thickness, and in one of 12 OCT sectors for cpOR thickness (Table 2).
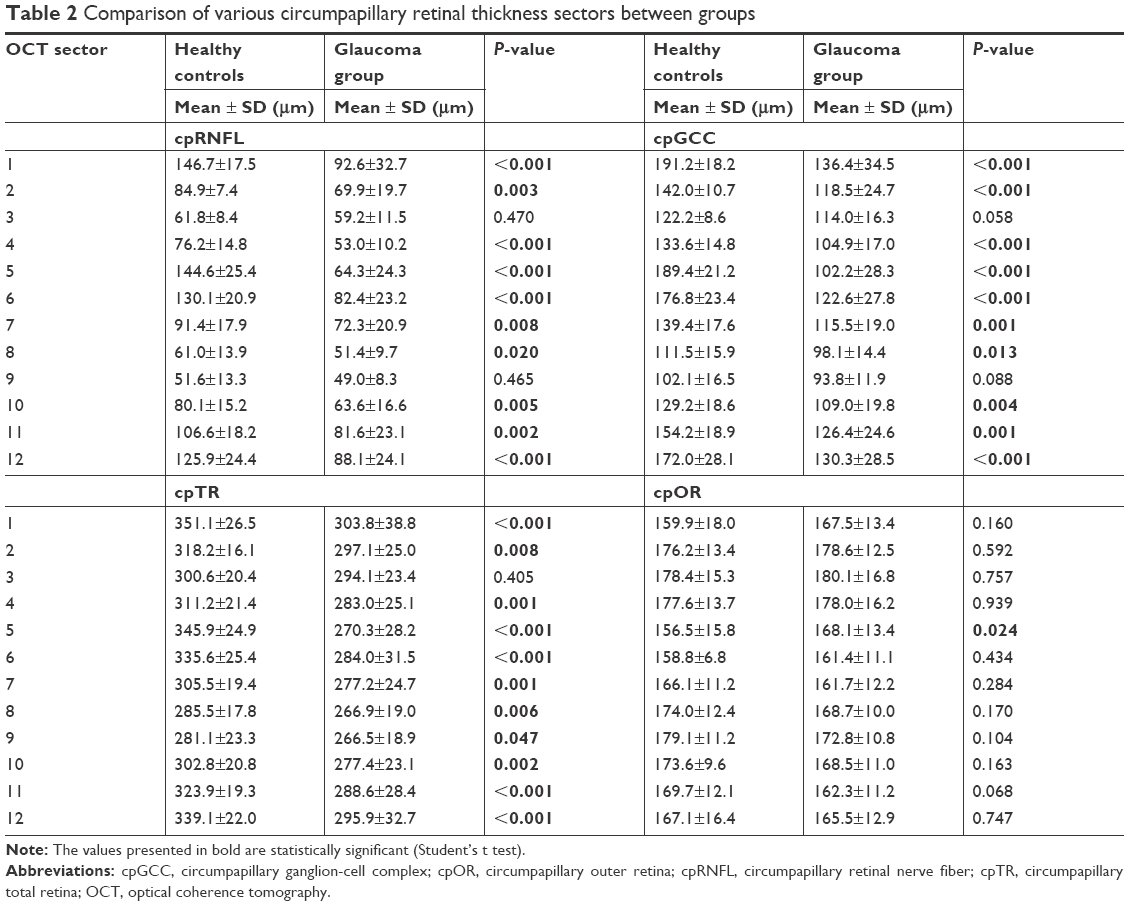 | Table 2 Comparison of various circumpapillary retinal thickness sectors between groups |
Table 3 shows cpMP-sensitivity differences between the healthy control and glaucoma groups. Statistically significant differences were found in eleven of 12 MP sectors.
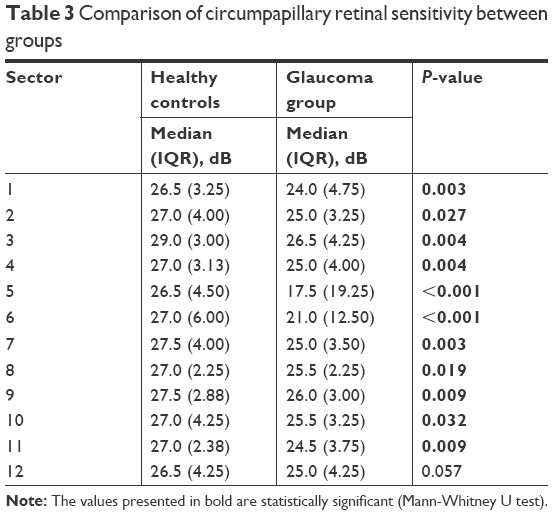 | Table 3 Comparison of circumpapillary retinal sensitivity between groups |
Relationships between sectoral cpMP sensitivity and each of the corresponding circumpapillary retinal thickness parameters are shown in Table 4 for all participants and each sector. Statistically significant correlations with MP sensitivity were found in five sectors for cpRNFL thickness, nine sectors for cpTR thickness, nine sectors for cpGCC thickness, and three sectors for cpOR thickness. The relationships were strong and very strong in three and one sectors for cpRNFL thickness, six and one sectors for cpTR thickness, four and one sectors for cpGCC thickness, and one and 0 sectors for cpOR thickness. The highest r-values were seen in sector 5 (inferotemporal area) for cpGCC thickness (r=0.756, P<0.001) and cpTR thickness (r=0.731, P<0.001). All very strong correlations were found in sector 5 (the inferotemporal sector).
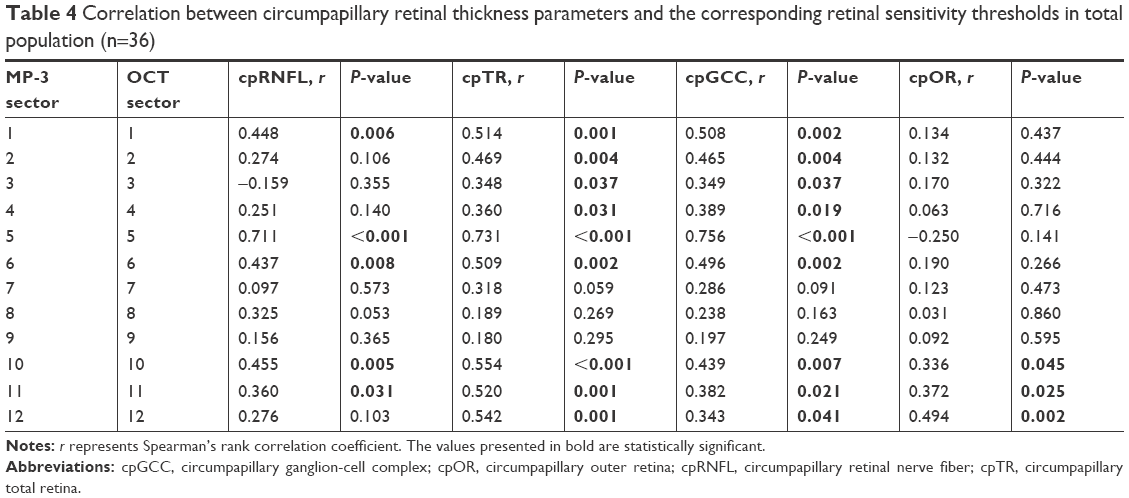 | Table 4 Correlation between circumpapillary retinal thickness parameters and the corresponding retinal sensitivity thresholds in total population (n=36) |
Relationships between the sectoral cpMP-sensitivity values and MD values are shown for the superotemporal and inferotemporal sectors (Figure 4). Statistically significant correlations were found between MD and cpMP sensitivity for sectors 1 and 5 (r=0.470, P=0.04 and r=0.685; P<0.001, respectively).
 | Figure 4 Scatterplots of associations between visual field mean deviation and superotemporal and inferotemporal circumpapillary retinal sensitivity. |
Discussion
In the current investigation, we analyzed structure-function relationships between MP sensitivity and various OCT-thickness parameters around the same circle with a diameter of 3.45 mm around the ONH center in healthy and early–moderate OAG eyes. The measuring circle used by us avoided the macular area and thus might be useful for glaucomatous eyes with AMD. Of the four OCT-thickness parameters (cpRNFL, cpTR, cpGCC, and cpOR) studied in the current investigation, cpTR and cpGCC showed statistically significant correlations with the corresponding cpMP-sensitivity values in the highest number of sectors. While these two parameters exhibited significant correlations with the corresponding cpMP-sensitivity values in nine sectors, such significant correlations were detected only in five sectors for cpRNFL and three sectors for cpOR. Very strong relationships (r≥0.7) were seen only for cpGCC (r=0.756), cpTR (r=0.731), and cpRNFL (r=0.711). All these correlations were seen in the inferotemporal area, which indicates that our findings reflect typical early and moderate glaucoma-related loss patterns.
Our results were not completely unexpected, since cpOR is not influenced by glaucomatous retinal thinning; therefore, no clinically useful correlation was expected from this parameter.13–16 It has also been shown that compared with cpRNFL thickness, the most commonly used parameter for glaucoma investigations,17–19 cpTR thickness is more reproducible, and cpGCC thickness has higher diagnostic accuracy.9,12 For structure-function relationships, in our current investigation cpGCC thickness and cpTR thickness performed better than cpRNFL thickness, both in terms of the number of significantly correlated sectors and the strength of the correlations in the inferotemporal area. In the superonasal area (sectors 10–12), these parameters were consistently greater for cpTR than for cpGCC. Since early glaucomatous structural change typically occurs in the superotemporal and inferotemporal areas, we also analyzed the relationship between HFA MD and cpMP sensitivity in sector 1 (superotemporal area) and sector 5 (inferotemporal area). A strong relationship was seen for both sectors, which suggests that cpMP may in fact be considered a clinically useful measure in glaucoma.
Directly comparing our findings regarding the relationships between the MP and OCT measurements with those obtained in previous studies is difficult, because the previous studies concentrated on macular OCT and MP parameters. Sato et al examined macular ganglion-cell and inner plexiform layer (GCIPL) thickness using the Cirrus HD-OCT, and found that these parameters exhibited significant structure-function relationships with MP-derived central visual field sensitivity values in glaucoma patients.4 In a recent study by Rao et al, it was demonstrated that macular-sensitivity values obtained with MP and standard automated perimetry displayed similar relationships with macular GCIPL thickness in glaucoma patients.5 The same group showed that GCIPL thickness was significantly more useful for diagnosing glaucoma than MP-based macular sensitivity measurements.20
We recently conducted two pilot studies to examine the usefulness of new parameters for diagnosing glaucoma. The first study compared the diagnostic performance of cpRNFL thickness and cpMP sensitivity in 12 equally sized sectors of the same measuring circle. As a result, we demonstrated that the two parameters exhibited similar diagnostic abilities.6 The second study examined the utility of various circumpapillary OCT parameters for diagnosing glaucoma and revealed that cpGCC displayed greater diagnostic accuracy than cpRNFL thickness.9 In another of our studies, cpTR thickness demonstrated high reproducibility.12 Furthermore, Simavli et al found that cpTR thickness diagnosed glaucoma more accurately than cpRNFL thickness.21
The present study was affected by several limitations. For example, the sample was relatively small and all subjects were Japanese. All the glaucomatous eyes were affected by early- or moderate-stage glaucoma, and there were no cases of severe or preperimetric glaucoma. In addition, the subjects in the healthy control group were significantly younger than those in the glaucoma group, which could have had an influence on between-group comparison results when structural and cpMP sensitivity were compared, respectively.22,23 However, when the sector-by-sector relationship between OCT parameters and cpMP sensitivity was analyzed, the between-group age difference had no influence, since the relationship was investigated in the total study population. We used two similar but still different test-site patterns in the MP examinations. Further studies are necessary to clarify which of two test sites is preferable for cpMP investigations.
Conclusion
We consider our study to be a pilot investigation. It strongly suggested that cpTR thickness and cpGCC thickness need more attention in structure-function research into glaucoma, particularly in eyes with macular disease. Our future research will target these glaucoma subpopulations.
Disclosure
Gábor Holló is a consultant of Optovue, Inc. and Carl Zeiss Meditec, Inc. The authors report no other conflicts of interest in this work.
References
Ooto S, Suzuki M, Vongkulsiri S, Sato T, Spaide RF. Multimodal visual function testing in eyes with nonexudative age-related macular degeneration. Retina. 2015;35(9):1726–1734. | ||
Dal Vecchio M, Lavia C, Nassisi M, Grignolo FM, Fea AM. Microperimetric assessment after epiretinal membrane surgery: 4-year follow-up. J Ophthalmol. 2016;2016:1–5. | ||
Cennamo G, Vecchio EC, Finelli M, Velotti N, de Crecchio G. Evaluation of ischemic diabetic maculopathy with Fourier-domain optical coherence tomography and microperimetry. Can J Ophthalmol. 2015;50(1):44–48. | ||
Sato S, Hirooka K, Baba T, Tenkumo K, Nitta E, Shiraga F. Correlation between the ganglion cell-inner plexiform layer thickness measured with cirrus HD-OCT and macular visual field sensitivity measured with microperimetry. Invest Ophthalmol Vis Sci. 2013;54(4):3046–3051. | ||
Rao HL, Januwada M, Hussain RS, et al. Comparing the structure-function relationship at the macula with standard automated perimetry and microperimetry. Invest Ophthalmol Vis Sci. 2015;56(13):8063–8068. | ||
Kita Y, Holló G, Saito T, Murai A, Kita R, Hirakata A. Circumpapillary microperimetry to detect glaucoma: a pilot study for sector-based comparison to circumpapillary retinal nerve fiber layer measurement. Int Ophthalmol. Epub 2017 Dec 16. | ||
Iwase A, Suzuki Y, Araie M, et al. The prevalence of primary open-angle glaucoma in Japanese: the Tajimi Study. Ophthalmology. 2004;111(9):1641–1648. | ||
Kawasaki R, Wang JJ, Ji GJ, et al. Prevalence and risk factors for age-related macular degeneration in an adult Japanese population: the Funagata study. Ophthalmology. 2008;115(8):1376–1381, 1381.e1–e2. | ||
Kita Y, Soutome N, Horie D, Kita R, Holló G. Circumpapillary ganglion cell complex thickness to diagnose glaucoma: A pilot study. Indian J Ophthalmol. 2017;65(1):41–47. | ||
Anderson DR, Patella VM. Automated Static Perimetry. 2nd edn. St Louis: Mosby; 1998:121–190. | ||
Hodapp E, Parrish RK, Anderson DR. Clinical decisions in glaucoma. St Louis: Mosby; 1993:52–61. | ||
Kita Y, Holló G, Kita R, Horie D, Inoue M, Hirakata A. Differences of intrasession reproducibility of circumpapillary total retinal thickness and circumpapillary retinal nerve fiber layer thickness measurements made with the RS-3000 optical coherence tomograph. PLoS One. 2015;10(12):e0144721. | ||
Kita Y, Anraku A, Kita R, Goldberg I. The clinical utility of measuring the macular outer retinal thickness in patients with glaucoma. Eur J Ophthalmol. 2016;26(2):118–123. | ||
Vajaranant TS, Anderson RJ, Zelkha R, et al. The relationship between macular cell layer thickness and visual function in different stages of glaucoma. Eye. 2011;25(5):612–618. | ||
Kita Y, Kita R, Takeyama A, Takagi S, Nishimura C, Tomita G. Ability of optical coherence tomography-determined ganglion cell complex thickness to total retinal thickness ratio to diagnose glaucoma. J Glaucoma. 2013;22(9):757–762. | ||
Kita Y, Kita R, Takeyama A, Anraku A, Tomita G, Goldberg I. Relationship between macular ganglion cell complex thickness and macular outer retinal thickness: a spectral-domain optical coherence tomography study. Clin Exp Ophthalmol. 2013;41(7):674–682. | ||
Nakatani Y, Higashide T, Ohkubo S, Takeda H, Sugiyama K. Evaluation of macular thickness and peripapillary retinal nerve fiber layer thickness for detection of early glaucoma using spectral domain optical coherence tomography. J Glaucoma. 2011;20(4):252–259. | ||
Kim NR, Lee ES, Seong GJ, et al. Comparing the ganglion cell complex and retinal nerve fibre layer measurements by Fourier domain OCT to detect glaucoma in high myopia. Br J Ophthalmol. 2011;95(8):1115–1121. | ||
Oddone F, Lucenteforte E, Michelessi M, et al. Macular versus Retinal Nerve Fiber Layer Parameters for Diagnosing Manifest Glaucoma: A Systematic Review of Diagnostic Accuracy Studies. Ophthalmology. 2016;123(5):939–949. | ||
Rao HL, Hussain RS, Januwada M, et al. Structural and functional assessment of macula to diagnose glaucoma. Eye. 2017;31(4):593–600. | ||
Simavli H, Que CJ, Akduman M, et al. Diagnostic capability of peripapillary retinal thickness in glaucoma using 3D volume scans. Am J Ophthalmol. 2015;159(3):545–556. | ||
Haas A, Flammer J, Schneider U. Influence of age on the visual fields of normal subjects. Am J Ophthalmol. 1986;101(2):199–203. | ||
Alasil T, Wang K, Keane PA, et al. Analysis of normal retinal nerve fiber layer thickness by age, sex, and race using spectral domain optical coherence tomography. J Glaucoma. 2013;22(7):532–541. |
 © 2018 The Author(s). This work is published and licensed by Dove Medical Press Limited. The
full terms of this license are available at https://www.dovepress.com/terms
and incorporate the Creative Commons Attribution
- Non Commercial (unported, 3.0) License.
By accessing the work you hereby accept the Terms. Non-commercial uses of the work are permitted
without any further permission from Dove Medical Press Limited, provided the work is properly
attributed. For permission for commercial use of this work, please see paragraphs 4.2 and 5 of our Terms.
© 2018 The Author(s). This work is published and licensed by Dove Medical Press Limited. The
full terms of this license are available at https://www.dovepress.com/terms
and incorporate the Creative Commons Attribution
- Non Commercial (unported, 3.0) License.
By accessing the work you hereby accept the Terms. Non-commercial uses of the work are permitted
without any further permission from Dove Medical Press Limited, provided the work is properly
attributed. For permission for commercial use of this work, please see paragraphs 4.2 and 5 of our Terms.