Back to Journals » Clinical, Cosmetic and Investigational Dermatology » Volume 19
Circulating Protein–Mediated Pathways in Basal Cell Carcinoma: Mendelian Randomization Reveals STAT3 and GUCA1A as Key Regulatory Hubs
Received 14 February 2026
Accepted for publication 27 April 2026
Published 10 June 2026 Volume 2026:19 597844
DOI https://doi.org/10.2147/CCID.S597844
Checked for plagiarism Yes
Review by Single anonymous peer review
Peer reviewer comments 3
Editor who approved publication: Dr Jeffrey Weinberg
Wenshen Mo,1 Zhan Wang2
1Clinical Medical College, Qinghai University, Xining, Qinghai Province, People’s Republic of China; 2Affiliated Hospital of Qinghai University, Xining City, Qinghai Province, People’s Republic of China
Correspondence: Zhan Wang, Email [email protected]
Objective: To integrate protein quantitative trait loci (BD pQTL) data from the UK Biobank (UKB) and the Icelandic population to investigate the causal relationship between circulating proteins and basal cell carcinoma (BCC), as well as their mediation mechanisms.
Methods: Bidirectional Mendelian randomization (MR) was performed to assess the causal association between UKB-derived pQTLs and BCC. Protein–protein interaction networks and functional enrichment analyses were applied to identify core pathways. A mediation MR framework was further constructed to model the regulatory axis of “upstream proteins–mediator proteins–BCC”, and sensitivity analyses were conducted to ensure robustness.
Results: Circulating proteins have a unidirectional causal effect on BCC, and the associated proteins are significantly enriched in immune and inflammatory pathways. A total of 13 UKB pQTLs were identified to potentially affect the risk of BCC through 6 BD pQTLs, and the robustness of the results was confirmed. Among them, STAT3 and GUCA1A emerged as key mediator hubs, each mediating multiple protein pathways (with the highest mediation proportion reaching 15.2%).
Conclusion: This study reveals the causal associations between certain UKB pQTLs, BD pQTLs, and BCC, and identifies six BD pQTLs that mediate the effect of UKB pQTLs on BCC through STAT3 and GUCA1A as core mediator proteins, providing new genetic evidence for the precise stratification and targeted intervention of BCC.
Keywords: protein quantitative trait loci, (pQTL), mediation analysis, immune pathways, therapeutic targets, genetic regulation
Introduction
Basal cell carcinoma (BCC) is the most common skin malignancy worldwide, severely affecting health and quality of life.1,2 BCC originates from cells in the basal layer of the epidermis and attached epithelium, especially in areas exposed to sunlight.3,4 In recent years, the incidence rate of this malignant tumor has continued to rise in some parts of Europe and the United States. In some regions, the number of cases per 100000 people is more than 1000. Every year, 726/100000 people in Australia seek treatment for this type of cancer, while in Iran, the number of BCC cases has increased by 4.9%; Therefore, the need for timely clinical diagnosis is evident.5 Current treatment strategies for BCC primarily include surgical excision, radiotherapy, chemotherapy, and targeted therapy. Among these, Mohs micrographic surgery has become the preferred option for early-stage BCC, as it enables complete tumor removal while maximally preserving normal tissue. In recent years, with the advancement of diagnostic and therapeutic concepts in head and neck oncology, increasing emphasis has been placed on early detection and minimally invasive treatment strategies. Studies by Khalil AA et al6 have shown that, as the most common malignant tumor of the maxillofacial region, BCC diagnosis is evolving toward more minimally invasive and efficient approaches. Techniques such as scraping cytology, characterized by simplicity, minimal invasiveness, and rapid diagnostic capability, have demonstrated promising utility in outpatient settings and can serve as an important complement to conventional biopsy. Additionally, cytological staining methods, including Papanicolau and Diff-Quick staining, further improve diagnostic accuracy. In terms of treatment, beyond conventional surgical approaches, emerging minimally invasive techniques such as diode laser ablation have shown favorable efficacy in small-sized facial BCC lesions, effectively controlling tumor growth while achieving satisfactory functional and aesthetic outcomes, with a low rate of complications.
Despite these advances, the management of tumors located in critical anatomical regions of the head and neck, as well as advanced or recurrent BCC, remains challenging, and patient prognosis is often suboptimal.7 Therefore, further investigation into the molecular mechanisms underlying BCC and the identification of novel therapeutic targets and intervention strategies are of great importance for advancing precision medicine in this field.
Protein quantitative trait loci (pQTL) are genetic variants that influence protein expression levels or abundance, typically identified through association analyses between genotyping data and proteomic measurements.8 Based on their genomic location, pQTLs can be classified into cis-pQTLs and trans-pQTLs: cis-pQTLs are located near the genes encoding the proteins and generally exert direct regulatory effects on protein expression,9 whereas trans-pQTLs are located in distal genomic regions and may indirectly influence protein levels through transcriptional regulation, signaling pathways, or protein–protein interactions.10 Therefore, pQTLs serve as critical intermediates linking genetic variation to protein expression and disease phenotypes.
UKB pQTLs and BD pQTLs are derived from large-scale proteomic studies in the UK Biobank and Icelandic populations, respectively, and systematically capture the genetic regulation of circulating protein expression across different populations. Elucidating the functional roles of these pQTLs not only advances our understanding of the genetic architecture underlying protein expression but also provides important insights into how genetic variation influences disease susceptibility through protein-mediated mechanisms.11
In the field of epidemiological research, Mendelian randomization (MR) is a causal inference tool based on genetic variation. Its core value lies in effectively avoiding confounding factors and reverse causal bias. It not only provides a reliable analytical framework for accurately verifying the causal relationship between exposure factors and disease outcomes and exploring the pathogenesis of diseases, but also reveals the mediating pathways and effects between exposure and diseases through mediating Mendelian randomization analysis, clarifying the role of intermediate variables in the causal chain.12,13 At present, the key scientific question of whether UKB pQTL will affect the occurrence and development of BCC by regulating the expression or function of pQTL in the Icelandic population is still unclear, and related research is still in a blank state.
In view of this, this study intends to use Mendelian randomization analysis method to construct a causal association analysis framework for “UKB pQTL-BD pQTL-BCC”, and systematically explore the potential causal relationships and regulatory mechanisms among the three This study has both important theoretical significance and practical application value. In theory, the research results can provide a new entry point for analyzing the regulatory mechanisms of the association between genetic variation and diseases, and further improve the cognitive system of the “genetic mediation disease” causal chain with UKB and BD pQTL as the core nodes in the field of genetic epidemiology. In practical application, clarifying the key role of UKB pQTL and BD pQTL in the occurrence of BCC can not only deepen the understanding of the pathogenesis of BCC, provide theoretical support for formulating targeted early prevention strategies and promoting accurate diagnosis and treatment, but also hopefully lay the foundation for screening potential therapeutic targets of BCC and developing new intervention methods, thus providing practical assistance for reducing the incidence rate of BCC and improving the prognosis of patients.
Materials and Methods
Research Design
In this study, UKB pQTLs were treated as exposure variables, BD pQTLs as mediators, and BCC as the outcome. First, association analyses were performed for UKB pQTLs and BD pQTLs, and linkage disequilibrium (LD) SNPs and weak instrumental variables were removed. Subsequently, a total of five MR analyses were conducted in three steps: (1) batch MR analysis of UKB pQTLs on BCC (MR 1); (2) reverse MR analysis of BCC on UKB pQTLs (MR 2), along with protein–protein interaction (PPI) network construction and GO and KEGG pathway enrichment analyses; and (3) mediation analysis involving three MR analyses, including MR of BCC-related UKB pQTLs on BCC (MR 3), MR of BCC-related BD pQTLs on BCC (MR 4), and MR of BCC-related UKB pQTLs on BCC-related BD pQTLs (MR 5). Finally, the mediation and direct effects were calculated. The overall study framework is shown in (Figure 1).
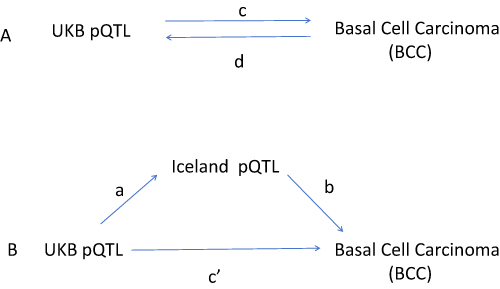 |
Figure 1 (A) The total impact of UKB pQTL and BCC. C is the total effect of using UKB pQTL as exposure and BCC as result. D is the total effect of using BCC as the exposure and UKB pQTL as the result. (B) The total effect decomposition is divided into: (i) indirect effects using a two-step method (where a is the total effect of UKB pQTL on Iceland pQTL and b is the effect of Iceland pQTL on BCC) and product method (a × b), and (ii) direct effects (c ′=c-a × b). The proportion of intermediaries is the indirect effect divided by the total effect. |
Data Sources for Exposure, Mediator, and Outcome
This study was based on the comprehensive collection of publicly available summary-level data. All participants had provided informed consent in the original studies. As the present analysis used summary data, no additional ethical approval was required. To minimize potential bias caused by population heterogeneity, all datasets used in this study were derived from individuals of European ancestry.
The UKB pQTL data were obtained from the UK Biobank Pharma Proteomics Project (UKB-PPP) (https://www.ukbiobank.ac.uk/), including 2,923 proteins and 14,287 primary genetic associations.14 The BD pQTL data were downloaded from the deCODE genetics database (https://www.decode.com), comprising 4,907 plasma proteins from the Icelandic population.15 The BCC dataset was obtained from the FinnGen R12 release (https://www.finngen.fi/), including 405,021 samples and 1,048,576 SNPs.
Instrumental Variable Selection and Data Harmonization
All analyses were conducted in the R (version 4.5.1) environment using the TwoSampleMR, dplyr, and MungeSumstats packages. First, SNPs significantly associated with UKB pQTLs (P<1×10⁻⁵) and BD pQTLs (P<5×10⁻⁸) were extracted. Next, the “format_sumstats” function in the MungeSumstats package was used to standardize the data, including harmonizing field formats and reference genome coordinates. Then, LD clumping was performed using the “ld_clump” function in the TwoSampleMR package (UKB pQTL: kb=10,000, r2 =0.1; BD pQTL: kb=10,000, r2 = 0.001)16 to retain independent variants. Subsequently, F-statistics were calculated using the formula F= (n−k−1)/k × R2/(1−R2), where n represents the sample size and k represents the number of SNPs.17 SNPs with F< 10 were excluded as weak instruments. Finally, the standardized SNP information was merged with the original key data and exported.
Primary Analysis (MR 1 and MR 2)
To identify UKB pQTLs causally associated with BCC (Figure 1A), MR analysis was performed using the TwoSampleMR package. UKB pQTLs were treated as exposures and BCC as the outcome. Five MR methods were applied, including MR-Egger, weighted median, inverse variance weighted (IVW), simple mode, and weighted mode, with IVW as the primary method.18 An IVW P-value < 0.05 was used as the threshold for initial screening. Heterogeneity and pleiotropy tests were conducted, and results with P > 0.05 were retained to ensure reliability. UKB pQTLs with consistent odds ratio (OR) directions across all five methods (all OR>1 or all OR<1) were considered as candidate causal proteins.Forest plots were generated using the forest_theme tool. Based on IVW results, proteins were classified into protective, risk, and non-significant groups according to statistical significance and effect direction. The top 10 most significant pQTLs were annotated. Volcano plots were constructed with Beta values on the x-axis and −log10 P values on the y-axis. Circular heatmaps were visualized using the circlize package. Reverse MR analysis was then performed with BCC as the exposure and UKB pQTLs as the outcome.
Construction of Protein–Protein Interaction Network
Ten significant candidate pQTLs associated with BCC were uploaded to the GeneMANIA database (https://genemania.org/) to construct the PPI network.
GO Analysis and KEGG Pathway Enrichment Analysis
GO functional enrichment analysis and KEGG pathway analysis were performed using UKB pQTLs associated with BCC. A threshold of P ≤ 0.05 was applied, and the top 10 GO biological processes and top 30 KEGG pathways were selected for further analysis.
Mediation Analysis (MR 3, MR 4 and MR 5)
Mediation analysis was conducted to investigate whether BD pQTLs mediate the causal pathway from UKB pQTLs to BCC (Figure 1B). The total effect was decomposed into direct and indirect effects. The direct effect (c′) represents the effect of UKB pQTLs on BCC independent of the mediator, while the indirect effect (a×b) represents the effect mediated through BD pQTLs. The proportion mediated was calculated as the ratio of the indirect effect to the total effect. The 95% confidence intervals were estimated using the delta method.
Sensitivity Analysis
To ensure the robustness of causal inference and the validity of instrumental variables, several sensitivity analyses were performed. First, the MR Steiger test was used to verify the causal direction between exposure and outcome.19 Heterogeneity among SNPs was assessed using Cochran’s Q statistic and funnel plots.20 Horizontal pleiotropy was evaluated using the MR-Egger intercept test and the MR-PRESSO method.21 Finally, leave-one-out analysis was conducted to assess the stability of the results.
Results
Association of UKB pQTL with BCC
After obtaining 2923 proteins from the UKB-PPP database, weak instrumental variables were first removed; Subsequently, through step c of the flowchart and using five MR analysis methods, 287 pQTLs with causal relationships with BCC were ultimately screened (Figure 2). These pQTLs not only align perfectly with the OR value direction of BCC, but also have statistical test P-values less than 0.05, indicating a causal relationship between UKB pQTLs and BCC In addition, the analysis of step d in the flowchart shows that the MR results of this study confirm that there is no reverse causal relationship between UKB pQTL and BCC, that is, BCC has no causal effect on UKB pQTL.
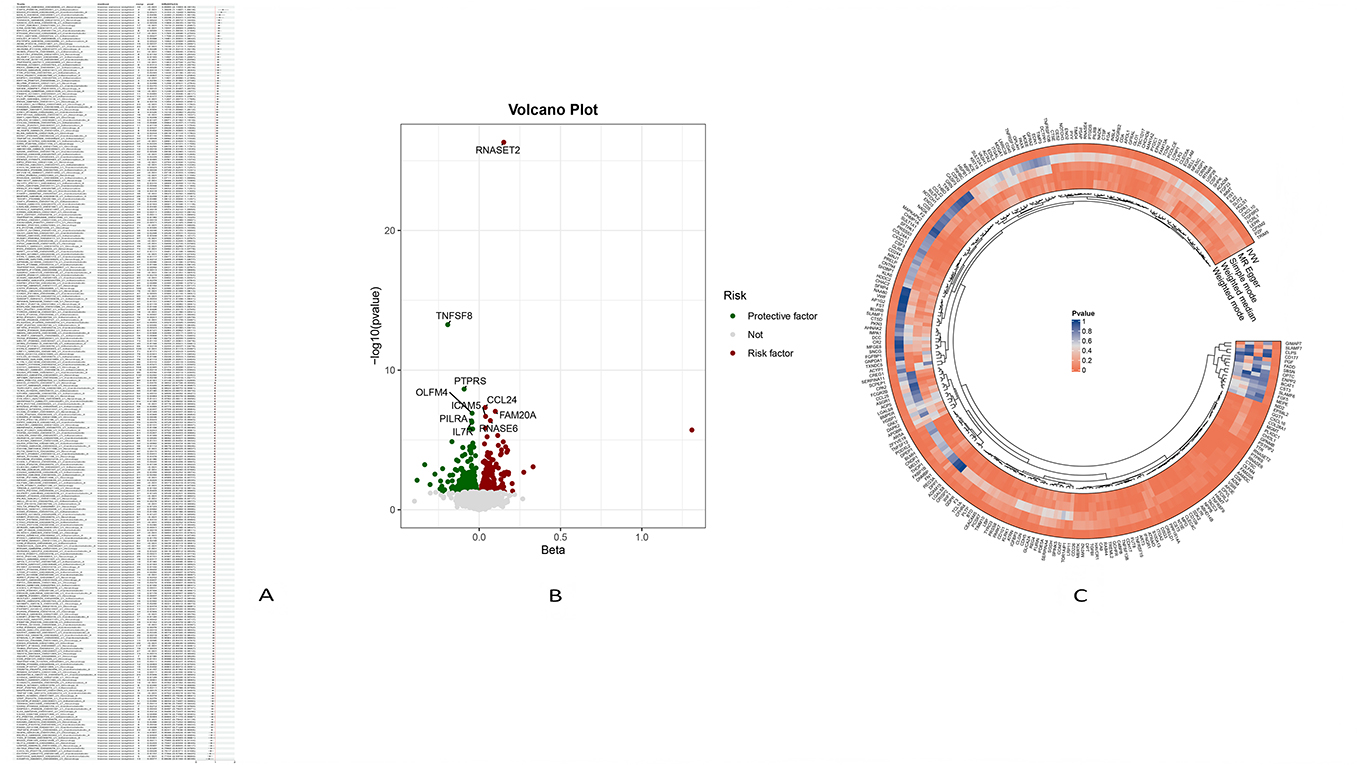 |
Figure 2 (A) Forest Plot of Partial Genetic Association Analysis. (B) The volcano map displays significant factors. Red dots indicate risk factors, blue dots indicate protective factors, and gray dots indicate insignificant factors. (C) Circular heatmap. Analysis methods (IVW, MR Egger, Simple mode, Weighted median, Weighted mode): The closer to red, the smaller the P value, and the more significant the causal relationship between the corresponding exposure factors and BCC. The closer to blue, the larger the P value, and the less significant the causal relationship between the corresponding exposure factors and BCC. |
Construction of Protein Interaction Network Diagram and Molecular Mechanism Analysis Results
Identify 10 significant causal associations with BCC pQTL (TNFSF8, RNASET2, PILRA, CCL24, PTPRS, FAM20A, RNASE6, OLFM4, ICAM5, IL7R) Upload to Genemania website (https://genemania.org/) Construct a PPI network (Figure 3A). This network diagram consists of 30 nodes and 45 edges, reflecting the molecular regulatory network related to immune response, cell communication, tissue homeostasis, and more.
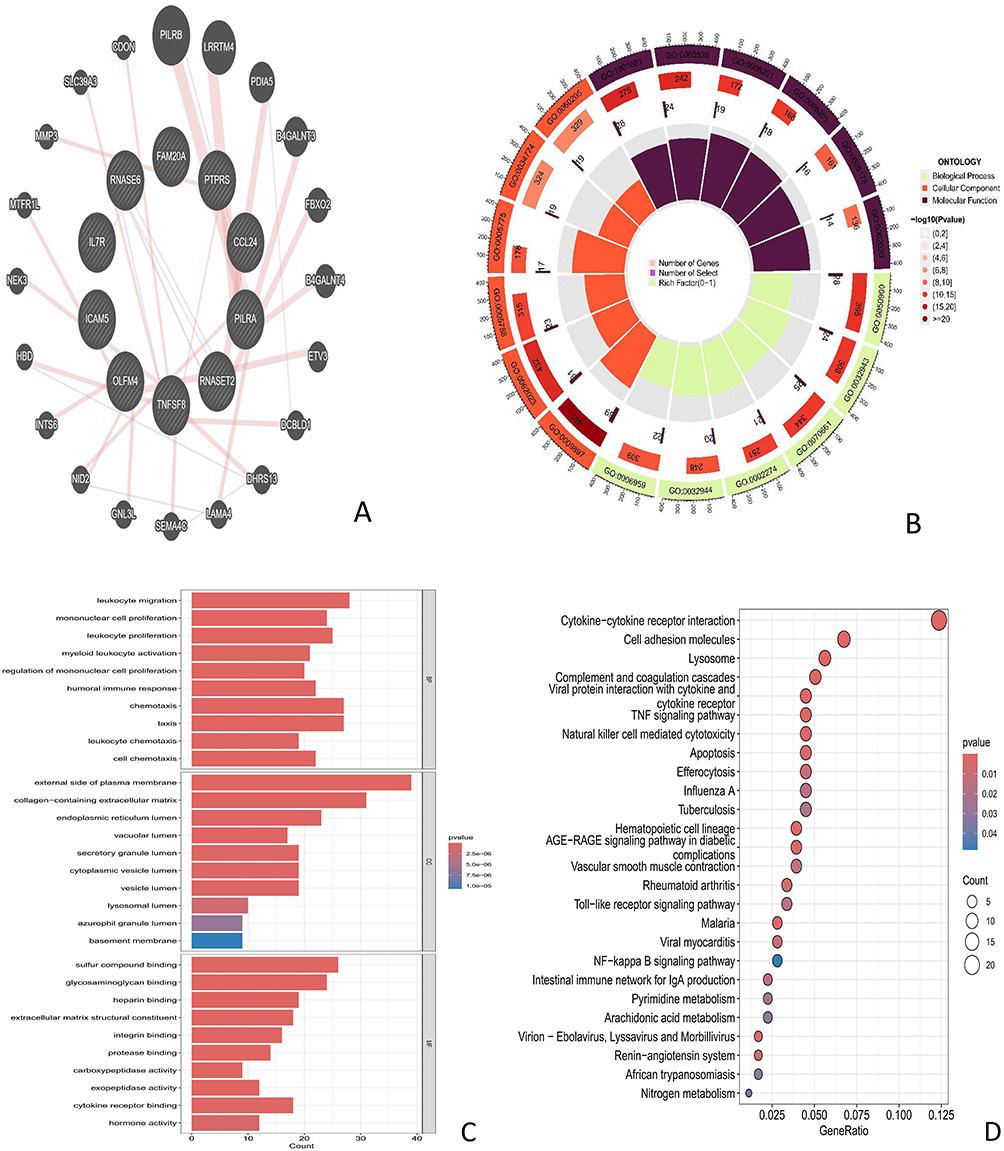 |
Figure 3 (A) PPI network visualization of interactions between overlapping genes (B) GO gene enrichment analysis studies the correlation between gene function and specific biological processes, cellular components, and molecular functions Yellow: biological processes, Orange: cellular components, black: molecular functions The darker the color, the smaller the P value, indicating a more significant enrichment result (C) GO enrichment annotation of overlapping genes in BP, CC, and MF. X-axis=gene count, color gradient=adjusted P-value (dark red=higher significance) (D) KEGG analysis shows the enrichment pathways of overlapping genes X-axis=gene ratio, dot size=gene count, color gradient=adjusted p-value (red=higher significance). |
-We further performed GO enrichment analysis (Figure 3B and C) and KEGG enrichment analysis (Figure 3D) on the UKB pQTLs that showed a causal association with BCC. The GO enrichment results showed that differentially expressed genes were significantly enriched in three dimensions: biological processes (BP), cellular components (CC), and molecular functions (MF). The BP dimension was mainly enriched in immune response, myeloid leukocyte activation, and other immune regulation related processes; The CC dimension suggests that its functional exercise depends on specific subcellular structures such as the endoplasmic reticulum, providing necessary spatial basis for biological processes such as protein processing and signal transduction; The MF dimension focuses on signal receptor binding as its core function.
In KEGG pathway enrichment analysis, the cytokine cytokine receptor interaction pathway showed the highest enrichment significance (p-value ≤ 0.02); At the same time, immune cell function regulation pathway, apoptosis related pathway, influenza A, tuberculosis and other pathogen related pathways, and pyrimidine metabolism and other metabolic pathways are also significantly enriched.
Intermediary MR Analysis Results
MR Analysis Results of UKB pQTL Associated with BCC Pathogenesis to BCC
After MR analysis, it was found that 41 UKB pQTLs related to the onset of BCC had significant causal relationships with BCC, with IVW method P<0.05. Among them, 20 pQTLs such as CD109 were protective factors for BCC, and the OR of the 5 MR analysis methods was less than 1; 21 pQTLs including APOE are risk factors for BCC, with OR>1 for 5 MR analysis methods (Figure 4).
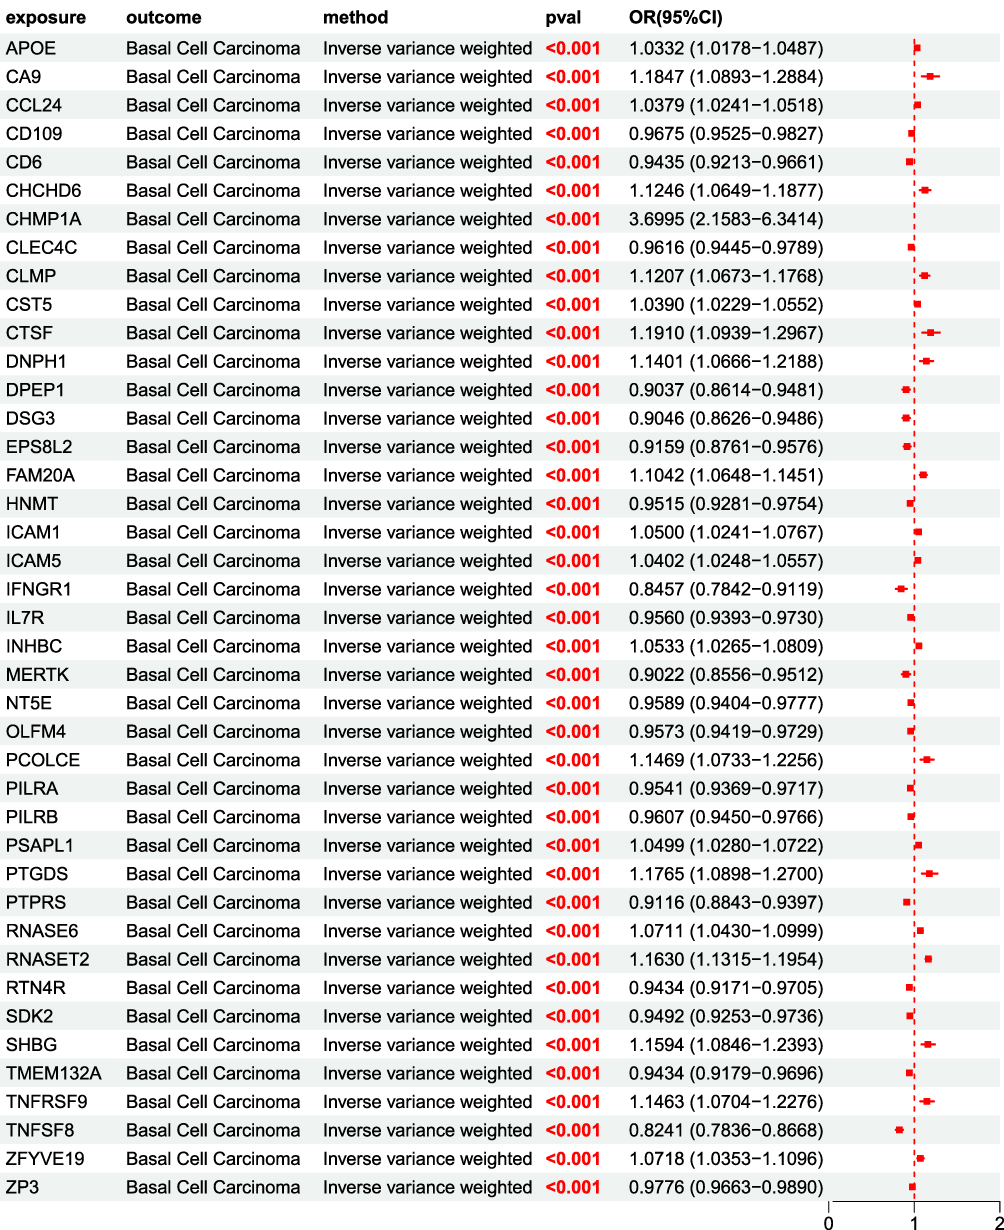 |
Figure 4 MR forest plot of UKB pQTL to BCC OR<1, P<0.05, Indicating that 20 proteins including CD109 are protective factors for BCC; OR>1,P<0.05, This indicates that 21 proteins including APOE are risk factors for BCC. |
MR Analysis Results of BD pQTL Associated with BCC Pathogenesis to BCC
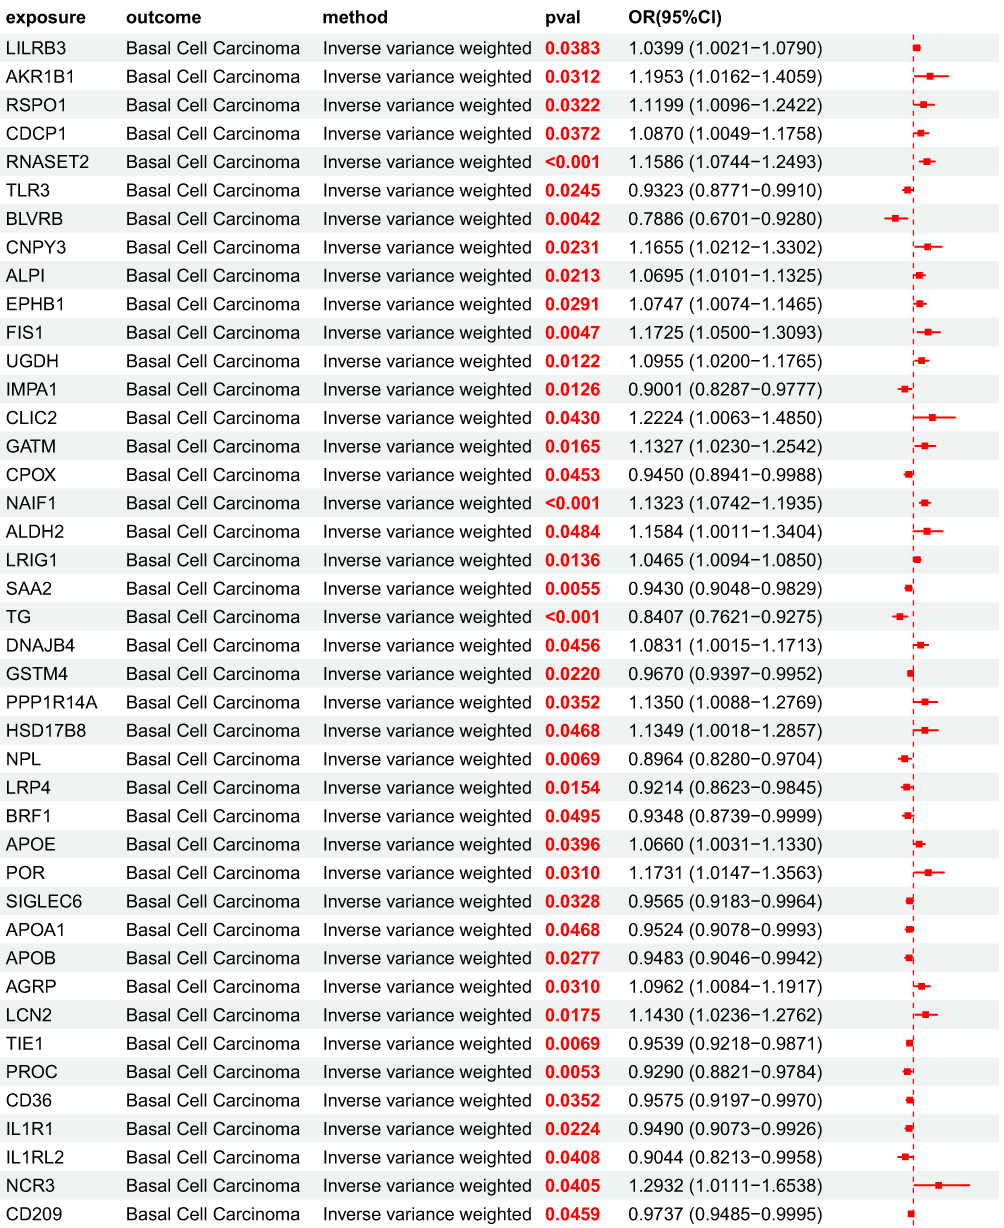
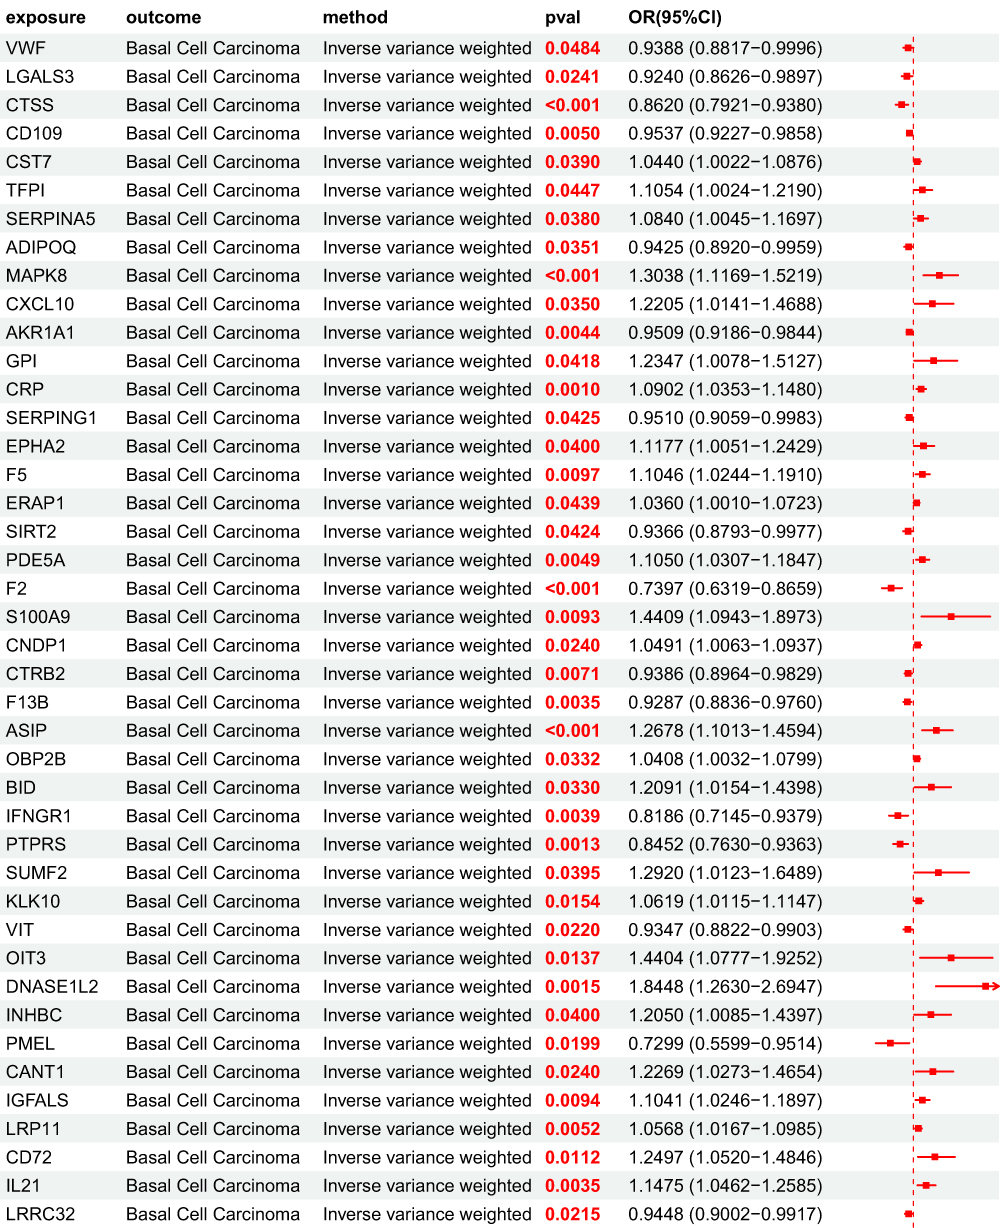
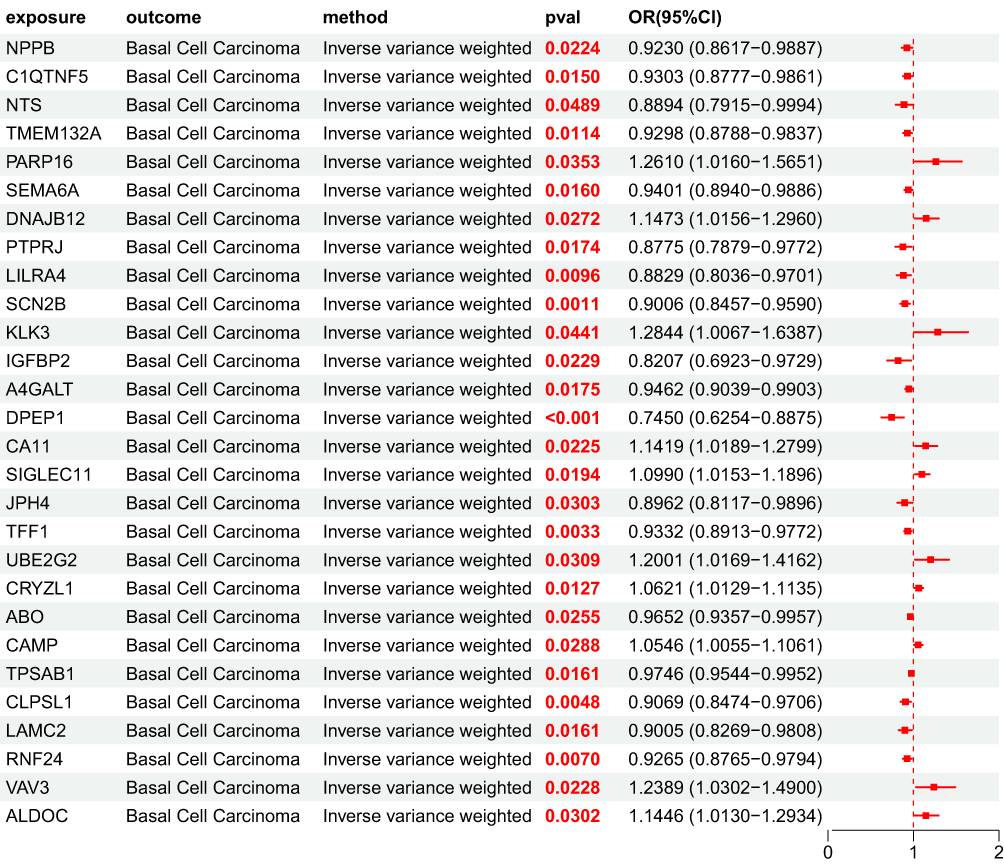
After obtaining 4907 plasma proteins from the deCODE genetics database, weak instrumental variables were first removed; Subsequently, through step a of the flowchart, 154 BD pQTLs with causal relationships with BCC were screened using five MR analysis methods. Their OR values were completely consistent among the five MR analysis methods, and the statistical test P values were all<0.05. Based on forest map analysis, it can be seen that AXL and 68 other BD pQTLs have OR<1, indicating that they are protective factors for BCC; 86 BD pQTLs including GUCA1A have OR>1, indicating that they are risk factors for BCC (Figure 5).
Figure 5 MR forest plot of BD pQTL to BCC OR<1, P<0.05, Indicating that 68 proteins including AXL are protective factors for BCC; OR>1,P<0.05, Indicating that 86 proteins including GUCA1A are risk factors for BCC. Figure 5 Continued. Figure 5 Continued. Figure 5 Continued.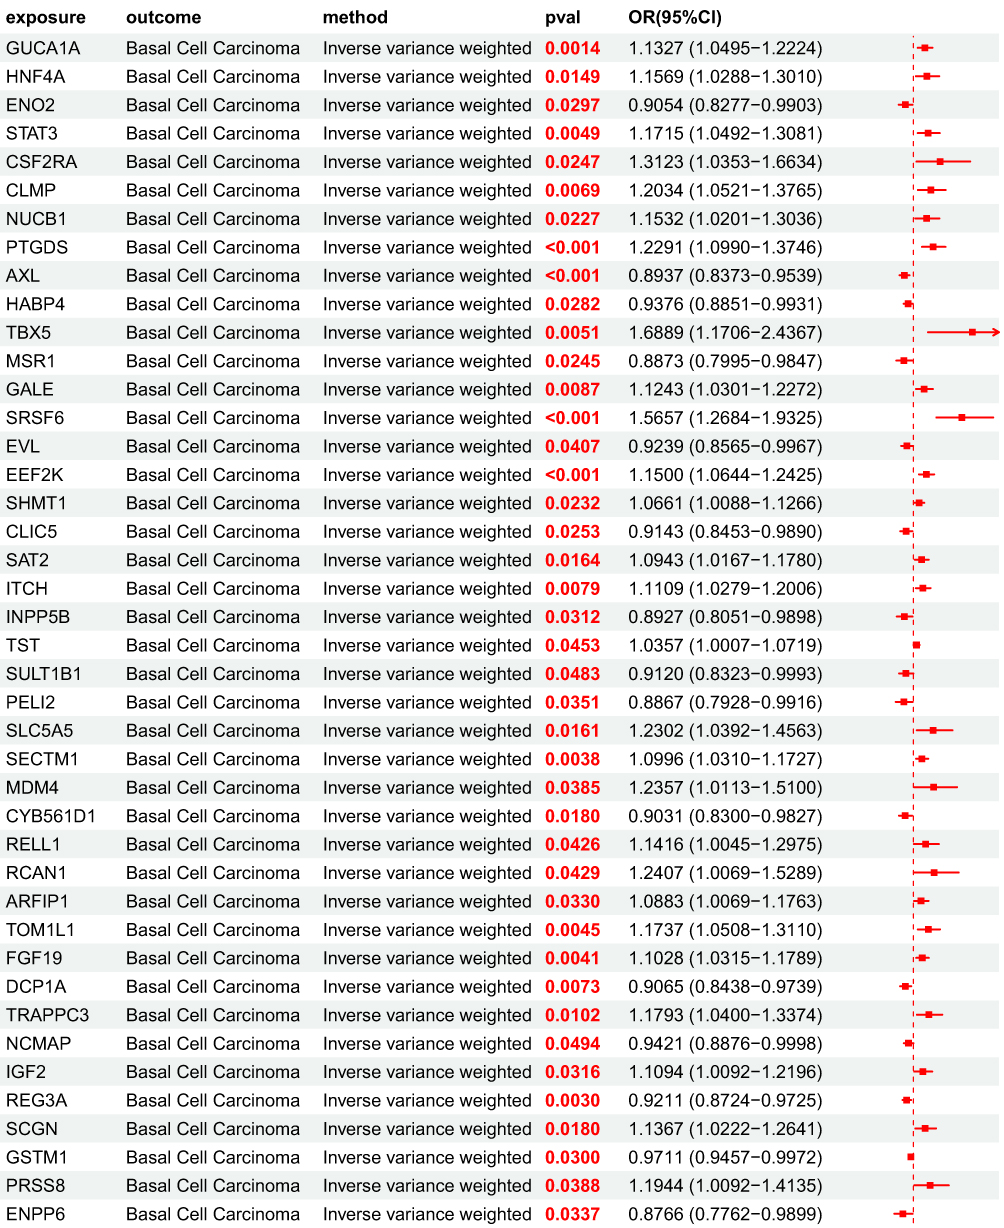
MR Analysis Results of UKB pQTL Associated with BCC Pathogenesis to BCC Associated BD pQTL
41 BCC disease associated UKB pQTLs were used as exposures and 154 BCC related BD pQTLs were used as outcomes for MR analysis. The results showed a significant causal relationship between BCC disease associated UKB pQTLs and BCC related BD pQTLs, with P<0.05 for the IVW method. Among them, 21 UKB pQTLs, including CLEC4C, showed a negative causal relationship with BD pQTL, with OR<1; TNFSF8 and 20 other UKB pQTLs showed a positive causal association with BD pQTL, with OR>1 (Figure 6).
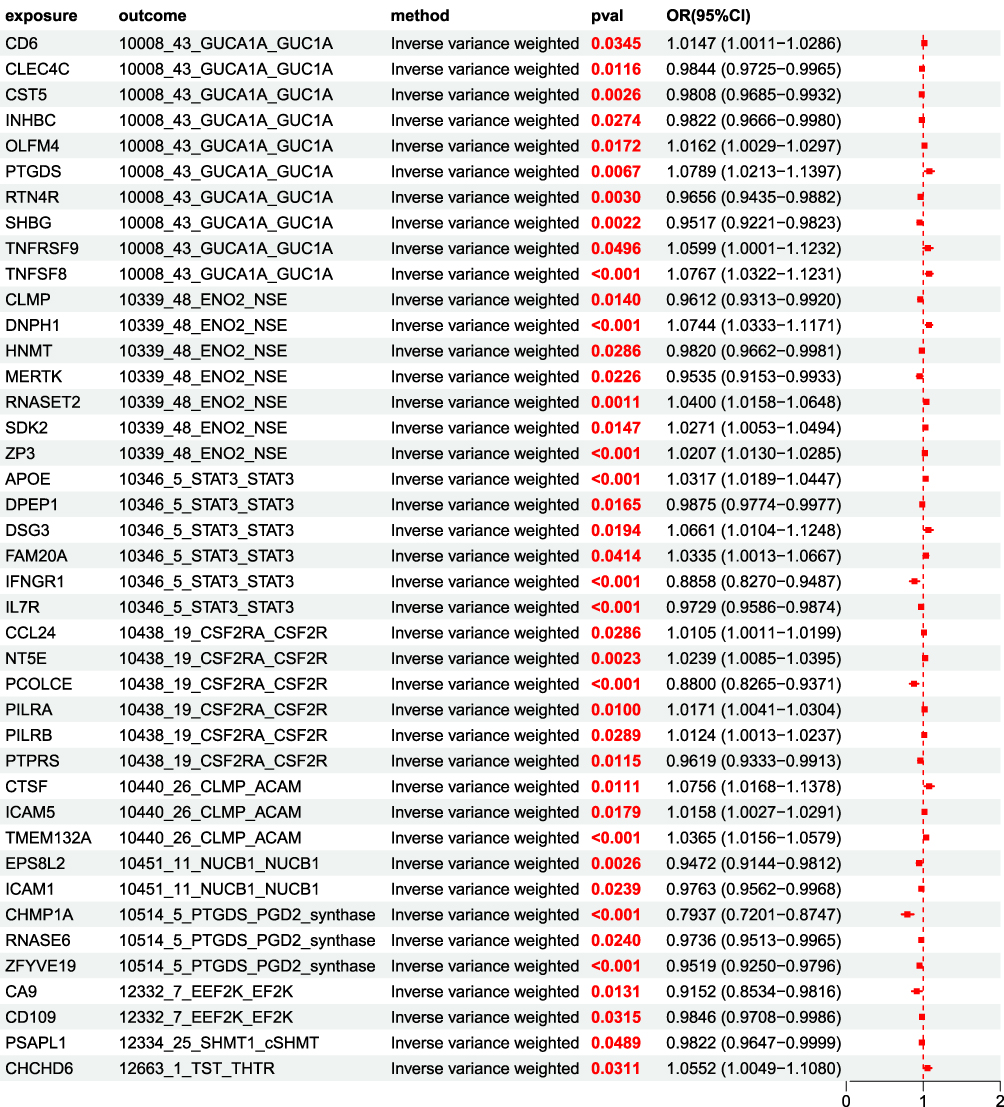 |
Figure 6 MR forest plot of UKB pQTL to BD pQTL OR<1, P<0.05, This indicates a negative causal relationship between 21 proteins including CLEC4C and BD pQTL; OR>1,P<0.05, This indicates a positive causal association between 20 proteins including TNFSF8 and BD pQTL. |
Calculation of Mediation Effect, Mediation Ratio, and Direct Effect
We conducted calculations on mediating effects, mediating ratios, and direct effects, and identified 41 UKB pQTL BD pQTL BCC pathways, covering 10 BD pQTLs. Among them, the mediating effects of 13 pathways were P<0.05, and PTGDS mediated the causal relationship between CHMP1A and BCC, with a mediating ratio of −3.6% (P=0.004); STAT3 mediated the causal relationship between IFNGR1 and BCC, with a mediation ratio of 11.5% (P=0.03); EEF2K mediated the causal relationship between CA9 and BCC, with a mediation ratio of −7.3% (P=0.04); PTGDS mediated the causal relationship between ZFYVE19 and BCC, with a mediation ratio of −14.7% (P=0.01); GUCA1A mediated the causal relationship between SHBG and BCC, with a mediation ratio of −4.2% (P=0.03); GUCA1A mediated the causal relationship between RTN4R and BCC, with a mediation ratio of 7.5% (P=0.03); STAT3 mediated the causal relationship between IL7R and BCC, with a mediation ratio of 9.7% (P=0.03); ENO2 mediated the causal relationship between ZP3 and BCC, with a mediation ratio of 9.0% (P=0.04); GUCA1A mediated the causal relationship between CST5 and BCC, with a mediation ratio of −6.3% (P=0.03); STAT3 mediated the causal relationship between APOE and BCC, with a mediation ratio of 15.2% (P=0.01); CLMP mediated the causal relationship between TMEM132A and BCC, with a mediation ratio of −11.4% (P=0.03); GUCA1A mediated the causal relationship between TNFSF8 and BCC, with a mediation ratio of −4.8% (P=0.02); GUCA1A mediated the causal relationship between PTGDS and BCC, with a mediation ratio of 5.8% (P=0.04). See Figure 7 for details.
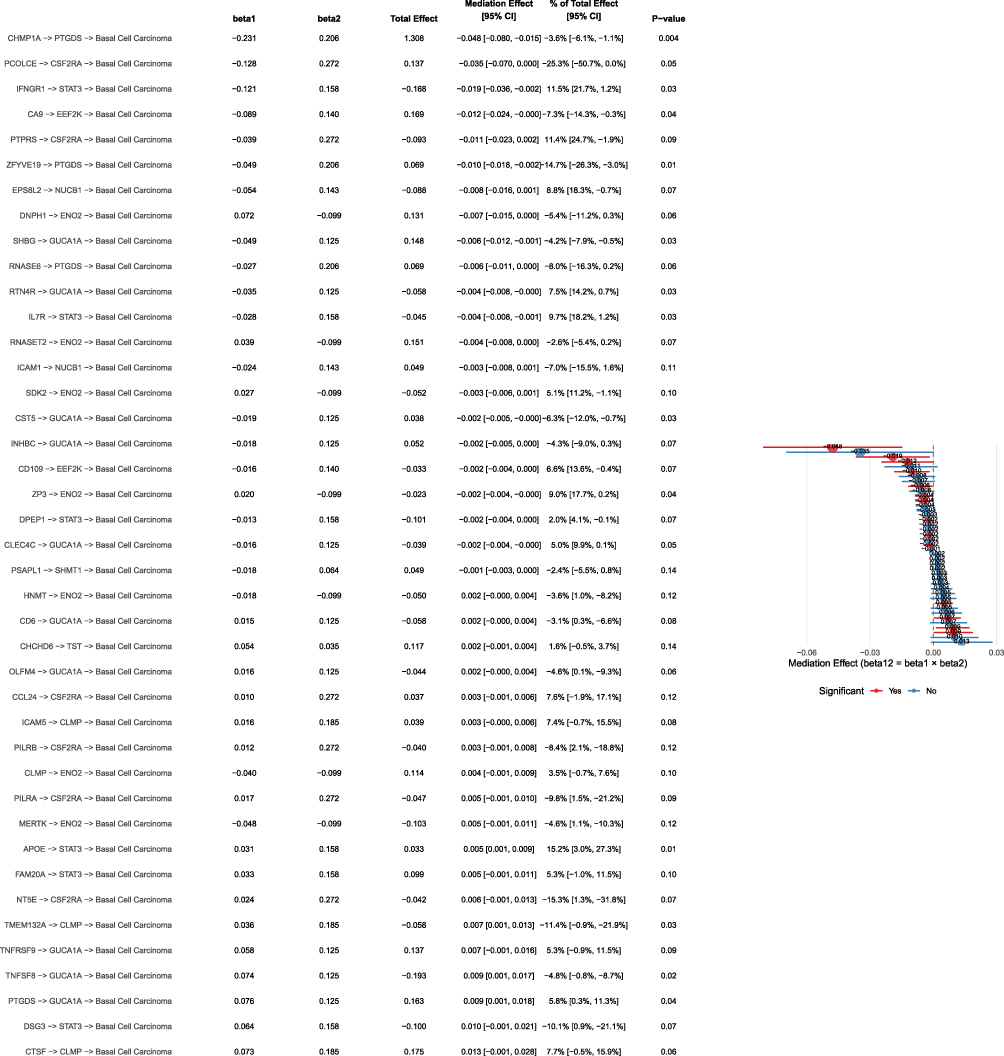 |
Figure 7 Mediation analysis result chart: shows the pathway coefficients, total effects, mediation effects and 95% confidence intervals, proportion of mediation effects to total effects, and p-values of multiple gene pathways. |
Sensitivity Analysis
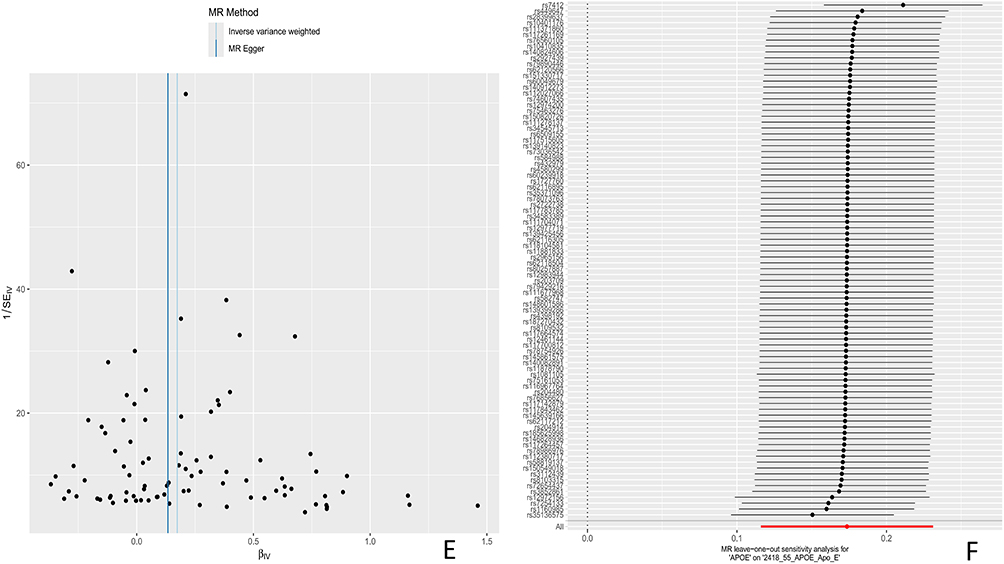
Using MR Steiger to test the causal direction of each extracted SNP with exposure and results, the results showed that the causal direction determination of all SNPs remained consistent, without any reversal or confusion of causal direction. Test and correct potential pleiotropy interference in causal effect estimation through sensitivity analysis. Cochran’s Q-test and funnel plot show that there is no evidence of heterogeneity or asymmetry in the causal relationships between these SNPs. The results of the leave one method analysis showed that after removing individual SNPs one by one, Mendelian randomization analysis was repeated for the remaining loci, and the estimated values of causal effects in each round remained stable and consistent, indicating that all included SNPs can independently support the statistical significance of the causal relationship between exposure and outcome. See Figure 8 for details.
Figure 8 (A) Funnel plot of UKB pQTL associated with BCC pathogenesis to BCC (B) Sensitivity analysis plot; (C) Funnel plot of BD pQTL associated with BCC pathogenesis to BCC; (D) sensitivity analysis plot. (E) Funnel plot of UKB pQTL associated with BCC pathogenesis to BCC associated BD pQTL. (F) sensitivity analysis plot. Red line: Solid red line denoting the null hypothesis of zero effect, used to assess statistical significance of individual SNP effects. Thick line: Thick black vertical dashed line in the forest plot, representing the pooled causal effect of all SNPs and showing the direction of the overall causal effect. Thin lines: Thin black horizontal lines in the forest plot, representing the 95% confidence interval (95% CI) of individual SNPs, reflecting uncertainty in effect estimates and genetic heterogeneity. Figure 8 Continued.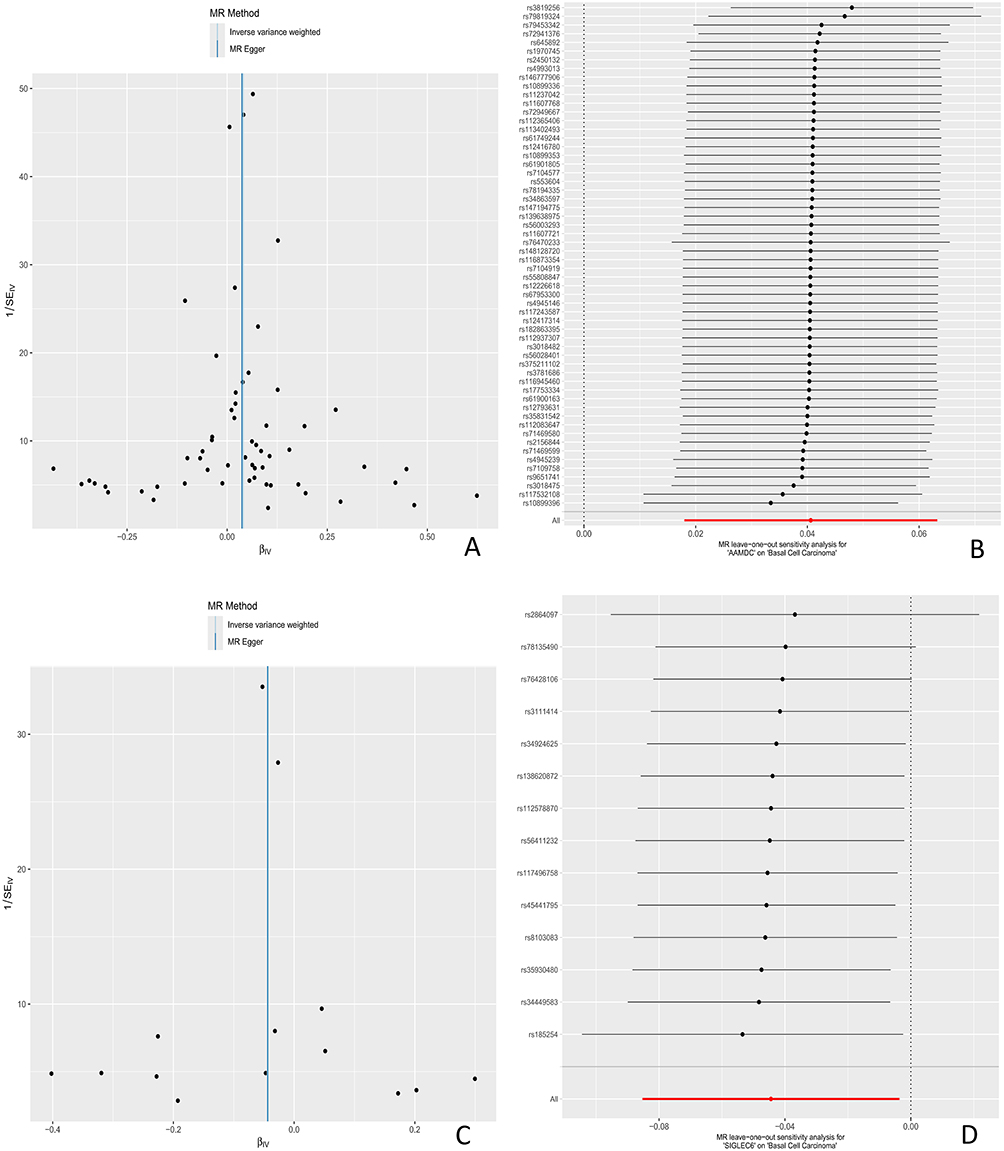
Discussion
Although previous studies have reported associations between plasma inflammation-related protein pQTLs and BCC,22 evidence on the causal effect of UKB pQTLs through BD pQTLs mediating the impact on BCC remains lacking. In this study, we applied MR analysis to reveal that 13 UKB pQTLs might influence BCC through 6 BD pQTLs, and we confirmed the robustness of the results.
These results provide preliminary evidence suggesting that UKB pQTLs may affect potential regulatory pathways of BCC through BD pQTLs, offering new insights into the differential roles of pQTLs from different sources in BCC development. Furthermore, PPI network analysis indicates that UKB pQTL-related proteins may be involved in the regulatory network of BCC development, while GO and KEGG enrichment analyses suggest these proteins might enrich key pathways related to BCC. Overall, these results contribute to a deeper understanding of the potential molecular mechanisms underlying BCC and provide a reference for future research.
Previous studies have predominantly focused on genetic or protein associations at a single level. For example, Chahal HS et al23 revealed several genetic risk loci related to BCC, providing valuable insights into the genetic basis of the disease. Although genetic variations and proteins associated with BCC have been identified, the causal relationships between these variations and disease development have not been explored. Gudbjartsson DF et al24 identified genetic variants influencing adult height and provided insights into the genetic basis of skin cancer and other diseases. This study mainly focused on height-related genetic variations and did not address the causal relationships of BCC or related proteins, nor did it systematically analyze the full causal chain of “genetic variation – protein expression – disease development.” Sun BB et al25 identified pQTLs associated with protein expression, providing essential support for understanding the genetic regulation of plasma proteins and laying the theoretical foundation for future research on how proteins regulate diseases. However, it did not explore the complete causal chain of “genetic variation – protein expression – disease development.”
In contrast, our study integrated UKB and BD pQTL data and introduced a mediation MR analysis framework, systematically evaluating potential causal paths from a cross-dataset perspective, thereby supplementing and expanding on existing research. These results are largely consistent with previous studies on immune and inflammatory pathways in skin tumor development, while providing new genetic evidence from a proteomic level.
Further analysis revealed that BD pQTLs might mediate the effect of UKB pQTLs on BCC. We categorized the 6 BD pQTLs mediators into two groups: immune regulation-related proteins and metabolic adaptation-related proteins.
Firstly, immune regulation-related proteins include STAT3, PTGDS, and CLMP. STAT3 was identified as a potential mediator connecting IFNGR1, IL7R, and APOE with BCC. Previous studies have shown that phosphorylated STAT3 (p-STAT3), as an active form of the STAT3 signaling pathway, plays a critical role in the development of epidermal tumors.26–28 Our results align with these studies, suggesting that STAT3-related pathways might play a key role in immune responses in BCC. PTGDS was identified as a potential mediator between CHMP1A and BCC, possibly exacerbating BCC development through immune and inflammatory responses.29–31 CLMP mediates the relationship between TMEM132A and BCC, possibly affecting the immune microenvironment of BCC by regulating immune cell migration and activation.32
Secondly, metabolic adaptation-related proteins include EEF2K, ENO2, and GUCA1A. EEF2K was identified as a mediator between CA9 and BCC. It is known to be activated in acidic environments and may help tumor cells adapt to hypoxic and nutrient-deficient conditions.33,34 Our study suggests that EEF2K may play a role in metabolic adaptation in BCC, but further validation is needed. ENO2, a key rate-limiting enzyme in the glycolytic pathway, is upregulated in various tumors and associated with tumor progression.35,36 Our results indicate that metabolic reprogramming via ENO2 might be a crucial mechanism in BCC development. GUCA1A mediates pathways involving SHBG, RTN4R, and CST5, possibly participating in the metabolic regulation of BCC.37
These key proteins may play important roles in the development of BCC. Given their critical roles in immune response and metabolic adaptation, these proteins hold promise as potential biomarkers for BCC, useful for early screening, precision stratification, and targeted interventions. In particular, STAT3 and GUCA1A, whose expression levels may help assess the risk of BCC and guide personalized treatment, are of significant interest. These findings align with recent research trends in tumor immune-metabolic reprogramming, suggesting that BCC development may involve bidirectional regulation between immunity and metabolism.38 Previous studies have indicated that immune microenvironment regulation and energy metabolism reprogramming play key roles in skin tumor development.39 This study provides indirect support for this mechanism using genetic instrument variables, enhancing the biological rationale of the findings.
We employed MR methods to minimize confounding biases and reverse causality often seen in traditional observational studies. By assessing the independent effects of different exposure factors using genetic instrument variables, we improved the reliability of our results.
However, this study has some limitations. Firstly, the data used were from European populations, which may limit the generalizability of the results to other populations. Secondly, since the study relied on summary-level genetic data and bioinformatics analysis, the results should be interpreted with caution, and further experimental and clinical validation is needed.
Conclusion
In conclusion, this study reveals the causal associations between certain UKB pQTLs and BD pQTLs with BCC, and identifies 6 BD pQTLs that mediate the effects of UKB pQTLs on BCC through intermediary proteins, with STAT3 and GUCA1A as key mediators. Several promising new targets were identified in this study, providing preliminary causal evidence for the genetic regulatory mechanisms of BCC. These findings open new directions for the development of early screening biomarkers and targeted treatment strategies. Although these results show significant potential, further experimental and clinical validation is necessary to assess their feasibility and effectiveness in practical applications.
Ethical Declarations
The design and implementation of this study followed the relevant regulations and ethical guidelines of China. According to Article 32 of the “Ethical Review Measures for Human Life Sciences and Medical Research” jointly issued by relevant Chinese departments on February 18, 2023, the following two types of studies can be exempted from ethical review: (1): Non-intrusive observational studies conducted in public places, and those that do not involve the collection of private behaviors and information that cannot identify individual identities; (2): Studies using legally available database data or information collected through anonymous methods, and those that cannot be traced back to specific individuals and will not pose any risks to the subjects. After assessment, this study falls under the circumstances stipulated in the second item of the above-mentioned provisions. Therefore, this study is exempt from the review and approval of the institutional ethics committee. Ethical: GWAS and GEO data belong to public databases. Our study is based on open-source data without the need for ethical approval.
Funding
This study is funded by the National Natural Science Foundation of China (Project No. 82160131).
Disclosure
All authors declare that there is no conflicts of interest in this work.
References
1. Giannopoulos K, Karikis I, Byrd C, et al. Eph/ephrin-mediated immune modulation: a potential therapeutic target. Front Immunol. 2025;16:1539567. doi:10.3389/fimmu.2025.1539567
2. Niculet E, Craescu M, Rebegea L, et al. Basal cell carcinoma: comprehensive clinical and histopathological aspects, novel imaging tools and therapeutic approaches (Review). Exp Ther Med. 2022;23(1):60. doi:10.3892/etm.2021.10982
3. Widjaya MRH, Koswara T. A Successful Nodular Basal Cell Carcinoma Defect Closure On The Mid-Cheek Using Modified Mini Cheek Advancement Flap. Cancer Manag Res. 2025;17:499–19. doi:10.2147/CMAR.S513161
4. Sordi E, Piscitelli P, Albanese C, et al. Incidence of Non-Melanoma Skin Cancers in Salento (Southern Italy): a 15-Year Retrospective Analysis from the Cancer Registry of Lecce. Epidemiologia. 2023;5(1):1–10. doi:10.3390/epidemiologia5010001
5. Mohammad EA, Mansour M, Parichehr K, et al. Assessment of clinical diagnostic accuracy compared with pathological diagnosis of basal cell carcinoma. Indian Dermatol Online J. 2015;6(4):258–262. doi:10.4103/2229-5178.160257
6. Khalil AA, Enezei HH, Aldelaimi TN, et al. Advances in Diagnosis and Treatment of Basal Cell Carcinoma. J Craniofac Surg. 2024;35(2):e204–e208. doi:10.1097/SCS.0000000000009959
7. Constantin M, Chifiriuc MC, Bleotu C, et al. Molecular pathways and targeted therapies in head and neck cancers pathogenesis. Front Oncol. 2024;14:1373821. doi:10.3389/fonc.2024.1373821
8. Suhre K, Venkataraman GR, Guturu H, et al. Nanoparticle enrichment mass-spectrometry proteomics identifies protein-altering variants for precise pQTL mapping. Nat Commun. 2024;15(1):989. doi:10.1038/s41467-024-45233-y
9. Zhou J, Liu S, Jia Z, et al. Identification of novel protein biomarkers and drug targets for functional dyspepsia by integrating human plasma proteome with genome. Medicine. 2025;104(38):e44660. doi:10.1097/MD.0000000000044660
10. Tao Y, Liu Q, Wang Y, et al. Genomic data-driven framework for drug target discovery in atrial fibrillation. J Transl Med. 2025;23(1):1110. doi:10.1186/s12967-025-07217-4
11. Pietzner M, Wheeler E, Carrasco-Zanini J, et al. Mapping the proteo-genomic convergence of human diseases. Science. 2021;374(6569):eabj1541. doi:10.1126/science.abj1541
12. Gao J, Shao S, Shen Y. Causal effects of gut microbiota on risk of interstitial cystitis: a two-sample Mendelian randomization study. Front Microbiol. 2024;15:1434117. doi:10.3389/fmicb.2024.1434117
13. Zhang P, Li H, Huang Y, et al. Causal insights into multiple myeloma: the impact of circulating inflammatory proteins and metabolites. Medicine. 2025;104(28):e43315. doi:10.1097/MD.0000000000043315
14. Geng J, Ruan X, Wu X, et al. Network Mendelian randomisation analysis deciphers protein pathways linking type 2 diabetes and gastrointestinal disease. Diabetes Obes Metab. 2025;27(2):866–875. doi:10.1111/dom.16087
15. Yu Q, Wu Y, Ma X, et al. Causal genes identification of giant cell arteritis in CD4+ Memory t cells: an integration of multi-omics and expression quantitative trait locus analysis. Inflamm Res. 2025;74(1):3. doi:10.1007/s00011-024-01965-7
16. Qing X, Zhang C, Zhong Z, et al. Causal Association Analysis of Periodontitis and Inflammatory Bowel Disease: a Bidirectional Mendelian Randomization Study. Inflamm Bowel Dis. 2024;30(8):1251–1257. doi:10.1093/ibd/izad188
17. Sang N, Gao RC, Zhang MY, et al. Causal Relationship Between Sleep Traits and Risk of Systemic Lupus Erythematosus: a Two-Sample Mendelian Randomization Study. Front Immunol. 2022;13:918749. doi:10.3389/fimmu.2022.918749
18. Matías-García PR, Wilson R, Guo Q, et al. Plasma Proteomics of Renal Function: a Transethnic Meta-Analysis and Mendelian Randomization Study. J Am Soc Nephrol. 2021;32(7):1747–1763. doi:10.1681/ASN.2020071070
19. Chen L, Sun X, Zheng L. No causal effect of tea consumption on cardiovascular diseases: a two-sample Mendelian randomization study. Front Cardiovasc Med. 2022;9:870972. doi:10.3389/fcvm.2022.870972
20. Yan W, Wang X, Peng Z, et al. A Bidirectional Mendelian Randomization Study of Tea-Drinking Habits and Risk of Elevated Serum Uric Acid Levels. Int J Rheum Dis. 2025;28(2):e70128. doi:10.1111/1756-185X.70128
21. Lv H, Zhang G, Hu ZM, et al. Dissecting Causal Relationships Between Plasma Metabolites and Osteoporosis: a Bidirectional Mendelian Randomization Study. Chin Med Sci J. 2024;39(3):182–188. doi:10.24920/004356
22. Fu ZD, Wang Y, Yan HL, et al. Mendelian Randomization Analysis Supports a Causal Relationship Between Circulating Inflammatory Proteins and Basal Cell Carcinoma. Clin Cosmet Invest Dermatol. 2025;18:767–779. doi:10.2147/CCID.S521068
23. Chahal HS, Wu W, Ransohoff KJ, et al. Genome-wide association study identifies 14 novel risk alleles associated with basal cell carcinoma. Nat Commun. 2016;7(1):12510. doi:10.1038/ncomms12510
24. Gudbjartsson DF, Walters GB, Thorleifsson G, et al. Many sequence variants affecting diversity of adult human height. Nat Genet. 2008;40(5):609–615. doi:10.1038/ng.122
25. Sun BB, Maranville JC, Peters JE, et al. Genomic atlas of the human plasma proteome. Nature. 2018;558(7708):73–79. doi:10.1038/s41586-018-0175-2
26. Chen R, Zhai -Y-Y, Sun L, et al. Alantolactone-loaded chitosan/hyaluronic acid nanoparticles suppress psoriasis by deactivating STAT3 pathway and restricting immune cell recruitment. Asian J Pharm Sci. 2022;17(2):268–283. doi:10.1016/j.ajps.2022.02.003
27. Cocchiola R, Romaniello D, Grillo C, et al. Analysis of STAT3 post-translational modifications (PTMs) in human prostate cancer with different Gleason Score. Oncotarget. 2017;8(26):42560–42570. doi:10.18632/oncotarget.17245
28. Wang J, Man Q, Zhong N, et al. ENO1 Binds to ApoC3 and Impairs the Proliferation of T Cells via IL-8/STAT3 Pathway in OSCC. Int J Mol Sci. 2022;23(21):12777.
29. Boroń D, Zmarzły N, Wierzbik-Strońska M, et al. Recent Multiomics Approaches in Endometrial Cancer. Int J Mol Sci. 2022;23(3):1237. doi:10.3390/ijms23031237
30. Li B, Shen Y, Liu S, et al. Identification of immune microenvironment subtypes and clinical risk biomarkers for osteoarthritis based on a machine learning model. Front Mol Biosci. 2024;11:1376793. doi:10.3389/fmolb.2024.1376793
31. Zou R, Zheng M, Tan M, et al. Decreased PTGDS Expression Predicting Poor Survival of Endometrial Cancer by Integrating Weighted Gene Co-Expression Network Analysis and Immunohistochemical Validation. Cancer Manag Res. 2020;12:5057–5075. doi:10.2147/CMAR.S255753
32. Langhorst H, Jüttner R, Groneberg D, et al. The IgCAM CLMP regulates expression of Connexin43 and Connexin45 in intestinal and ureteral smooth muscle contraction in mice. Dis Model Mech. 2018;11(2):32128. doi:10.1242/dmm.032128
33. Chu HP, Liao Y, Novak JS, et al. Germline quality control: eEF2K stands guard to eliminate defective oocytes. Dev Cell. 2014;28(5):561–572. doi:10.1016/j.devcel.2014.01.027
34. Rezabakhsh A, Habtemariam S, Khani E, et al. Pharmacologic targeting of eEF2K in cardiovascular diseases: mechanisms and potential clinical applications. Eur J Pharmacol. 2025;1007:178253. doi:10.1016/j.ejphar.2025.178253
35. Kanda T, Wakiya T, Ishido K, et al. Heterogeneity of metabolic adaptive capacity affects the prognosis among pancreatic ductal adenocarcinomas. J Gastroenterol. 2022;57(10):798–811. doi:10.1007/s00535-022-01898-0
36. Li S, Gong J, Kang B, et al. Targeting Glycolytic Metabolism in Cancer Therapy: current Approaches and Future Perspectives. Cells. 2026;15(4):362. doi:10.3390/cells15040362
37. Kitiratschky VB, Behnen P, Kellner U, et al. Mutations in the GUCA1A gene involved in hereditary cone dystrophies impair calcium-mediated regulation of guanylate cyclase. Hum Mutat. 2009;30(8):E782–796. doi:10.1002/humu.21055
38. Wu L, Liu Y, Deng W, et al. OLR1 Is a Pan-Cancer Prognostic and Immunotherapeutic Predictor Associated with EMT and Cuproptosis in HNSCC. Int J Mol Sci. 2023;24(16):12904
39. Ali Z, Yousaf N, Larkin J. Melanoma epidemiology, biology and prognosis. EJC Suppl. 2013;11(2):81–91. doi:10.1016/j.ejcsup.2013.07.012
 © 2026 The Author(s). This work is published and licensed by Dove Medical Press Limited. The
full terms of this license are available at https://www.dovepress.com/terms
and incorporate the Creative Commons Attribution
- Non Commercial (unported, 4.0) License.
By accessing the work you hereby accept the Terms. Non-commercial uses of the work are permitted
without any further permission from Dove Medical Press Limited, provided the work is properly
attributed. For permission for commercial use of this work, please see paragraphs 4.2 and 5 of our Terms.
© 2026 The Author(s). This work is published and licensed by Dove Medical Press Limited. The
full terms of this license are available at https://www.dovepress.com/terms
and incorporate the Creative Commons Attribution
- Non Commercial (unported, 4.0) License.
By accessing the work you hereby accept the Terms. Non-commercial uses of the work are permitted
without any further permission from Dove Medical Press Limited, provided the work is properly
attributed. For permission for commercial use of this work, please see paragraphs 4.2 and 5 of our Terms.