Back to Journals » Cancer Management and Research » Volume 11
Circulating microRNA as diagnostic biomarkers for haematological cancers: a systematic review and meta-analysis
Authors Drokow EK ![]() , Sun K
, Sun K ![]() , Ahmed HAW
, Ahmed HAW ![]() , Akpabla GS
, Akpabla GS ![]() , Song J
, Song J ![]() , Shi M
, Shi M ![]()
Received 24 December 2018
Accepted for publication 10 March 2019
Published 10 May 2019 Volume 2019:11 Pages 4313—4326
DOI https://doi.org/10.2147/CMAR.S199126
Checked for plagiarism Yes
Review by Single anonymous peer review
Peer reviewer comments 3
Editor who approved publication: Dr Alexandra R. Fernandes
Emmanuel Kwateng Drokow,1 Kai Sun,1 Hafiz Abdul Waqas Ahmed,1 Gloria Selorm Akpabla,2 Juanjuan Song,1 Mingyue Shi1
1Department of Haematology, Zhengzhou University People’s Hospital & Henan Provincial People’s Hospital Henan, Zhengzhou, People’s Republic of China; 2Department of Pathophysiology, School of Basic Medical Sciences, Tianjin Medical University, Tianjin, People’s Republic of China
Purpose: Recent studies have validated microRNAs (miRNAs) as a diagnostic biomarker for haematological cancers. This study aimed to estimate the overall diagnostic accuracy of circulating miRNAs in haematological malignancies.
Materials and Methods: Multiple databases (Google Scholar, PubMed, EMBASE, Cochrane Library,) were searched until 19th, August 2017.
Results: The meta-analysis included 50 studies from 20 publications. The diagnostic accuracy was assessed by pooled specificity, sensitivity, positive likelihood ratio (PLR), negative likelihood ratio (NLR), diagnostic odds ratio (DOR) and area under the curve area (AUC) by random effect model. We used QUADAS (Quality Assessment for diagnostic accuracy studies) to evaluate the quality of the included studies. To perform the meta-analysis, we used Meta-Disk 1.4, Revman 5.3 and Stata 12.0 software. High diagnostic accuracy was demonstrated, with a sensitivity of 0.81, a specificity of 0.85, a PLR of 5.28, an NLR of 0.22, a DOR of 30.39, and an AUC of 0.91. Subgroup analyses showed better outcomes for the African population, combined miRNAs and leukaemia patients compared with other subgroups.
Conclusion: Our results indicated that circulating miRNAs especially combined miRNA can be used as a diagnostic marker in haematological cancers.
Keywords: Specificity, sensitivity, diagnostic biomarkers, miRNA, haematological cancers
Introduction
Haematological cancers are caused by the malignant transformation of bone marrow cells, and the lymphatic system is mostly classified into three essential parts: lymphoma, leukaemia and multiple myeloma (MM).1–3 Every year, more than 60,300 people (3.5% of all new cancer cases) are diagnosed with leukaemia in the world with acute myeloid leukaemia (AML) being the most commonly diagnosed. The 5-years overall survival percentage of patients with AML is 27.4%.4 Early diagnosis, and effective treatment is essential due to the aggressive nature of haematological malignancies. As a result of MICM (molecular, immunology, cytogenetic, morphology) diagnostic classification for leukaemia,5,6 a significant upgrade in the diagnosis and treatment of leukaemia have been presented in recent decades. However, the overall prevalence of leukaemia continues to increase (by 0.5% per year).7 Currently, flow cytometry, which is the accepted technique for malignant haematological detection, can be used to diagnose leukaemia cells because of its high sensitivity, simplicity and specificity8 but it is expensive, time-wasting and needs a more top expertise resulting in the limitation of its uses in the clinical and health contexts.9,10 Besides, the diagnosis of leukaemia and lymphoma has been shown to be helpful by therapeutic antibodies such as anti-CD19, anti-CD20, anti-CD27 and anti-CD33. However, their uses are reduced because of their diagnostic accuracy uncertainties and also the toxicities of these antigens to normal cells.11,12 Haematological cancers are very aggressive; hence diagnosing it earlier will help improve patient’s prognosis and also increase the survival rates. Nevertheless, recent diagnosis techniques have different limitations, such as low sensitivity, specificity, and low predictive power and it is, therefore desirable to develop new biomarkers for the detecting of haematological cancers early.
 | Figure 3 Forest plot of specificity. |
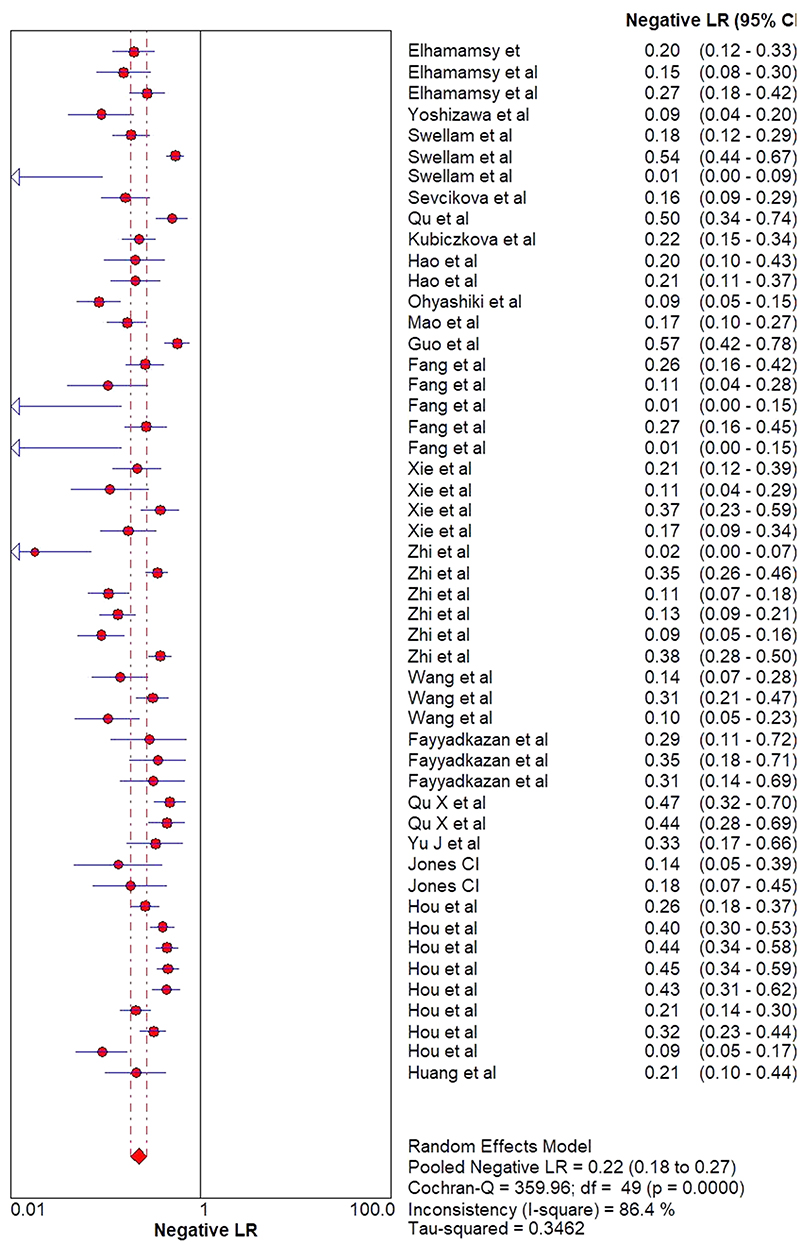
 | Figure 4 Forest plot of the negative likelihood ratio (NLR). |
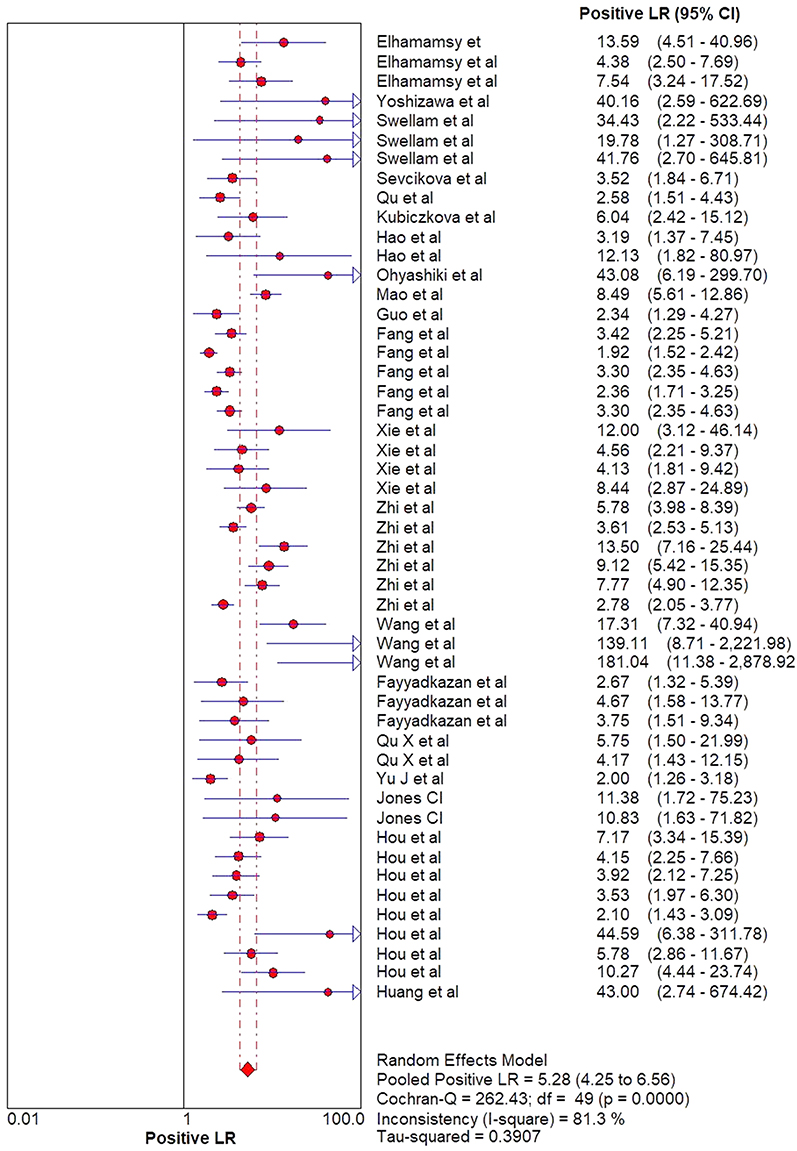
 | Figure 5 Forest plot of the positive likelihood ratio (PRL). |
 | Figure 6 Forest plot of diagnostic odds ratio (DOR). |
MicroRNAs (miRNAs) are a short, single and small non - coding family of RNAs (21~25 nucleotides)13,14 that target more than 30% of human genes.15 The discovery of miRNAs has dramatically affected our current understanding of gene regulation and prospects for identifying biomarkers for cancers. Circulating microRNAs are a group of microRNAs that emanate from tissue and appears in cell-free body fluids. MicroRNA can not only be detected in tissue samples but also serum, urine, blood and other accessible sources with minimal invasiveness. The deregulation of microRNA is very much established in a variety of diseases; direct causal connections have only recently been clarified. Tumours regularly present overexpression of miRNA levels as a result of biogenesis pathway defects, genetic loss and epigenetic silencing. A study by Guo et al showed that there was an overexpression of miR-221 levels in NTCL patients. This indicates that the impairment of the pathological regulatory mechanism of microRNA is connected to haematological malignant development.16–23 Again, there was an association between the overexpression of miR-181-5p level and poor survival outcomes in AML patient.24 Ohyashik et al also showed that miR-92 plasma levels were deficient in lymphoma patients compared to healthy controls.21 Besides, circulating miRNAs have been reported to be stable in serum and plasma and can withstand RNAs digestion as they are found in microvesicles such as apoptotic bodies and exosomes.25 Moreover, we can also quantify its levels with miRNA assay.26,27 Therefore, deregulation of miRNAs could serve as a conspicuous sign for haematological cancers. Even though past studies have indicated that miRNAs can serve as a possible biomarker in haematological malignancies diagnosis, the findings of these studies contain discrepancies and inconsistencies. Guo et al demonstrated that NTCL patients had an increased miR-221 level compared to healthy people, with a specificity of 75.7% and a sensitivity of 57.5% in NTCL patients.20 Xie et al studies showed a specificity of 93% and a sensitivity of 80% of miR-221 in patients with AML.28 Both results indicate that miR-221 can serve as a diagnostic biomarker in patients with AML than NTCL patients. Hao et al reported 77% specificity and 60% sensitivity in serum specimen,22 with 91.9% sensitivity and 99.1% specificity as tests based on plasma specimens.29 Race, size of sample, study design, sample type and type of miRNA profiling may have led to conflicting findings from recent studies hence the differences between studies need to be evaluated systematically. Therefore, this meta-analysis was carried out to provide a comprehensive evaluation and an up - to - date assessment of the overall accuracy of miRNA detection in the diagnosis of haematological cancers.
Materials and methods
Searching and screening of literature
We conducted extensive searches in a variety of databases, including Google Scholar, PubMed, Cochrane Library, EMBASE and Baidu Xushe up to 19th August 2017. The following keywords were used to identify the studies: (1) circulating microRNA or miRNA; (2) diagnostic biomarker; (3) sensitivity (4) specificity or ROC curve; (5) haematological cancer or haematological malignancy (6) lymphoma; (7) multiple myeloma (8) leukaemia. Furthermore, we involved other relevant articles discovered through manual searching.
Exclusion and inclusion criteria
The inclusion criteria were as follows: (1) healthy individuals are used as controls; (2) any haematological cancer type; (3) studies that provided information on specificity (4) sensitivity (5) sample size; and (6) miRNAs are measured in serum or plasma. The criteria for exclusion included: 1) publications with incomplete information, (2) letters, (3) conference abstracts, and (4) duplicate publications.
Quality assessment and data extraction
Two reviewers (Kwateng and Waqas) independently evaluated the eligibility of the selected studies. Another investigator (Gloria) also participated in the extraction of data. Any disagreements and discrepancies were resolved through full dialogue with the third investigator. The name of author, year of publication, country, sample size, ethnicity, type of miRNA profiling, disease type, specimen, miRNAs expression, sensitivity, specificity, true-positive (TP), false negative (FN), true- negative (TN) and false-positive (FP) were the data extracted from the included studies. QUADAS-2 (Quality Assessment of Diagnostic Accuracy Studies 2) was used for assessing the risk of publication bias, and quality of studies included,30 and the quality of the reporting of the studies included was evaluated following their compliance with the PRISMA statement.
Statistical analysis
We used Meta Disc version 1.4, Revman 5.3 and STATA 12.0 statistical software to carry out all analyses.31–33 According to the guidelines for meta-analysis of diagnostic accuracy,34 accuracy data were obtained from each study, including true positive (TP), false positive (FP), true negative (TN) and false negative (FN). The positive likelihood ratio (PLR), the negative likelihood ratio (NLR), the diagnostic odds ratio (DOR) and their (95% CIs) 95% confidence intervals were determined to evaluate the ability to differentiate healthy individuals from cancer patients. The area under the curve (AUC) of the summary receiver operator characteristic (SROC) curve and the diagnostic odds ratio (DOR) were used in the evaluation of the overall performance of each diagnostic test. The heterogeneity between the specificity and sensitivity data of the studies was evaluated by index (I2). A high value of I2 (>50%) indicated heterogeneity. Subgroups analysis was used to investigate possible sources of heterogeneity between the included studies.
Results
Characteristics of included studies
The flow diagram for the included studies is shown in (Figure 1). A total of 682 articles were identified through the electronic database search (n=673) and other sources (n=9). After 150 duplicates were removed, five hundred and thirty-two (532) records were left for further screening. After that, 459 records were excluded because they did not meet our criteria for inclusion. Full text of the remaining 73 articles was read to evaluate the eligibility and 53 were excluded further. Finally, our quantitative analysis included 20 records four (4) of which were on lymphoma, seven (7) were on AML, and nine (9) were on multiple myeloma. The characteristics of the studies included are shown in (Table 1).16,17,19–24,28,29,35–44 A total of 1,389 haematological cancer patients (433 leukaemia, 391 lymphomas and 565 MM) and 1013 healthy controls were investigated. In all studies, quantitative real-time chain reaction polymerase (qRT-PCR) tests were used to detect expression levels of miRNAs in either plasma (n=28) or serum (n=22). Thirty-six (36) of the studies included focused on Asian populations, 6 focused on African population while the remaining 8 investigated European populations. Of the 50 studies, 5 were in multiple miRNAs thus in 5 of the studies analysis, the sensitivity, specificity, positive likelihood ratio and the negative likelihood ratio was calculated using two or more miRNAs combined together, and 45 were in single miRNAs indicate that in 45 of the studies analysis the sensitivity, specificity, positive likelihood ratio and the negative likelihood ratio was calculated by using only one miRNA.
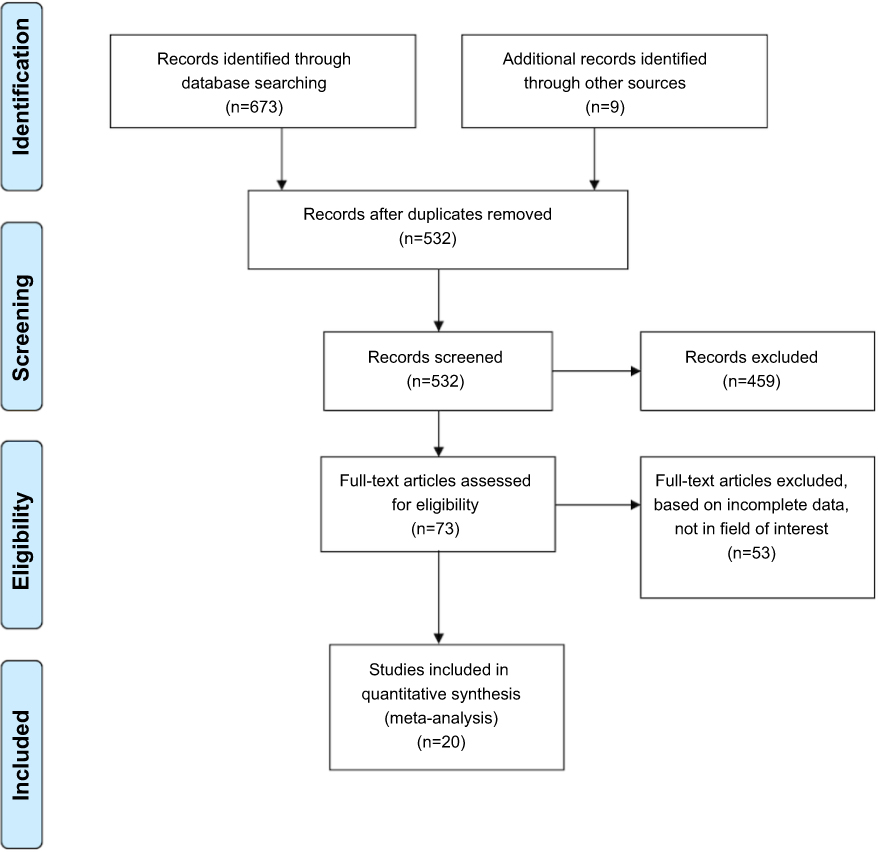 | Figure 1 Flowchart of studies selection. |
Analysis of diagnostic accuracy
We found significant heterogeneity of (I2 =88.1% for sensitivity and I2 =84.0% for specificity) after we initially evaluated the specificity and sensitivity results of all eligible studies. The forest plots of sensitivity, specificity, PLR, NLR and DOR are shown in (Figures 2–6) respectively. The pooled specificity was 0.85 (95% CI, 0.83–0.86), sensitivity was 0.81 (95% CI, 0.79–0.82), NLR was 0.22 (95% CI, 0.18–0.27), PLR was 5.28 (95% CI: 4.25–6.56) and DOR was 30.30 (95% CI, 21.19–43.61). These results showed that miRNAs could distinguish patients with haematological cancer from healthy individuals. The overall results of the SROC curve are shown in Figure 7. The AUC was 0.91 (95% CI, 0.88–0.93), suggesting that miRNAs could be useful for the diagnosis of haematological cancer.
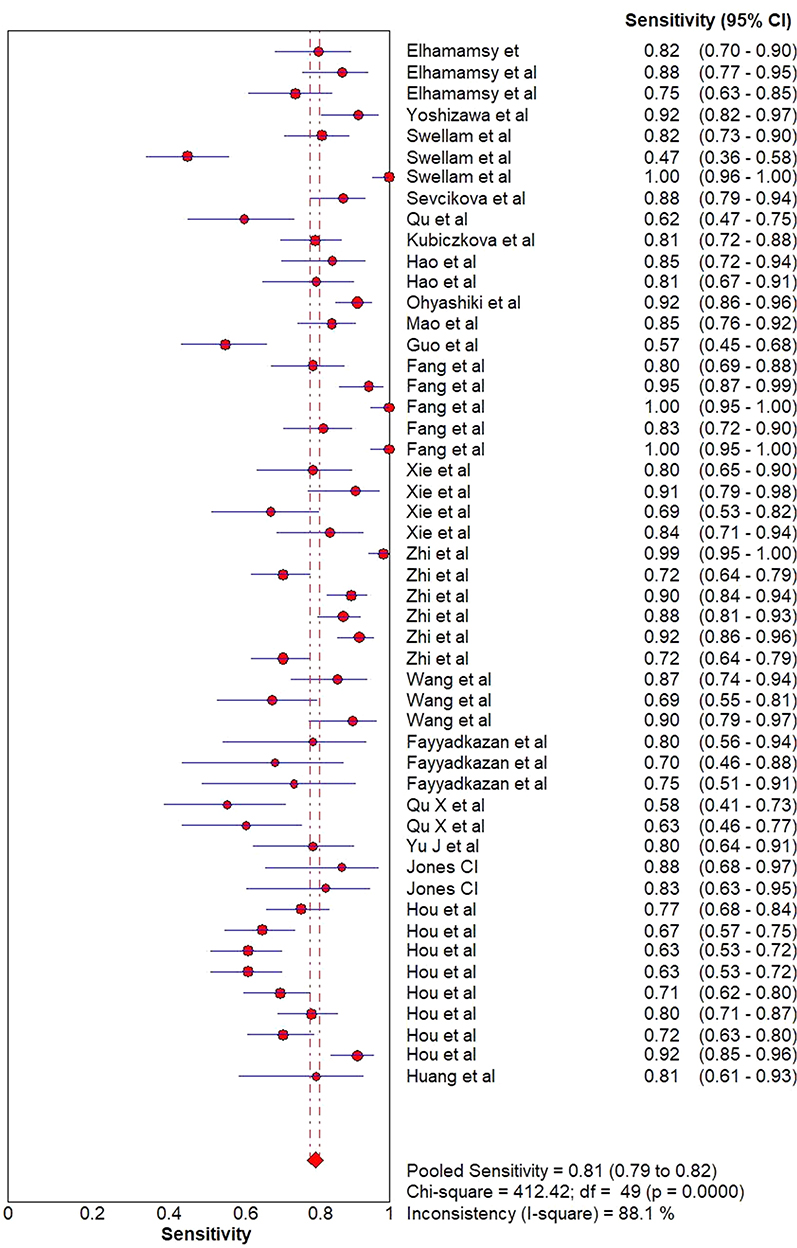 | Figure 2 Forest plot of sensitivity. |
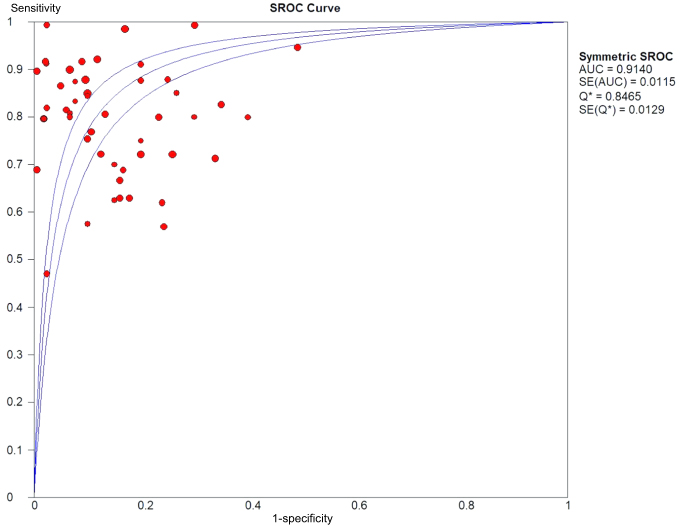 | Figure 7 Summary ROC curve for the included studies. |
Subgroup analysis and meta-regression
Our subgroup analysis outcomes are shown in (Table 2). Studies in leukaemia patients specifically AML subtype showed significantly better results than multiple myeloma and lymphoma patients. This result indicates that miRNAs assay showed high diagnostic accuracy and improved its efficiency in differentiating leukaemia patients from ordinary people. We further carried out an ethnicity-based subgroup analysis. The pooled sensitivity for the African population was 0.84 (95% CI, 0.82–0.90) and the specificity was 0.91(95% CI, 0.87–0.95) with a DOR of 55.22 (95% CI, 21.23–143.64) and an AUC of 0.95. Asian population group was 0.84 (95% CI, 0.80–0.88) and the specificity was 0.84 (95% CI, 0.82–0.85) with a DOR of 26.61(95% CI, 17.55–40.36) and an AUC of 0.94. The pooled sensitivity for the European population group was 0.84 (95% CI, 0.80–0.88) and the specificity was 0.84 (95% CI, 0.79–0.89) with a DOR of 22.98 (95% CI, 12.34–42.77) and an AUC of 0.89. The best diagnostic accuracy was found in African populations compared to the Asian and European populations. Furthermore, a PLR of 4.92 promising results was showed when the analysis of the type of miRNA profile subgroup was carried out. Single miRNA demonstrated a specificity of 0.84, sensitivity of 0.78, NLR of 0.24, PLR of 4.92, DOR of 25.37 and an AUC of 0.90 whiles multiple miRNAs showed a higher specificity of 0.94, a sensitivity of 0.88, DOR of 93.15 and an AUC of 0.92, reflecting a higher diagnostic potential. Also, a comparison between the expression levels of miRNA in plasma and serum revealed that the specificity in plasma was higher 0.89 than in serum 0.81. The PLR and DOR of plasma miRNAs are 6.29 and 30.77 respectively compared to 4.69 and 27.56 of serum miRNAs, demonstrating that plasma miRNAs can be used as a reliable diagnostic biomarker.
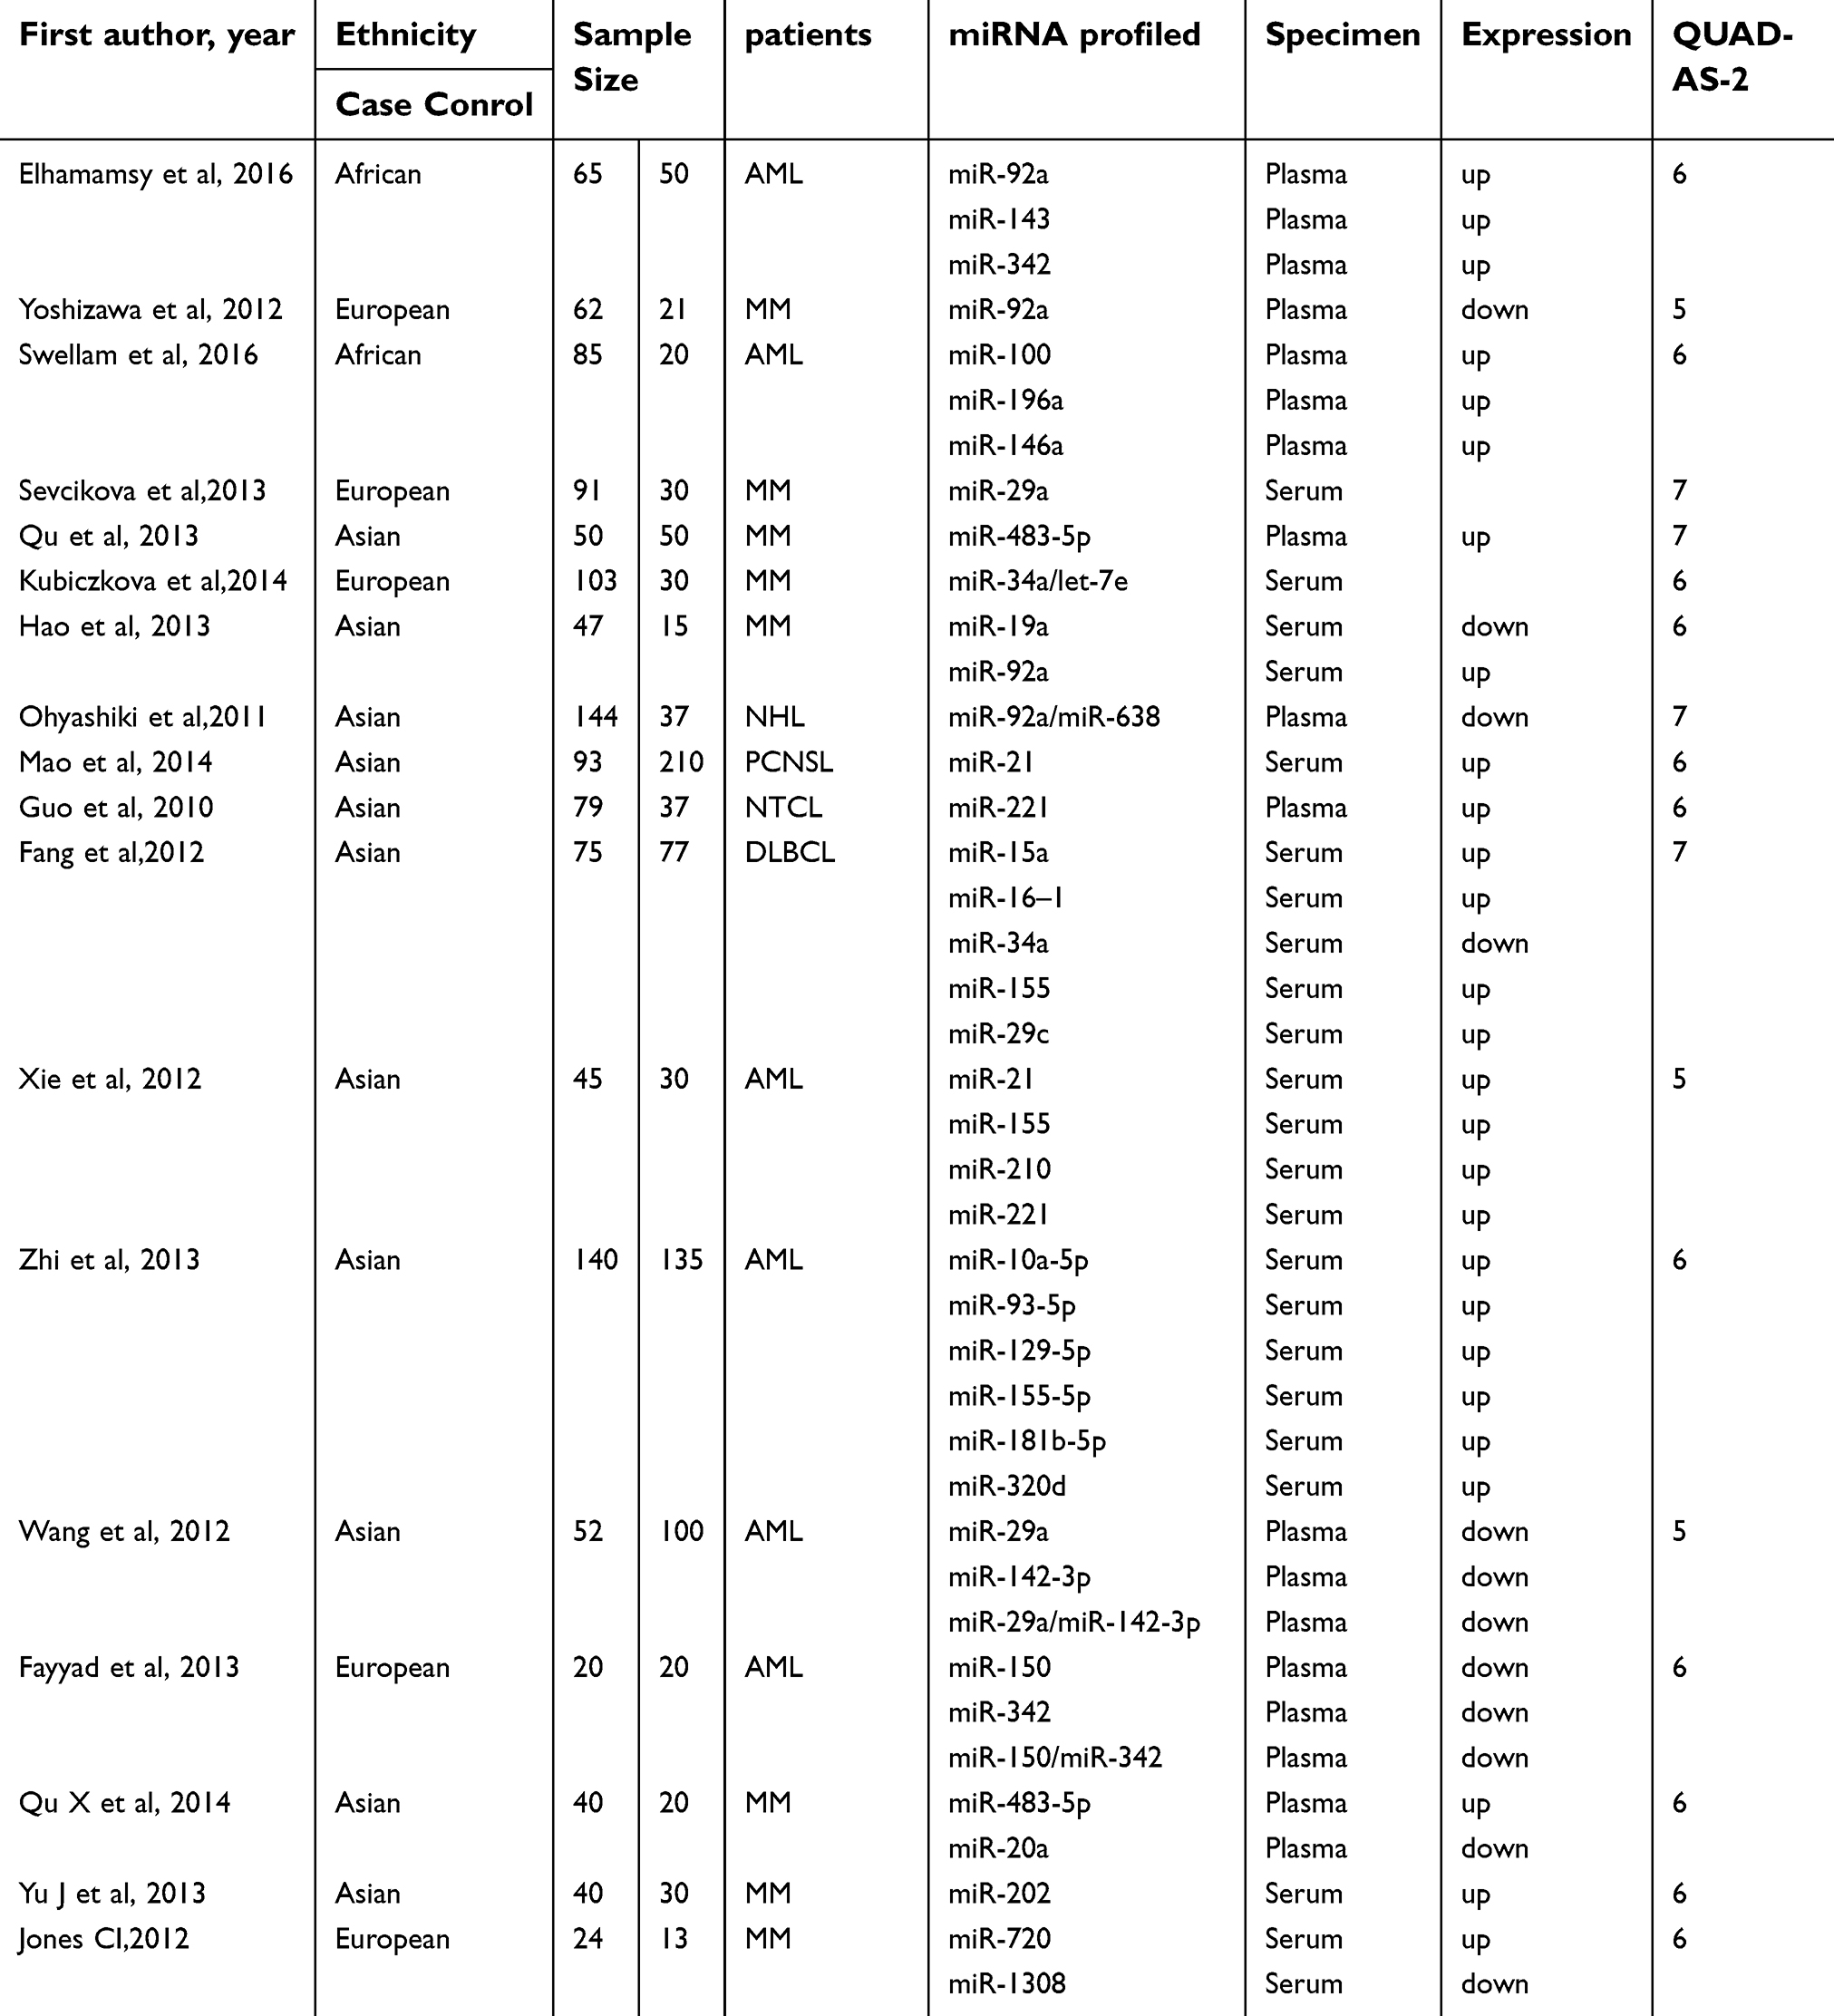 | Table 1 Characteristics of included studies |
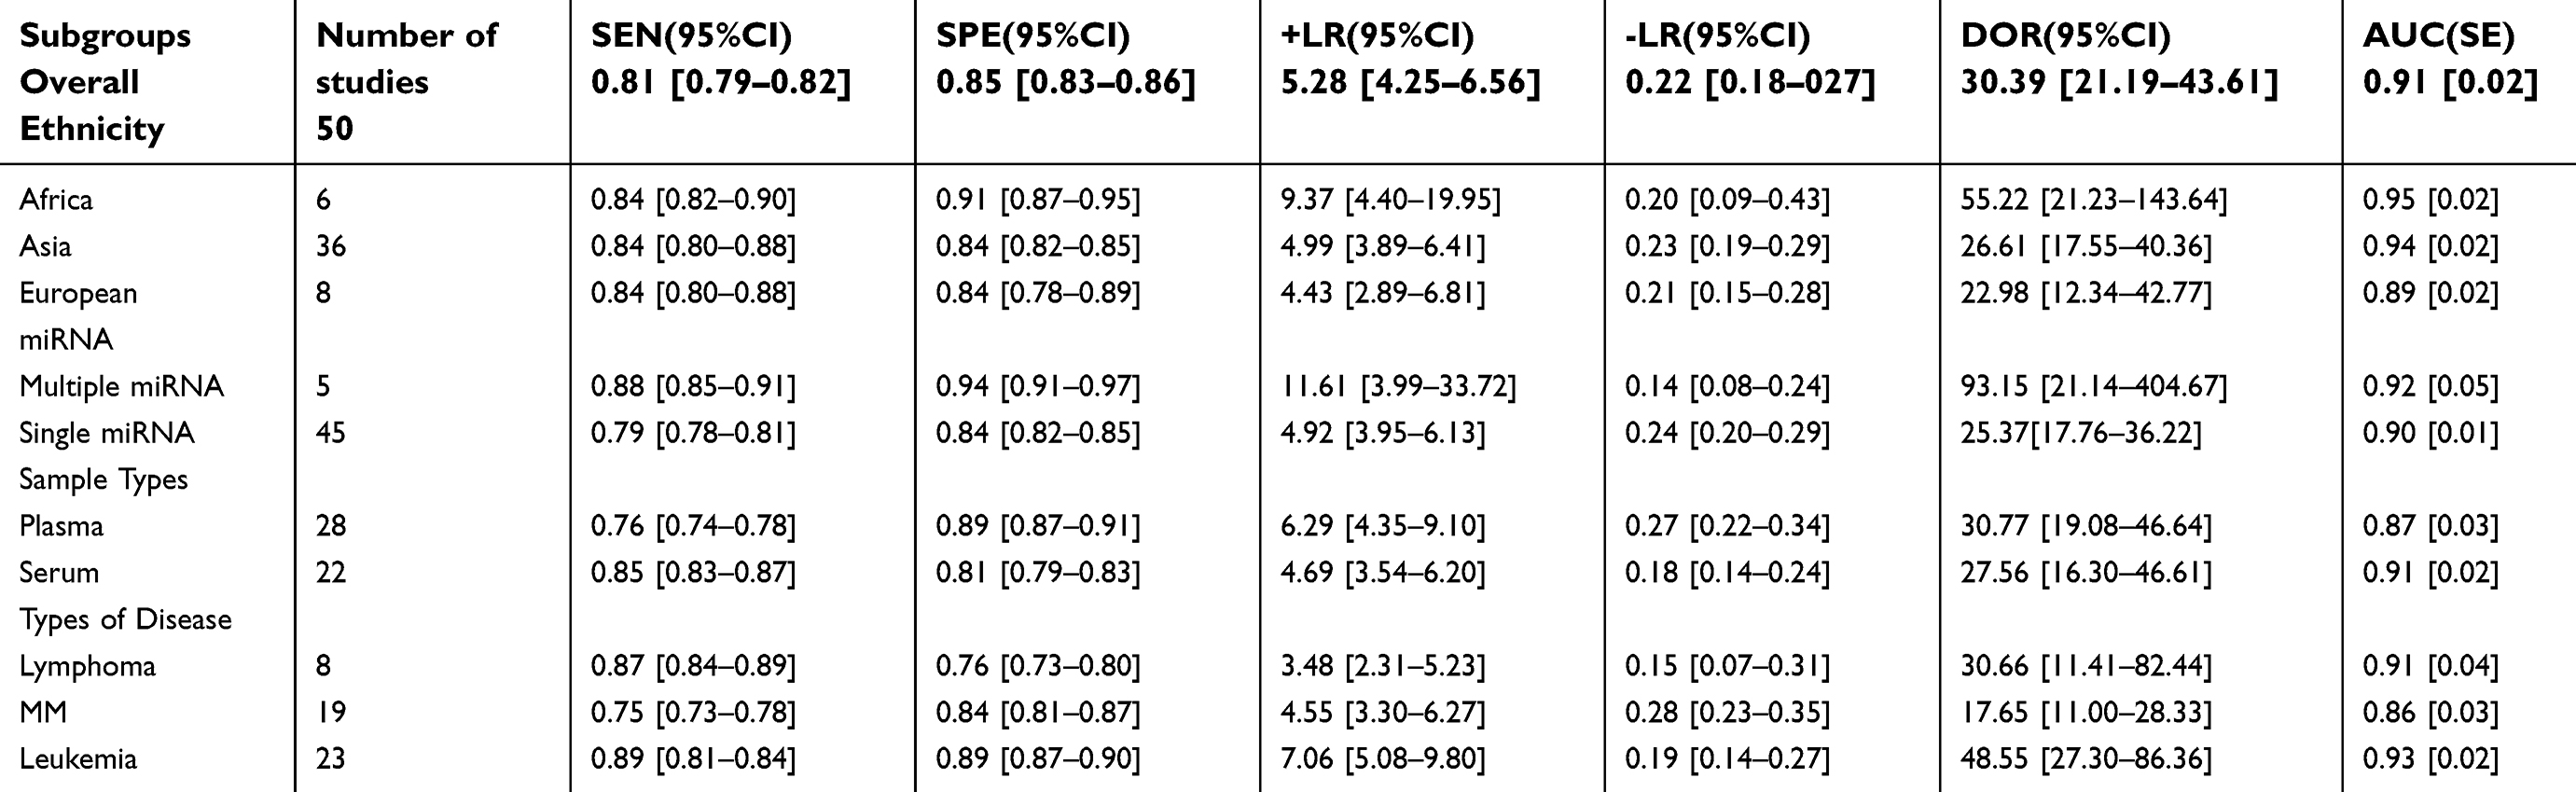 | Table 2 Summary of subgroup analysis for circulating miRNA in haematological cancer diagnosis |
Diagnostic threshold effect analysis
The threshold effect is a crucial heterogeneity source in diagnostic testing. The differences in the specificity and sensitivity lead to the threshold effect. The Spearman correlation coefficient of sensitivity and specificity26 is an acceptable approach for assessing the threshold effect. Our study analyses showed that the Spearman correlation coefficient was −0.07 (P=0.64) in a total of 50 studies, indicating that the threshold effect did not cause heterogeneity.
Discussion
The number of deaths caused by haematological cancer seems to be increasing due to insufficient knowledge concerning the cause of disease.2,45,46 Most patients usually are asymptomatic therefore making the diagnosis tougher. Fever, bleeding, and lymphadenopathy are symptoms observed in patients with AML, whiles patients with diffuse large B-cell lymphoma are seen with precancerous lesions, whiles anaemia and higher calcium levels are evident in MM patients.46–48 In any case, notwithstanding when clinical signs are seen, traditional treatments are not sufficiently effective in curing many patients because of the low precision of recent diagnostic techniques, mind-boggling expense, and unsafe nature of the current diagnostic methods.18 In this way, noninvasive and early strategies for haematological malignancy detection are vital in enhancing the results of haematological malignancies. Several studies have currently examined the possible benefits of circulating microRNAs in detecting haematological cancers but with an inconsistent conclusion. We, therefore, carried out this study to evaluate if miRNAs can be used as a diagnostic biomarker to improve the detection of haematological cancers early.
In our study, an overall 0.85 of specificity, 0.81 of sensitivity, and 0.91 of AUC showed that an overall high accuracy was attained when circulating miRNAs was used as a diagnostic biomarker in haematological cancers. Also, the 5.3 value of the positive likelihood shows a nominal capacity of miRNAs to distinguish patients with haematological cancers from normal people. Also, the 0.22 value of the negative likelihood ratio shows its capacity to exclude patients who are without cancers. The DOR result in our study was 30.39 which shows a high overall accuracy level in the 50 studies.
Furthermore, we analysed heterogeneity source via carrying out analyses of subgroup based on these factors: patient’s classification, ethnicity, classification of microRNA profile and specimen classification (serum or plasma). Patients were grouped into three different sections based on cancer classification: MM, AML and lymphoma. The overall accuracy detection was highest in AML patients despite the high relative value in MM and lymphoma patients. Consequently, miRNAs can be a useful biomarker for haematological cancers, particular in AML patients. Furthermore, it is fundamental and essential to comprehend the connection between the progression of disease and microRNAs in distinguishing microRNAs as diagnostic markers in haematological malignancies. Microvesicles such as exosomes release miRNAs from cells.25 The decrease in the sensitivity of certain microRNAs could be attributed to the intake of exosomes by tumour cells, leading to a decline in the plasma expression of microRNAs in the exosomes.18,21 In contrast, the upregulation of certain miRNAs may be due to cells infiltrating the lymphomas and miRNAs obtained from dying tumour cells.
Additionally, our subgroup results based on microRNAs profile type revealed combined microRNAs to be most favourable than single microRNA when used in detecting haematological malignancies as diagnostic biomarkers which is steady and the same with past investigations. Hao et al reported that combined miR-19a and miR-92a could be useful in differentiating patients with multiple myeloma from normal individuals with 80% specificity and 82% sensitivity compared to 80% specificity and 67% sensitivity of single miR-19a and 77% specificity and 60% sensitivity of single miR-92a.22 Again, Wang et al demonstrated that a better diagnostic result was obtained when two miRNAs were combined with a sensitivity of 89.9% and a specificity of 100% in comparison to when a single miRNA is used.36 It has been reported that there is a linkage of different racial expression profiles with the concentration of circulating miRNA.
We additionally investigated if ethnicity influences the circulation of microRNAs and got comparative outcomes. Contrasted with Asian and Europeans populaces, the African population had the highest DOR estimation of 55.22, and the AUC was 0.95, recommending that miRNAs in African populations could be more precise. Li et al and Xu et al reported that the Asian population had the highest DOR value and AUC because their analysis involved only Asian and Europeans.33,34 However, extensive studies concentrating on racial differential backgrounds are necessary to validate these discoveries.
Also for the sample type, the profile expressions of microRNA were reported to differ significantly between the serum and the plasma. McDonald et al showed that was a higher concentration of miRNA in plasma compared to serum hence sample types are crucial in the investigation of the usefulness of circulating microRNAs as biomarkers.49 We additionally demonstrated that microRNAs assay utilizing plasma specimens had a higher diagnostic accuracy of 0.89 specificity and DOR of 30.77 in comparison to serum specimen with 0.81 specificity and DOR of 27.56. This outcome can be connected to the progression and beginning of haematological malignancies because the cancer proliferation of plasma cells in the bone marrow leads to multiple myeloma.47
Our present meta-analysis has many advantages compared with past investigations. First of all, we involved a number of microRNAs evaluated in past studies, which improves the authenticity of our diagnostic value outcomes. Secondly, more studies were included by undertaking thoughtful search terms for new works of literature, making it the largest sample size as compared to previous studies. Furthermore, subgroup analyses were carried out to identify possible heterogeneity sources. We also used Meta-Disc 1.4 software to analyse the past individual investigations quantitatively. The Meta-Disc software is a unique and comprehensive diagnostic meta-analysis software and has severally been quoted in numerous meta-analysis of high-quality, demonstrating an excellent software performance.26 Our outcomes are very promising and encouraging since it is the first meta-analysis study involving statistical data concerning African populations as previous studies did not.
However, our study still has some limitations. Firstly, the subgroup classification based on age, the subtype of leukaemia and gender was not taken into consideration in our studies due to relatively fewer studies, smaller sample sizes and lack of information from the studies included. Secondly, there is no agreement about the endogenous reference for the quantification of circulating microRNA. For instance, Tanaka et al used miR-683 while Fayyad-Kazan et al selected miR-16 in the quantification of plasma microRNA as an endogenous referencing30,50 because the serum or plasma expression of miR-683 and miR-16 was consistently reported in differential human tissues and agnate in patients and healthy individuals.42,51,52 However, the other studies included did not give the details of their different accession.
Conclusion
In conclusion, our outcomes demonstrated the possible value of circulating microRNAs in haematological cancers diagnosis. Also, microRNAs panels can be used as a useful diagnostic biomarker in the African population in diagnosing leukaemia. Our result also emphasises the potential value of plasma as a more favourable specimen to detect the expression of microRNAs than serum. More researches are needed to confirm our findings.
Availability of materials
The data analysed for the current study is available with the corresponding author and can be released on reasonable request.
Acknowledgments
This study was partially supported by the National Natural Science Foundation of China (No. 81273259, No. 81471589), the Health Bureau of Henan Province, P.R. China (No. 201201005) and the foundation and frontier research grant of Henan provincial science and technology bureau, P.R. China (No.112300410027, No. 132102310120).
Disclosure
The authors report no conflicts of interest in this work.
References
1. Estey E, Dohner H. Acute myeloid leukaemia. Lancet. 2006;368:1894–1907. doi:10.1016/S0140-6736(06)69780-8
2. Rodriguez-Abreu D, Bordoni A, Zucca E. Epidemiology of hemato- logical malignancies. Ann Oncol. 2007;18. doi:10.1093/annonc/mdl443
3. Stone RM, O’Donnell MR, Sekeres MA. Acute myeloid leukemia. Hematology Am Soc Hematol Educ Program. 2004;98–117. doi:10.1182/asheducation-2004.1.98
4. Gregory TK, Wald D, Chen Y, Vermaat JM, Xiong Y, Tse W. Molecular prognostic markers for adult acute myeloid leukemia with normal cytogenetics. J Hematol Oncol. 2009;2:23. doi:10.1186/1756-8722-2-23
5. Slater DN. The new World Health Organization classification of haematopoietic and lymphoid tumours: A dermatopathological perspective. Br J Dermatol. 2002;147:633–639.
6. Jaffe ES, Harris NL, Stein HJ, Vardiman JW. Pathology and genetics: tumours of haematopoietic and lymphoid tissues (WHO Classification of Tumours). IARC. 2001;3:1–351.
7. Kalia M. Biomarkers for personalized oncology: recent advances and future challenges. Metabolism. 2015;64:S16–S21. doi:10.1016/j.metabol.2014.10.027
8. Orfao A, Lopez A, Flores J, Almeida J. Diagnosis of hematological malignancies: new applications for flow cytometry. Hematol (EHA). 2006;2:6–13.
9. Belov L, Huang P, Barber N, Mulligan SP, Christopherson RI. Identification of repertoires of surface antigens on leukemias using an antibody microarray. Proteomics. 2003;3:2147–2154.
10. Martin DJ, Anders HL. MicroRNA and cancer. Mol Oncol. 2012;6:590–610. doi:10.1016/j.molonc.2012.09.006
11. Ruiz-Arguelles A, Rivadeneyra-Espinoza L, Duque RE, Orfao A. Report on the second Latin American consensus conference for flow cytometric immunophenotyping of hematological malignancies. Cytometry B Clin Cytom. 2006;70:39–44. doi:10.1002/cyto.b.20083
12. Carter P. Improving the efficacy of antibody-based cancer therapies. Nat Rev Cancer. 2001;1:118–129. doi:10.1038/35101072
13. Schroers R, Baraniskin A, Heute C, et al. Detection of free immunoglobulin light chains in cerebrospinal fluids of patients with central nervous system lymphomas. Eur J Haematol. 2010;85:236–242. doi:10.1111/j.1600-0609.2010.01475.x
14. Esquela-Kerscher A, Slack FJ. Oncomirs—microRNAs with a role in cancer. Nat Rev Cancer. 2006;6:259–269. doi:10.1038/nrc1840
15. Lagos-Quintana M, Rauhut R, Lendeckel W, Tuschl T. Identification of novel genes coding for small expressed RNAs. Science. 2001;294:853–858. doi:10.1126/science.1064921
16. Sevcikova S, Kubiczkova L, Sedlarikova L, Slaby O, Hajek R. Serum miR-29a as a marker of multiple myeloma. Leuk Lymphoma. 2013;54:189–191. doi:10.3109/10428194.2013.796052
17. Lin S, Pan L, Guo S, et al. Prognostic role of microRNA-181a/b in hematological malignancies: a meta-analysis. PLoS One. 2013;8:e59532. doi:10.1371/journal.pone.0059532
18. Baraniskin A, Kuhnhenn J, Schlegel U, et al. Identification of microRNAs in the cerebrospinal fluid as marker for primary diffuse large B-cell lymphoma of the central nervous system. Blood. 2011;117:3140–3146. doi:10.1182/blood-2010-09-308684
19. Fang C, Zhu DX, Dong HJ, et al. Serum microRNAs are promising novel biomarkers for diffuse large B cell lymphoma. Ann Hematol. 2012;91:553–559. doi:10.1007/s00277-011-1350-9
20. Guo HQ, Huang GL, Guo CC, Pu XX, Lin TY. Diagnostic and prognostic value of circulating miR-221 for extranodal natural killer/T-cell lymphoma. Dis Markers. 2010;29:251–258. doi:10.1155/2010/474692
21. Ohyashiki K, Umezu T, Yoshizawa S, et al. Clinical impact of down-regulated plasma miR-92a levels in non-Hodgkin’s lymphoma. PLoS One. 2011;6:e16408. doi:10.1371/journal.pone.0016408
22. Hao M, Zang M, Qin Y, et al. Circulating MIR-19A and MIR-92A in serum as potential biomarkers for detecting multiple myeloma. Clin Lymphoma Myeloma and Leuk. 2013;13:S198–9.
23. Kubiczkova L, Kryukov F, Slaby O, et al. Circulating serum microRNAs as novel diagnostic and prognostic biomarkers for multiple myeloma and mono- clonal gammopathy of undetermined significance. Haematologica. 2014;99:511–518. doi:10.3324/haematol.2013.093500
24. Zhi F, Cao X, Xie X, et al. Identification of circulating microRNAs as potential biomarkers for detecting acute myeloid leukemia. Plos One. 2013;8:e56718.
25. Mitchell PS, Parkin RK, Kroh EM, et al. Circulating microRNAs as stable blood-based markers for cancer detection. Proc Natl Acad Sci U S A. 2008;105:10513–10518. doi:10.1073/pnas.0804549105
26. Ferracin M, Veronese A, Negrini M. Micromarkers: miRNAs in cancer diagnosis and prognosis. Expert Rev Mol Diagn. 2010;10:297–308. doi:10.1586/erm.10.11
27. Kosaka N, Iguchi H, Ochiya T. Circulating microRNA in body fluid: a new potential biomarker for cancer diagnosis and prognosis. Cancer Sci. 2010;101:2087–2092. doi:10.1111/j.1349-7006.2010.01605.x
28. Xie HT, Chu ZX, Wang H. Serum microRNA expression profile as a biomarker in diagnosis and prognosis of acute myeloid leukemia. J Clin Pediatr. 2012;30:421–424.
29. Yoshizawa S, Ohyashiki JH, Ohyashiki M, et al. Downregulated plasma miR-92a levels have clinical impact on multiple myeloma and related disorders. Blood Cancer J. 2012;2:e53. doi:10.1038/bcj.2011.51
30. Whiting PF, Rutjes AW, Westwood ME, et al. QUADAS-2: a revised tool for the quality assessment of diagnostic accuracy studies. Ann Intern Med. 2011;155:529–536. doi:10.7326/0003-4819-155-8-201110180-00009
31. Deville WL, Buntinx F, Bouter LM, et al. Conducting systematic reviews of diagnostic studies: didactic guidelines. BMC Med Res Methodol. 2002;2:9. doi:10.1186/1471-2288-2-9
32. Zamora J, Abraira V, Muriel A, Khan K, Coomarasamy A. Meta-DiSc: A software for meta-analysis of test accuracy data. BMC Med Res Methodol. 2006;6:31. doi:10.1186/1471-2288-6-31
33. Quan L, Liu L. Weiming Li: identification of circulating microRNAs as biomarkers in diagnosis of haematological cancers: a meta-analysis. Tumor Biol. 2014;35:10467–10478. doi:10.1007/s13277-014-2364-4
34. Li-Hua X, Guo Y, Xue-Li Z, et al. Blood-based circulating microRNAs are potential diagnostic biomarkers for leukaemia: results from a meta-analysis. Cell Physiol Biochem. 2016;38:939–949. doi:10.1159/000443046
35. Fayyad-Kazan H, Bitar N, Najar M, et al. Circulating miR-150 and miR-342 in plasma are novel potential biomarkers for acute myeloid leukemia. J Transl Med. 2013;11:31. doi:10.1186/1479-5876-11-31
36. Wang F, Wang XS, Yang GH, et al. miR-29a and miR-142-3p downregulation and diagnostic implication in hu- man acute myeloid leukemia. Mol Biol Rep. 2012;39:2713–2722. doi:10.1007/s11033-011-1026-5
37. Hao M, Zang M, Yu Q, et al. Serum miR-4254, miR-19a and miR-33b are potential markers for diagnosis and prognostic evaluation in multiple myeloma. Blood. 2013;122. doi:10.1182/blood-2012-12-471029
38. Qu X, Zhao M, Wu S, et al. Circulating microrna 483-5p in multiple myeloma as a novel biomarker for diagnosis and predicting survival. Blood. 2013;122. doi:10.1182/blood-2012-12-471029
39. Hao M, Zang M, Wendlandt E, et al. Low serum miR-19a expression as a novel poor prognostic indicator in multiple myeloma. Int J Cancer. 2015;136:1835–1844. doi:10.1002/ijc.29199
40. Yu J, Qiu X, Shen X, et al. miR-202 expression concentration and its clinical significance in the serum of multiple myeloma patients. Ann Clin Biochem. 2014;51:543–549. doi:10.1177/0004563213501155
41. Jones CI, Zabolotskaya MV, King AJ, et al. Identification of circulating microRNAs as diagnostic biomarkers for use in multiple myeloma. Br J Cancer. 2012;107:1987–1996. doi:10.1038/bjc.2012.525
42. Huang S, Lu Y, Liu J. Expression and clinical significance of circulating miR-335 in patients with acute myeloid leukemia. Exp Lab Med. 2015;33:147–149.
43. Elhamamsy AR, El Sharkawy MS, Zanaty AF, et al. Circulating miR-92a, miR-143 and miR-342 in plasma are novel potential biomarkers for acute myeloid leukemia. Int J Mol Cell Med Spring. 2017;6(2):76–86.
44. Swellam M, El-Khazragy N. Clinical impact of circulating microRNAs as blood-based marker in childhood acute lymphoblastic leukemia. Tumor Biol. 2016;37:10571–10576. doi:10.1007/s13277-016-4948-7
45. Frankfurt O, Licht JD, Tallman MS. Molecular characterization of acute myeloid leukemia and its impact on treatment. Curr Opin Oncol. 2007;19:635–649. doi:10.1097/CCO.0b013e3282f10e55
46. Haferlach T, Bacher U, Haferlach C, Kern W, Schnittger S. Insight into the molecular pathogenesis of myeloid malignancies. Curr Opin Hematol. 2007;14:90–97. doi:10.1097/MOH.0b013e3280168490
47. Becker N. Epidemiology of multiple myeloma. Recent Results Cancer Res. 2011;183:25–35.
48. Jabbour EJ, Estey E, Kantarjian HM. Adult acute myeloid leukemia. Mayo Clin Proc. 2006;81:247–260. doi:10.4065/81.2.247
49. McDonald JS, Milosevic D, Reddi HV, Grebe SK, Algeciras-Schimnich A. Analysis of circulating microRNA: preanalytical and analytical challenges. Clin Chem. 2011;57:833–840. doi:10.1373/clinchem.2010.157198
50. Tanaka M, Oikawa K, Takanashi M, et al. Down-regulation of miR-92 in human plasma is a novel marker for acute leukemia patients. PLoS One. 2009;4:e5532. doi:10.1371/journal.pone.0005532
51. Redova M, Poprach A, Nekvindova J, et al. Circulating miR-378 and miR-451 in serum are potential biomarkers for renal cell carcinoma. J Transl Med. 2012;10:55. doi:10.1186/1479-5876-10-233
52. Lawrie CH, Gal S, Dunlop HM, et al. Detection of elevated levels of tumour- associated microRNAs in serum of patients with diffuse large B-cell lymphoma. Br J Haematol. 2008;141:672–675. doi:10.1111/j.1365-2141.2008.07077.x
 © 2019 The Author(s). This work is published and licensed by Dove Medical Press Limited. The
full terms of this license are available at https://www.dovepress.com/terms
and incorporate the Creative Commons Attribution
- Non Commercial (unported, 3.0) License.
By accessing the work you hereby accept the Terms. Non-commercial uses of the work are permitted
without any further permission from Dove Medical Press Limited, provided the work is properly
attributed. For permission for commercial use of this work, please see paragraphs 4.2 and 5 of our Terms.
© 2019 The Author(s). This work is published and licensed by Dove Medical Press Limited. The
full terms of this license are available at https://www.dovepress.com/terms
and incorporate the Creative Commons Attribution
- Non Commercial (unported, 3.0) License.
By accessing the work you hereby accept the Terms. Non-commercial uses of the work are permitted
without any further permission from Dove Medical Press Limited, provided the work is properly
attributed. For permission for commercial use of this work, please see paragraphs 4.2 and 5 of our Terms.