Back to Journals » Cancer Management and Research » Volume 13
CircRNA circYY1 (hsa_circ_0101187) Modulates Cell Glycolysis and Malignancy Through Regulating YY1 Expression by Sponging miR-769-3p in Breast Cancer
Received 2 November 2020
Accepted for publication 18 December 2020
Published 9 February 2021 Volume 2021:13 Pages 1145—1158
DOI https://doi.org/10.2147/CMAR.S289172
Checked for plagiarism Yes
Review by Single anonymous peer review
Peer reviewer comments 2
Editor who approved publication: Dr Eileen O'Reilly
Xiaobin Zhang,1 Jiehua Li,1 Qin Feng2
1Department of Gastrointestinal and Gland Surgery, The First Affiliated Hospital of Guangxi Medical University, Nanning City, People’s Republic of China; 2Department of Pathology, Peking University Cancer Hospital & Institute, Beijing City, People’s Republic of China
Correspondence: Qin Feng
Department of Pathology, Peking University Cancer Hospital & Institute, No. 52 Fucheng Road, Haidian District, Beijing, 100142, People’s Republic of China
Tel/Fax +86 10-88121122
Email [email protected]
Background: Breast cancer (BC) is a highly heterogeneous malignant tumor that affects women’s health. Circular RNAs (circRNAs) are involved in tumor growth in many cancers. However, the role of hsa_circ_0101187 (circYY1) in BC is still unclear.
Methods: Expression of circYY1, microRNA (miR)-769-3p, and YY1 (Yin Yang 1) mRNA was tested by quantitative real-time polymerase chain reaction (qRT-PCR). Cell viability, colony formation, migration, and invasion were analyzed with MTT (3-(4,5-dimethylthiazol-2-yl)-2,5-diphenyltetrazolium bromide), colony formation, and transwell assays. Glucose uptake, lactate product, and ATP (adenosine triphosphate) content were detected with corresponding kits. Several protein levels were measured with Western blotting. The regulatory mechanisms of the circYY1, miR-769-3p, and YY1 were validated by RNA immunoprecipitation (RIP) assay, dual-luciferase reporter assay, and/or RNA pull-down assay. The role of circYY1 in BC was confirmed by xenograft assay.
Results: CircYY1 and YY1 were upregulated in BC, while miR-769-3p had an opposing result. Also, BC patients with high circYY1 expression had a poor prognosis. Downregulation of circYY1 decreased xenograft tumor growth in vivo. Both circYY1 inhibition and miR-769-3p elevation constrained BC cell viability, colony formation, migration, invasion, and glycolysis in vitro. CircYY1 acted as a sponge for miR-769-3p, which targeted YY1. CircYY1 sponged miR-769-3p to modulate YY1 expression. Both miR-769-3p inhibition and YY1 upregulation antagonized circYY1 silencing-mediated influence on malignancy and glycolysis of BC cells.
Conclusion: CircYY1 promoted glycolysis and tumor growth via increasing YY1 expression through sponging miR-769-3p in BC, offering a promising therapeutic target and prognostic biomarker for BC.
Keywords: BC, circYY1, miR-769-3p, YY1, glycolysis
Introduction
Breast cancer (BC) is a common malignant tumor that affects woman’s health. It is a highly heterogeneous disease with different behaviors and responses to different treatment options.1,2 At present, the main treatment methods for BC patients include cytotoxic chemotherapy, targeted therapy, and endocrine therapy, which depend on the individual’s BC subtype.3 Moreover, some patients will develop a more aggressive model, which is resistant to most treatment strategies.4 Also, the 5-year survival rate of BC patients with distant metastasis is about 23.4%.5 Therefore, exploring the molecular mechanisms related to the development of BC is the first step to develop new measures to interfere with the progress of BC.
Circular RNAs (circRNAs), a unique family of RNAs with a covalently closed-loop structure, are derived from alternative splicing of pre-mRNAs. CircRNAs are mainly distributed in the cytoplasm and are related to many biological functions, especially post-transcriptional regulation.6 Recent studies have uncovered that the aberrant expression of circRNAs is associated with the pathogenesis and progression of some diseases, especially in malignant tumors.7 For instance, circRNA circPRRC2A accelerated angiogenesis and metastasis through upregulating TRPM3 via sponging miR-514a-5p and miR-6776-5p in renal cell cancer.8 Moreover, a string of studies have uncovered that circRNAs regulates BC progression via sponging microRNAs (miRs). For example, circRNA circABCB10 accelerated BC advancement by absorbing miR-1271.9 CircRNA circRPPH1_015 upregulation impaired miR-326-mediated inhibitory influence on ELK1 expression, thereby accelerating the progression of BC.10 CircRNA circTADA2As could repress BC metastasis and growth via sponging miR-203a-3p and downregulating SOCS3.11
YY1 (Yin Yang 1), a zinc finger protein, can activate or inactivate gene expression based on chromatin structure, promoter background, and interacting partners.12 Also, YY1 can modulate the transcriptional activation and suppression of many genes related to cellular processes, including cell differentiation, division, apoptosis, survival, and autophagy.13 YY1 has been proved to be upregulated in diversiform tumors, including BC.14 Currently, 5 circRNAs (hsa_circ_0033169, hsa_circ_0101187, hsa_circ_0033170, hsa_circ_0033171, and hsa_circ_0033172) have been discovered to be derived from the YY1 gene (circbase and circbank databases) (http://www.circbank.cn/search.html?selectValue=YY1). However, the role and mechanism of circRNAs derived from the YY1 gene in BC progression are still unclear.
In this study, we discovered that hsa_circ_0101187 (circYY1) expression was elevated in BC tissues and cells and associated with a poor prognosis of BC patients. Moreover, circYY1 inhibition reduced glycolysis and tumor growth through the miR-769-3p/YY1 axis in BC. This research offered a novel mechanism to understand the progression of BC.
Materials and Methods
Case Selection
Seventy BC tissues and matched neighboring normal tissues were obtained from BC patients who did not receive radiotherapy, chemotherapy, or other anti-tumor therapies and underwent BC surgery at the First Affiliated Hospital of Guangxi Medical University. All registered BC patients had signed an informed consent. The research was approved by the Ethics Committee of the First Affiliated Hospital of Guangxi Medical University and performed based on the ethical guidelines of Helsinki. The clinicopathological parameters of BC patients were displayed in Table 1.
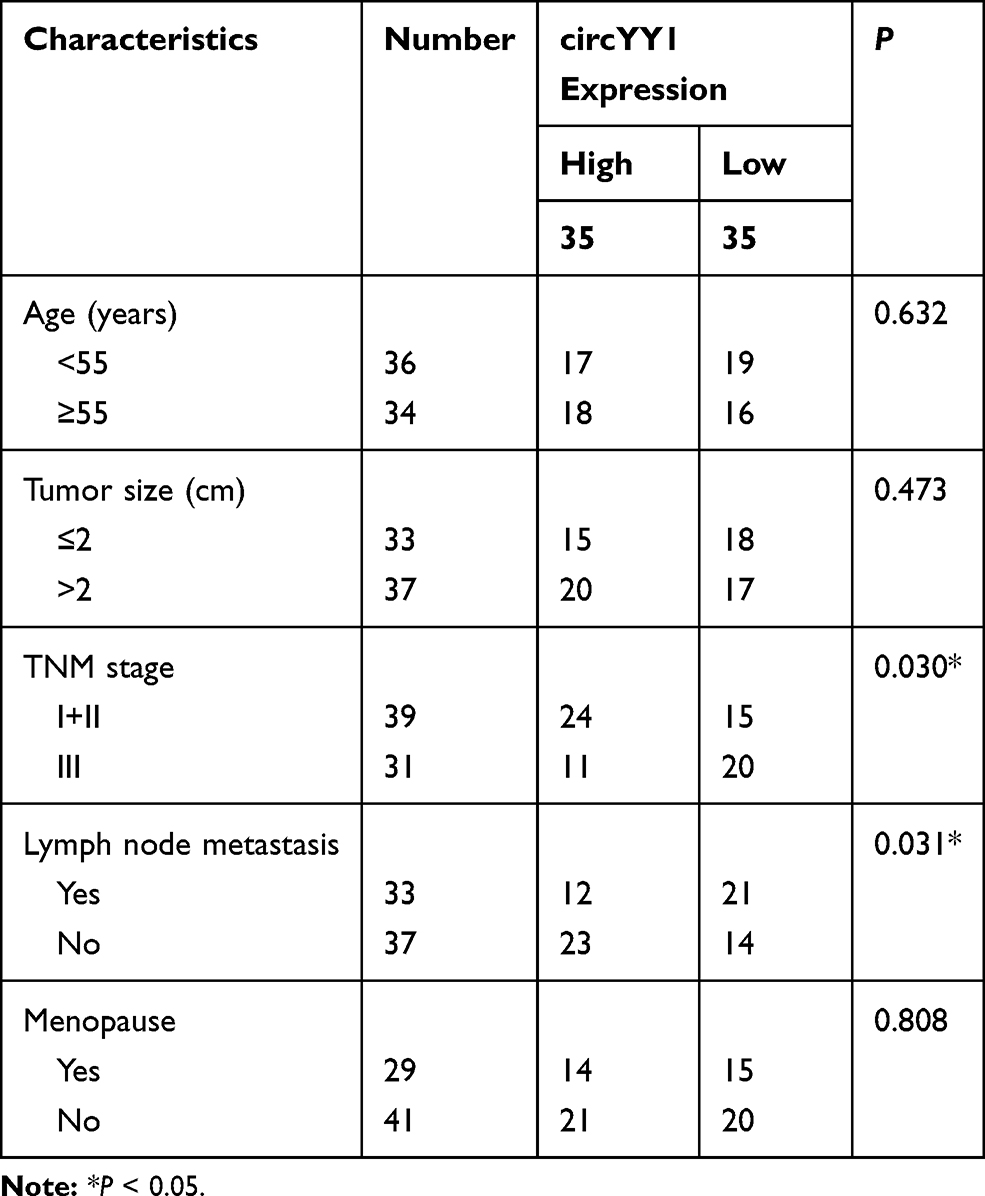 |
Table 1 Correlation Between circYY1 Expression and Clinicopathological Parameters of BC Patients |
Cell Culture
Normal breast epithelial cell line (MCF10A) and 5 BC cell lines (MCF7, BT549, MDA-MB-231, MDA-MB-468, and T47D) were bought from American Tissue Type Culture Collection (Manassas, VA, USA) and cultured in DMEM (Dulbecco’s Modified Eagle Medium) (Thermo Fisher Scientific, Waltham, MA, USA) (for MCF7, MDA-MB-231, and MDA-MB-468 cells) or Roswell RPMI (Park Memorial Institute)-1640 medium (Thermo Fisher Scientific) (for BT549 and T47D cells) supplemented with 10% FBS (fetal bovine serum) (Thermo Fisher Scientific) and 1% streptomycin/penicillin (Sigma, St Louis, MO, USA) in a humidified chamber at 37°C with 5% CO2.
Transient Transfection
Three small interference (si) RNA against circYY1 (si-circYY1#1, si-circYY1#2, and si-circYY1#3) and matched negative control (NC) (si-NC), miR-769-3p mimic (miR-769-3p), miR mimic control (miR-NC), miR-769-3p inhibitor (anti-miR-769-3p), and miR inhibitor control (anti-NC) were synthesized by Sangon Biotech (Shanghai, China). The pcDNA-YY1 (YY1) plasmids were established using the pcDNA vector (vector) (Addgene, Cambridge, MA, USA). Transient transfection was carried out using the Lipofectamine 3000 reagent (Thermo Fisher Scientific). The sequence of circYY1 was cloned into the pLCDH vector (Geenseed, Guangzhou, China) to establish the pLCDH-circYY1 plasmid.
Quantitative Real-Time Polymerase Chain Reaction (qRT-PCR)
TRIzol™ Reagent (Thermo Fisher Scientific) was employed to extract total RNA from tissue samples and cultured cells. The Nanodrop 1000 spectrophotometer (Thermo Fisher Scientific) (A260/A280 nm) was used to evaluate the concentration of extracted total RNA. Agarose gel (Biowest, Kansas, MO, USA) electrophoresis (1%) was carried out to analyze the integrity of extracted total RNA. The complementary DNA (cDNA) was produced using the SuperScript™ IV VILO™ Master Mix (Thermo Fisher Scientific) or Mir-X miRNA First-Strand Synthesis Kit (Takara, Dalian, China). The produced cDNA was used for qRT-PCR with the SYBR Premix Ex Taq II (Takara) on the Light Cycler 480 System (Roche, Basel, Switzerland). Relative expression was calculated by the 2−ΔΔCt method and normalized to β-actin or U6 small nuclear RNA (U6). The sequences of the primers in this study were displayed in Table 2.
 |
Table 2 Primer Sequences for qRT-PCR |
RNase R Treatment
The extracted total RNA (2 μg) was treated with RNase R (3U/ug, Epicentre Technologies, Madison, WI, USA) at 37°C for 20 min, and DEPC-treated water (Sigma) was utilized as a control. Thereafter, qRT-PCR was utilized for the assessment of the levels of circYY1 and YY1 mRNA.
Cell Viability Analysis
Cell Proliferation Kit I (Roche) was applied to perform the 3-(4,5-Dimethylthiazol-2-yl)-2,5-Diphenyltetrazolium Bromide (MTT) assay to determine the viability of BC cells. In short, the transfected BC cells (1 × 10⁵ cells) were incubated in 96-well plates for 48 h. Then, MTT reagent (5 mg/mL, 10 μL) was added to each well and incubated for 4 h. Subsequently, the solubilization solution (100 μL) was used to dissolve formazan. The absorbance at 570 nm was measured with a Microplate Reader (Bio-Rad, Hercules, CA, USA).
Colony Formation Assay
In brief, the transfected BC cells (1 × 10³ cells) were seeded into 12-well plates and incubated for 12 days. After washing with PBS (phosphate buffer saline) (Solarbio, Beijing, China), the cells were fixed with 4% paraformaldehyde (Sigma) and stained with 0.1% crystal violet (Sigma). The number of colonies (>50 cells) was counted using a Nikon Eclipse E600 microscope (Nikon Instruments, Melville, NY, USA).
Transwell Assay
The migration and invasion of BC cells were analyzed using a transwell chamber (8 μm, Costar, Cambridge, MA, USA). For migration assay, transfected BC cells (1×10⁵ cells/chamber) in 200 μL medium containing 1% bovine serum albumin (Sigma) were inoculated to the apical chamber. Also, the medium (600 μL) containing 10% FBS was added to the basolateral chamber. Unlike the migration experiment, the transwell chamber used in the invasion assay was pre-coated with matrigel (Costar). Twenty-four hour later, the migrating and invasive cells were fixed with 4% paraformaldehyde (Sigma). After staining with 0.1% crystal violet (Sigma), the cells were figured using a Nikon Eclipse E600 microscope (× 100, Nikon Instruments).
Measurement of Glucose Uptake, Lactate Production, and ATP (Adenosine Triphosphate) Content
The levels of glucose consumption and lactate production were evaluated with the Glucose Uptake Colorimetric Assay Kit (Sigma) and Lactate Assay Kit II (Sigma) in accordance with the manufacturer’s procedures. The content of ATP in intracellular was detected with ATP Detection Kit (Solarbio) based on the manufacturer’s instructions.
Western Blotting
After extraction with RIPA (Radio-Immunoprecipitation Assay) buffer (Sigma), the total protein was quantified with the QuantiPro™ BCA Assay Kit (Sigma). Subsequently, total protein was isolated by 12% sodium dodecyl sulfate-polyacrylamide gels and then transferred to polyvinylidene fluoride (PVDF) membranes (Millipore, Bedford, MA, USA). Thereafter, the membranes were sealed with 5% non-fat milk powder. After washing with TBST (Tris Buffered Saline Tween) (Thermo Fisher Scientific), the membranes were incubated with primary proteins, including anti-HK2 (hexokinase 2) (#22029-1-AP, 1:1000, Thermo Fisher Scientific), anti-LDHA (Lactate Dehydrogenase A) (#PA5-26531, 1:1000, Thermo Fisher Scientific), anti-YY1 (#PA5-29138, 1:1000, Thermo Fisher Scientific), anti-PCNA (Proliferating Cell Nuclear Antigen) (#24036-1-AP, 1:1000, Thermo Fisher Scientific), and anti-GAPDH (glyceraldehyde-3-phosphate dehydrogenase) (#PA1-988, 1:500, Thermo Fisher Scientific) antibodies. Then, the membranes were incubated with a goat anti-rabbit (#A27036, 1:4000, Thermo Fisher Scientific) IgG secondary antibody. The blots were detected by enhanced chemiluminescence (ECL) substrates (Thermo Fisher Scientific). GAPDH was deemed as a loading control.
Subcellular Fractionation Assay
Subcellular fractionation assay was carried out with a PARIS™ Kit (Ambion, Austin, TX, USA). BC cells (1 × 10⁴ cells) were suspended in fractionation buffer and incubated for 10 min. Then, the supernatant and the nuclear pellet were separated by centrifugation. After RNA extraction, the level of circYY1 in the cytoplasmic section and nuclear section was evaluated with qRT-PCR, and U6 and GAPDH were used as controls for nuclear RNA or cytoplasmic RNA.
RNA Immunoprecipitation (RIP) Assay
RIP assay was carried out with the Magna RIP kit (Millipore) in light of the manufacturer’s instructions. BC cells were lysed in lysis buffer and then incubated with immunoprecipitation buffer containing magnetic beads coated with AGO2 antibody (#10686-1-AP, Thermo Fisher Scientific) or IgG antibody (#PP64B, Millipore), and IgG was used as a control. After RNA extraction, the level of circYY1 was detected by qRT-PCR.
Dual-Luciferase Reporter Assay
Bioinformatics prediction (circbank and circinteractome) was performed to predict miRs that possessed complementary sequences to circYY1. The binding sites between miR-769-3p and YY1 were predicted by the TargetScan database. The luciferase reporter vector carrying wild type (WT) circYY1 (circYY1-WT), mutant (MUT) circYY1 (circYY1-MUT), YY1-3ʹUTR-WT, and YY1-3ʹUTR-MUT was established with the pMIR-REPORT vector (Applied Biosystems, Foster City, CA, USA), respectively. BC cells were co-transfected with a luciferase reporter vector and miR-NC or miR-769-3p mimic using Lipofectamine 3000 reagent (Thermo Fisher Scientific). The luciferase activities were determined using a luciferase reporter assay kit (Promega) in a TD20/20 Luminometer (Turner Biosystems, Sunnyvale, CA, USA).
RNA Pull-Down Assay
The miR-769-3p probe and Oligo probe were designed by BIOFAVOR Biotech (Wuhan, China). In brief, these probes were transfected into BC cells, respectively. Thereafter, these cell lysates were incubated with streptavidin magnetic beads at 4°C for 4 h. Subsequently, the RNA in the complexes was extracted with TRIzol™ Reagent (Thermo Fisher Scientific). QRT-PCR was conducted to evaluate the enrichment of circYY1 in extracted RNA.
Xenograft Assay
All experimental protocols had been ratified by the Animal Ethics Committee of the First Affiliated Hospital of Guangxi Medical University. The procedures of animal experiments were carried out in accordance with Laboratory animals-General requirements for animal experiment (GB/T 35823–2018) and Laboratory animal-Guideline for ethical review of animal welfare (GB/T 35892–2018). Ten female BALB/c nude mice (4–6 weeks) (Vital River Laboratory, Beijing, China) were randomly divided into two groups and then injected with BT549 cells (1×10⁷), which carried the lentivirus vector (pLKO.1) (Addgene) containing short hairpin (sh) RNA against circYY1 (sh-circYY1) or its negative control (sh-NC). Tumor volume was measured every 7 days and calculated in accordance with the following equation: Volume = (length ×width2)/2. Thirty-five days later, all mice were killed through cervical dislocation under Nembutal (50 mg/kg) treatment. The xenograft tumors in both groups were removed, weighed, and then stored at −80°C for subsequent analysis after the mice died (the heart stopped beating).
Statistical Analysis
All experiments (in vitro) were repeated 3 times, and the data were displayed as mean ± standard deviation. All statistical analyses were executed using the GraphPad Prism 8 (GraphPad, San Diego, CA, USA). Differences between or above 2 groups were determined with the independent Student’s t test or one-way analysis of variance (ANOVA) with Turkey’s post hoc test. The differences between BC tissues and matched normal tissues were determined with a paired Student’s t test. The survival curves were plotted by Kaplan–Meier curves and the Log rank test. Pearson’s correlation analysis was conducted for analysis of the correlation among circYY1, miR-769-3p, and YY1. There was a statistically significant difference when P < 0.05.
Results
BC Patients with High circYY1 Expression Had a Poor Prognosis
YY1 has been reported to play an important role in BC.15,16 In order to investigate the role of circRNA from the YY1 gene in BC, we first analyzed circbase and circbank databases and found that there were five circRNAs (hsa_circ_0033169, hsa_circ_0101187, hsa_circ_0033170, hsa_circ_0033171, and hsa_circ_0033172) from the YY1 gene. To screen for differentially expressed circRNAs, we employed qRT-PCR to detect the expression patterns of 5 circRNAs in 12 random BC tissues and matched normal tissues. The results presented that the expression of hsa_circ_0101187 and hsa_circ_0033171 was apparently higher in BC tissues compared with matched normal tissues, especially hsa_circ_0101187 (Figure 1A and B). CircYY1 (hsa_circ_0101187), located on chr14:100728640–100728803, is a 163 nt circRNA generated from the YY1 gene (exon2), as displayed in Figure 1C. To verify the differential expression of circYY1 in BC, we detected circYY1 expression in 70 paired BC tissues and neighboring normal tissues. As exhibited in Figure 1D, circYY1 was highly expressed in BC tissues than that in the corresponding normal tissues. BC patients with high circYY1 expression were associated with TNM stage and lymph node metastasis (Table 1). Moreover, the prognosis of BC patients with high circYY1 expression was worse than that of BC patients with low circYY1 expression (Figure 1E). We also observed that circYY1 had a higher expression in BC cells (MCF7, BT549, MDA-MB-231, MDA-MB-468, and T47D) than that in MCF10A cells, particularly BT549 and MDA-MB-231 cells (Figure 1F). Furthermore, RNase R treatment was performed to validate the circular structure of circYY1 in BC cells. QRT-PCR showed that RNase R treatment overtly reduced the expression of YY1 mRNA in total RNA of BT549 and MDA-MB-231 cells, but the expression of circYY1 was not affected (Figure 1G). These findings indicated that circYY1 was upregulated in BC and was associated with a poor prognosis.
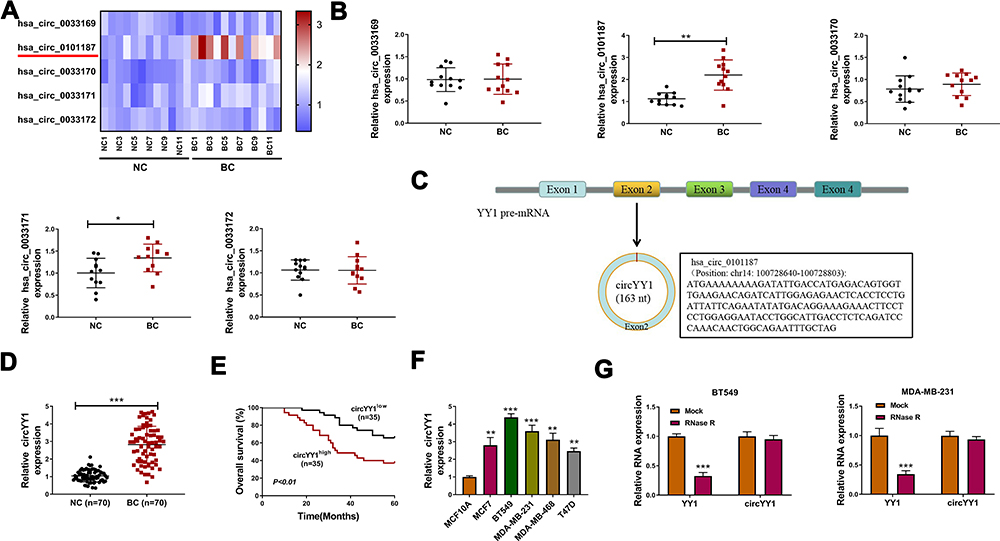 |
Figure 1 The prognosis of BC patients with high circYY1 expression was poor. (A) A heat map showed the expression of 5 circRNAs (hsa_circ_0033169, hsa_circ_0101187, hsa_circ_0033170, hsa_circ_0033171, hsa_circ_0033172) in 12 randomly BC tissues and corresponding NC tissues. (B) QRT-PCR revealed the expression of these 5 circRNAs in 12 randomly BC tissues and corresponding neighboring NC tissues. (C) Schematic illustration showed that circYY1 (hsa_circ_0101187) was produced from the YY1 gene (exon 2). (D) QRT-PCR presented the expression of circYY1 in 70 paired BC tissues and neighboring normal tissues. (E) Kaplan-Meier curves and Log rank test revealed the survival time of BC patients with high circYY1 expression and low circYY1 expression. (F) Analysis of the expression of circYY1 in BC cells (MCF7, BT549, MDA-MB-231, MDA-MB-468, and T47D) and MCF10A cells by qRT-PCR. (G) After RNase R treatment, the expression of circYY1 and YY1 mRNA in total RNA of BT549 and MDA-MB-231 cells was detected with qRT-PCR. *P < 0.05, **P < 0.01, and ***P < 0.001. |
CircYY1 Facilitated BC Cell Malignancy and Glycolysis in vitro
To verify whether circYY1 affects the biological processes of BC cells, we designed three siRNAs against the back-spliced sequence of circYY1, as exhibited in Figure 2A. The results showed that circYY1 was observably downregulated in BT549 and MDA-MB-231 cells after transfection with si-circYY1#1, si-circYY1#2, or si-circYY1#3, and si-circYY1#1 was utilized for functional analysis (Figure 2B). MTT assay revealed that circYY1 downregulation remarkably reduced cell viability in BT549 and MDA-MB-231 cells (Figure 2C). Colony formation assay indicated that the inhibition of circYY1 decreased the number of colonies in BT549 and MDA-MB-231 cells (Figure 2D). Transwell assay presented that the knockdown of circYY1 impaired the migration and invasion abilities of BT549 and MDA-MB-231 cells (Figure 2E and F). Furthermore, circYY1 silencing resulted in the decrease of glucose uptake, lactate production, and ATP release in BT549 and MDA-MB-231 cells, manifesting that circYY1 inhibition reduced the glycolysis of BT549 and MDA-MB-231 cells (Figure 2G–2I). Also, the protein levels of HK2 and LDHA in circYY1-silenced BT549 and MDA-MB-231 cells were downregulated (Figure 2J). We also explored the influence of circYY1 overexpression on malignant behaviors and glycolysis of BC cells. The overexpression efficiency of pLCDH-circYY1 in BT549 and MDA-MB-231 cells was exhibited in Supplementary Figure 1A. The results exhibited that circYY1 overexpression elevated cell viability, colony formation, migration, and invasion in BT549 and MDA-MB-231 cells (Supplementary Figure 1B-1E). As expected, circYY1 upregulation increased the levels of glucose uptake, lactate production, and ATP release in BT549 and MDA-MB-231 cells (Supplementary Figure 1F-1H). In addition, there was an apparent upregulation in HK2 and LDHA protein levels in circYY1-elevated BT549 and MDA-MB-231 cells (Supplementary Figure 1I). Collectively, these results indicated that circYY1 contributed to malignant behaviors and glycolysis of BC cells.
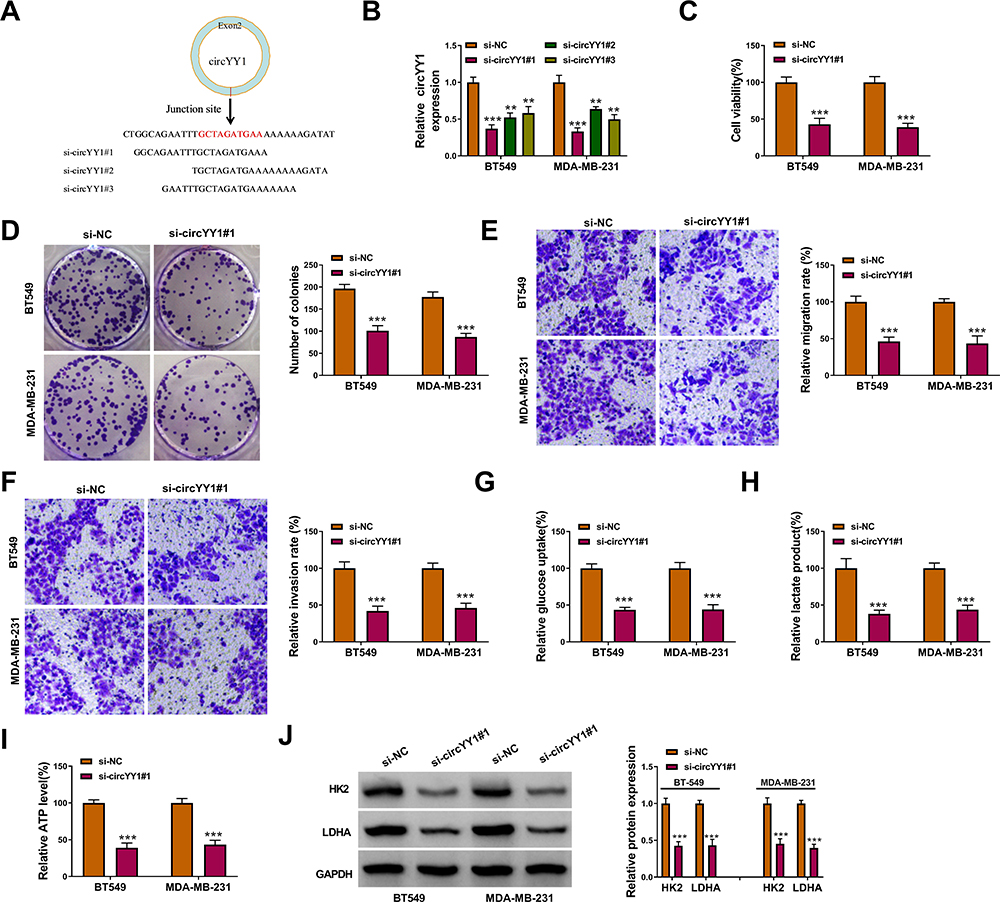 |
Figure 2 Influence of circYY1 inhibition on the malignancy and glycolysis of BC cells. (A) Schematic diagram showed 3 siRNAs targeting the back-spliced sequence of circYY1. (B) QRT-PCR verified the knockdown efficiency of circYY1 in BT549 and MDA-MB-231 cells. (C–F) Influence of circYY1 inhibition on viability, colony formation, migration, and invasion of BT549 and MDA-MB-231 cells was assessed by MTT assay (C), colony formation assay (D), or transwell assay (E and F). (G–I) Impacts of circYY1 knockdown on glucose uptake, lactate production, and ATP release in BT549 and MDA-MB-231 cells were determined with corresponding kits. (J) Effects of circYY1 silencing on the protein levels of HK2 and LDHA in BT549 and MDA-MB-231 cells were analyzed using Western blotting. **P < 0.01 and ***P < 0.001. |
CircYY1 Served as a Sponge of miR-769-3p in BC Cells
To investigate the regulatory mechanism of circYY1 in BC, we first analyzed the subcellular location of circYY1 in BT549 and MDA-MB-231 cells. The results showed that circYY1 was preferentially distributed in the cytoplasm of BT549 and MDA-MB-231 cells, illustrating that circYY1 might act as a sponge for miRs (Figure 3A). RIP assay presented that circYY1 could be enriched in the anti-AGO2 complex compared with the anti-IgG complex (Figure 3B). Moreover, we discovered that miR-769-3p possessed complementary sequence to circYY1 using circbank and circinteractome databases (Figure 3C and D). Furthermore, miR-769-3p expression was elevated in BT549 and MDA-MB-231 cells transfected with miR-769-3p mimic compared to the control group (Figure 3E). Dual-luciferase reporter assay suggested that the forcing expression of miR-769-3p overtly repressed circYY1-WT luciferase reporter activity but not circYY1-MUT luciferase reporter activity (Figure 3F). RNA pull-down assay exhibited that circYY1 was abundantly pulled down by the miR-769-3p probe in BT549 and MDA-MB-231 cells (Figure 3G). Also, miR-769-3p was prominently upregulated in BT549 and MDA-MB-231 cells after transfection with si-circYY1#1 (Figure 3H). Together, these results indicated that circYY1 acted as a sponge for miR-769-3p in BC cells.
 |
Figure 3 CircYY1 was verified as a sponge for miR-769-3p in BC cells. (A) Subcellular location assay revealed the distribution of circYY1 in BT549 and MDA-MB-231 cells. (B) QRT-PCR revealed the level of circYY1 in the anti-AGO2 and anti-IgG complexes. (C and D) The complementary sequence of miR-769-3p and circYY1 was predicted by the circbank and circinteractome databases. (E) After transfection with miR-NC or miR-769-3p mimic, the expression of miR-769-3p was measured by qRT-PCR. (F) The luciferase activities of the circYY1-WT and circYY1-MUT luciferase reporters in BT549 and MDA-MB-231 cells transfected with miR-NC or miR-769-3p mimic were determined by dual-luciferase reporter assay. (G) Whether circYY1 could be pulled down by the miR-769-3p or Oligo probe in BT549 and MDA-MB-231 cells was confirmed by qRT-PCR. (H) Expression of miR-769-3p in BT549 and MDA-MB-231 cells transfected with si-NC or si-circYY1 was evaluated by qRT-PCR. ***P < 0.001. |
miR-769-3p Overexpression Curbed the Malignancy and Glycolysis of BC Cells
To verify the function of miR-769-3p in BC, we tested the expression of miR-769-3p in BC tissues. As displayed in Figure 4A, miR-769-3p was conspicuously downregulated in BC cells relative to neighboring normal tissues. Pearson’s correlation analysis indicated that the expression of miR-769-3p and circYY1 had a negative correlation in BC tissues (Figure 4B). Consistently, miR-769-3p had a lower level in BC cells in contrast to MCF10A cells (Figure 4C). We also observed that miR-769-3p overexpression played an inhibitory impact on viability, colony formation, migration, and invasion of BT549 and MDA-MB-231 cells (Figure 4D–G). In addition, miR-769-3p elevation reduced glucose uptake, lactate production, and ATP release in BT549 and MDA-MB-231 cells (Figure 4I–J). Moreover, elevated miR-769-3p expression shortened the protein levels of HK2 and LDHA in BT549 and MDA-MB-231 cells (Figure 4K). Together, these findings indicated that miR-769-3p played a suppressive influence on the malignancy and glycolysis of BC cells.
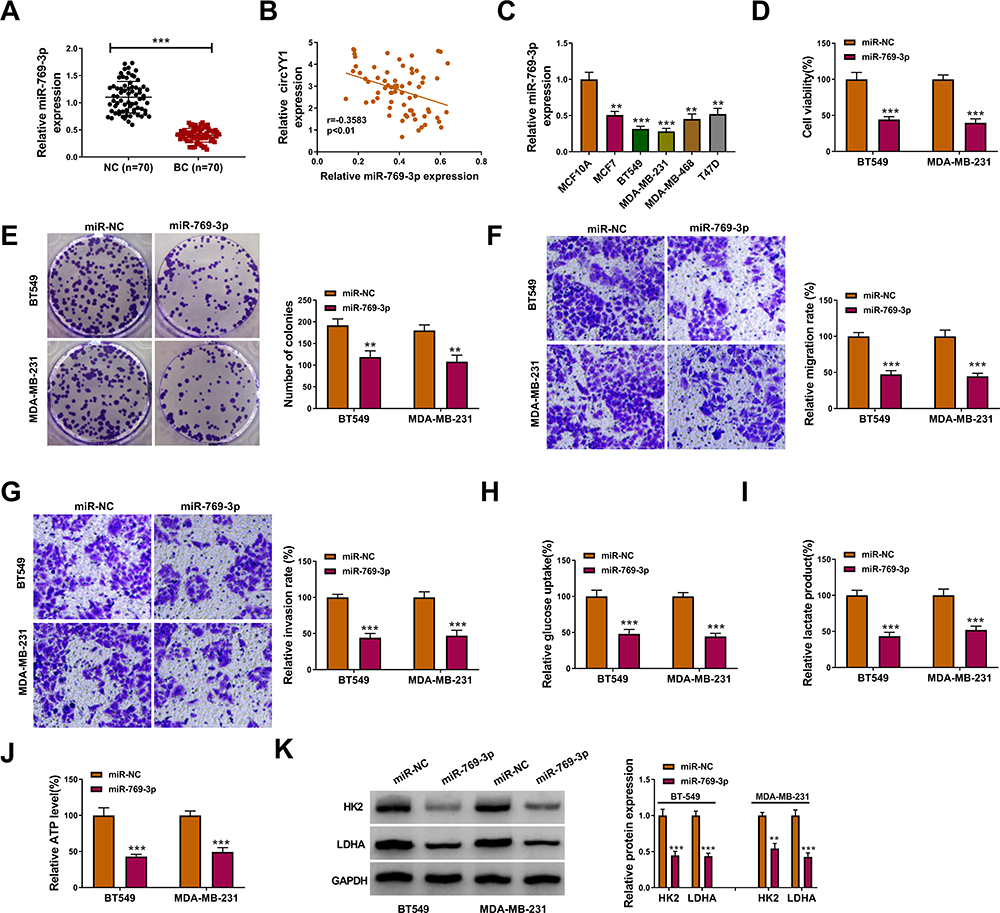 |
Figure 4 Effects of miR-769-3p overexpression on the malignancy and glycolysis of BC cells. (A) Expression pattern of miR-769-3p in BC tissues and neighboring normal tissues was validated by qRT-PCR. (B) Analysis of the correlation between miR-769-3p and circYY1 in BC tissues by Pearson’s correlation analysis. (C) Analysis of the expression of miR-769-3p in BC cells and MCF10A cells by qRT-PCR. (D–K) BT549 and MDA-MB-231 cells were transfected with miR-769-3p mimic and miR-NC. (D–G) The viability, colony formation, migration, and invasion of BT549 and MDA-MB-231 cells were analyzed by MTT assay (D), colony formation assay (E), or transwell assay (F and G). (H–J) Corresponding kits were used to analyze the levels of glucose uptake, lactate production, and ATP release in BT549 and MDA-MB-231 cells. (K) Western blotting presented the protein levels of HK2 and LDHA in BT549 and MDA-MB-231 cells. **P < 0.01 and ***P < 0.001. |
miR-769-3p Directly Targeted YY1 in BC Cells
To analyze the involvement among circYY1, miR-769-3p, and YY1 in BC, we evaluated the level of YY1 mRNA in BC tissues. The results manifested that the levels of YY1 mRNA and protein were elevated in BC tissues (Figure 5A and B). Moreover, the expression of YY1 mRNA was positively correlated with circYY1 and negatively correlated with miR-769-3p in BC tissues (Figure 5C and D). Bioinformatics prediction (TargetScan) presented that YY1 might be a downstream target of miR-769-3p (Figure 5E). The elevation of miR-769-3p suppressed the luciferase activity of the YY1-3ʹUTR-WT luciferase reporter rather than the YY1-3ʹUTR-MUT luciferase reporter (Figure 5F). Also, YY1 could be pulled down by the miR-769-3p probe but not the Oligo probe (Figure 5G). Additionally, the protein level of YY1 in BT549 and MDA-MB-231 cells with increased miR-769-3p expression was conspicuously decreased (Figure 5H). Furthermore, there was an overt upregulation of YY1 protein in BC cells (Figure 5I). Taken together, our findings suggested that YY1 was a target of miR-769-3p in BC cells.
 |
Figure 5 YY1 served as a target for miR-769-3p in BC cells. (A and B) QRT-PCR and Western blotting were carried out to analyze the expression of YY1 mRNA and protein in BC tissues and neighboring normal tissues. (C and D) Correlation of YY1 mRNA and circYY1 or miR-769-3p expression in BC tissues was assessed by Pearson’s correlation analysis. (E) Prediction of the binding sites between miR-769-3p and YY1 by the TargetScan database. (F) Relative luciferase activities were investigated in BT549 and MDA-MB-231 cells co-transfected with miR-769-3p mimic or miR-NC and YY1-3ʹUTR-WT luciferase reporter or YY1-3ʹUTR-MUT luciferase reporter. (G) RNA pull-down assay revealed the enrichment of YY1 mRNA in the miR-769-3p probe group and Oligo probe group. (H) Western blotting showed the protein level of YY1 in BT549 and MDA-MB-231 cells transfected with miR-769-3p mimic or miR-NC. (I) Western blotting revealed the level of YY1 protein in BC cells. **P < 0.01 and ***P < 0.001. |
CircYY1 Accelerated Cell Malignancy and Glycolysis in BC Cells by Upregulating YY1 via Sponging miR-769-3p
Considering that miR-769-3p targeted YY1 in BC cells, we further explored whether circYY1 regulated the biological processes of BC cells through the miR-769-3p/YY1 axis. The transfection of anti-miR-769-3p reduced the expression of miR-769-3p in BT549 and MDA-MB-231 cells (Figure 6A). Moreover, miR-769-3p inhibitor partly reversed the downregulation of YY1 protein in si-circYY1#1-transfected BT549 and MDA-MB-231 cells (Figure 6B). The overexpression efficiency of YY1 in BT549 and MDA-MB-231 cells was confirmed by Western blotting (Figure 6C). Furthermore, the prohibitive impact of circYY1 silencing on cell viability, colony formation, migration, and invasion was partly countervailed by miR-769-3p inhibition or YY1 elevation (Figure 6D–G). Moreover, both miR-769-3p silencing and YY1 overexpression overturned the decrease of glucose uptake, lactate production, and ATP release in circYY1-repressed BT549 and MDA-MB-231 cells (Figure 6H–J). In addition, the downregulation of HK2 and LDHA proteins in si-circYY1#1-transfected BT549 and MDA-MB-231 cells were partially neutralized by miR-769-3p knockdown or YY1 upregulation (Figure 6K). The above results indicated that circYY1 regulated malignancy and glycolysis of BC cells by the miR-769-3p/YY1 axis.
 |
Figure 6 The circYY1/miR-769-3p/YY1 axis regulated the malignancy and glycolysis of BC cells. (A) QRT-PCR analysis of miR-769-3p expression in BT549 and MDA-MB-231 cells transfected with anti-miR-769-3p or anti-NC. (B) Western blotting analysis of YY1 protein level in BT549 and MDA-MB-231 cells transfected with si-NC, si-circYY1#1, or si-circYY1#1+anti-miR-769-3p. (C) The protein level of YY1 in BT549 and MDA-MB-231 cells transfected with vector or YY1 was analyzed with Western blotting. (D–K) BT549 and MDA-MB-231 cells were transfected with si-NC, si-circYY1#1, si-circYY1#1+anti-miR-769-3p, or si-circYY1#1+YY1. (D–G) The viability, colony formation, migration, and invasion of BT549 and MDA-MB-231 cells were determined by MTT assay (D), colony formation assay (E), or transwell assay (F and G). (H–J) The levels of glucose uptake, lactate production, and ATP release in BT549 and MDA-MB-231 cells were analyzed with a matching kit. (K) Assessment of HK2 and LDHA protein levels in BT549 and MDA-MB-231 cells by Western blotting. **P < 0.01 and ***P < 0.001. |
Knockdown of circYY1 Reduced Xenograft Tumor Growth in vivo
To confirm the biological function of circYY1 in BC, we performed xenograft experiments. The results exhibited that tumor volume and weight were smaller and lower in the sh-circYY1 group in comparison with the sh-NC group (Figure 7A and B). Moreover, circYY1 expression was reduced while miR-769-3p expression was elevated in mice tumor tissues in the sh-circYY1 group (Figure 7C). The protein levels of YY1, PCNA, HK2, and LDHA also were decreased in mice tumor tissues in the sh-circYY1 group than that in the sh-NC group (Figure 7D). Together, these data indicated that circYY1 accelerated BC growth in vivo.
 |
Figure 7 CircYY1 contributed to BC growth in vivo. (A) Tumor volumes in mice were measured every 7 days. (B) Tumor weight was measured 35 days after injection with BT549 cells carrying sh-circYY1 or sh-NC. (C) QRT-PCR analysis of circYY1 and miR-769-3p expression in mice tumor tissues in the sh-circYY1 group and sh-NC group. (D) Western blotting analysis of YY1, PCNA, HK2, and LDHA protein levels in mice tumor tissues in the sh-circYY1 group and sh-NC group. **P < 0.01 and ***P < 0.001. |
Discussion
CircRNAs have extremely high stability due to their unique structure. Studies had manifested that circRNAs exerted vital roles in human diseases and might serve as molecular biomarkers and targets for disease prognosis analysis and treatment.17,18 Here, we discovered that circYY1 had a higher expression in BC tissues and cells. Moreover, BC patients with high circYY1 expression had a poor prognosis, indicating that circYY1 might serve as a prognostic biomarker for BC patients. In addition, we discovered that circYY1 suppression reduced xenograft tumor growth in vivo and decreased BC cell proliferation, migration, and invasion in vitro. These findings indicated that circYY1 exerted a carcinogenic role in BC.
Glycolysis has been revealed as a hallmark of tumor progression in many cancers.19 The increase in glycolysis and glucose uptake can lead to the production of nucleotides, proteins, and lipids, thereby promoting the division and proliferation of tumor cells.20,21 Herein, we discovered that circYY1 knockdown could decrease glucose uptake, lactate production, and ATP release in BC cells. Moreover, circYY1 inhibition reduced the protein levels of HK2 and LDHA in BC cells. HK2, a key mediator of aerobic glycolysis, can accelerate cancer cell survival and proliferation.22 LDHA is abnormally highly expressed in many cancers and promotes the glycolysis process by converting pyruvate to lactate.23 Accordingly, these results suggested that circYY1 inhibition could reduce the glycolysis of BC cells.
Many studies have manifested that circRNAs can bind to miRs to modulate mRNAs expression, establishing a complex posttranscriptional regulatory network.24 For instance, Xie et al indicated that circRNA circBCRC-3 played an inhibitory influence on BC progression by downregulating p27 via absorbing miR-182-5p.25 Herein, we observed that circYY1 was preferentially distributed in the cytoplasm of BC cells, suggesting that circYY1 might function as a sponge for miRs in BC cells. Moreover, we verified that circYY1 was a sponge of miR-769-3p in BC cells and miR-769-3p was lowly expressed in BC tissues and cells. The upregulation of miR-769-3p curbed the malignancy and glycolysis of BC cells. A previous study unmasked that miR-769-3p elevation could induce cell apoptosis and curbed cell proliferation in BC cells during re-oxygenation through downregulating NDRG1.26 These indicated that miR-769-3p exerted a repressive effect on BC progression. Moreover, Wang et al discovered that miR-769-3p blocked the Wnt/β-catenin pathway via targeting ZEB2 in glioma cells, thereby repressing tumor growth.27 However, Ju et al revealed that miR-769-3p was a potential predictor of lung metastasis, which might be related to the specificity of cells and tissues.28
Subsequently, YY1 was validated as a target of miR-769-3p. Currently, the function of YY1 in BC is controversial. It was reported that YY1-activated LINC00673 accelerated cell growth through the MARK4/Hippo pathway via absorbing miR-515-5p in BC.16 Also, the miR-5590-3p-YY1 feedback loop contributed to cell migration and proliferation in triple-negative BC cells.14 In addition, Lee et al unmasked that YY1 could elevate BRCA1 expression and impeded the formation of BC.29 Furthermore, YY1 overexpression resulted in a decrease of FEN1 expression in BC cells, thereby elevating the sensitization of BC cells to taxol or mitomycin C.30 Herein, YY1 mRNA had a higher expression in BC tissues. YY1 overexpression antagonized circYY1 silencing-mediated influence on the glycolysis and malignancy of BC cells. These results supported that YY1 acted as an oncogene in BC. Furthermore, we also found that circYY1 sponged miR-769-3p to regulate YY1 expression and miR-769-3p inhibitor reversed circYY1 downregulation-mediated effect on the malignancy and glycolysis of BC cells. These results indicated that circYY1 regulated the malignancy and glycolysis of BC cells by absorbing miR-769-3p and modulating YY1 expression.
In sum, circYY1 exerted an oncogenic role in BC. Furthermore, the knockdown of circYY1 constrained glycolysis and tumor growth in BC through downregulating YY1 via sponging miR-769-3p. The study manifested that circYY1 was a potential prognostic biomarker and therapeutic target for BC.
Ethics Approval and Consent Participate
Written informed consent was obtained from patients with approval by the Institutional Review Board in the First Affiliated Hospital of Guangxi Medical University.
Funding
This work was supported by the Health Department of Guangxi Self-financing project (NO.Z2014050).
Disclosure
The authors declare that they have no financial or non-financial conflicts of interest for this work.
References
1. Zhang M, Rosen JM. Developmental Insights into Breast Cancer Intratumoral Heterogeneity. Trends in Cancer. 2015;1(4):242–251. doi:10.1016/j.trecan.2015.10.005
2. Januškevičienė I, Petrikaitė V. Heterogeneity of breast cancer: the importance of interaction between different tumor cell populations. Life Sci. 2019;239:117009. doi:10.1016/j.lfs.2019.117009
3. Peng L, Jiang J, Tang B, Nice EC, Zhang Y-Y XN. Managing therapeutic resistance in breast cancer: from the lncRNAs perspective. Theranostics. 2020;10(23):10360–10377.
4. Palomeras S, Ruiz-Martínez S, Puig T. Targeting Breast Cancer Stem Cells to Overcome Treatment Resistance. Molecules. 2018;23:9.
5. DeSantis CE, Ma J, Goding Sauer A, Newman LA, Jemal A. Breast cancer statistics, 2017, racial disparity in mortality by state. CA Cancer J Clin. 2017;67(6):439–448.
6. Kristensen LS, Andersen MS, Stagsted LVW, Ebbesen KK, Hansen TB, Kjems J. The biogenesis, biology and characterization of circular RNAs. Nat Rev Genet. 2019;20(11):675–691.
7. Han B, Chao J, Circular YH. RNA and its mechanisms in disease: from the bench to the clinic. Pharmacol Ther. 2018;187:31–44.
8. Li W, Yang F-Q, Sun C-M, et al. T et al. circPRRC2A promotes angiogenesis and metastasis through epithelial-mesenchymal transition and upregulates TRPM3 in renal cell carcinoma. Theranostics. 2020;10(10):4395–4409.
9. Liang H-F, Zhang X-Z, Liu B-G, Jia G-T, Li W-L. Circular RNA circ-ABCB10 promotes breast cancer proliferation and progression through sponging miR-1271. Am J Cancer Res. 2017;7(7):1566–1576.
10. Zhao C, Li L, Li Z, et al. A Novel Circular RNA hsa_circRPPH1_015 Exerts an Oncogenic Role in Breast Cancer by Impairing miRNA-326-Mediated ELK1 Inhibition. Front Oncol. 2020;10:906. doi:10.3389/fonc.2020.00906
11. Xu J-Z, Shao -C-C, Wang X-J, et al. circTADA2As suppress breast cancer progression and metastasis via targeting miR-203a-3p/SOCS3 axis. Cell Death Dis. 2019;10(3):175. doi:10.1038/s41419-019-1382-y
12. Khachigian LM. The Yin and Yang of YY1 in tumor growth and suppression. Int J Cancer. 2018;143(3):460–465. doi:10.1002/ijc.31255
13. Sarvagalla S, Kolapalli SP, Vallabhapurapu S. The Two Sides of YY1 in Cancer: a Friend and a Foe. Front Oncol. 2019;9:1230. doi:10.3389/fonc.2019.01230
14. Liang F, Fu X, Wang L. miR-5590-3p-YY1 feedback loop promotes the proliferation and migration of triple-negative breast cancer cells. J Cell Biochem. 2019;120(10):18415–18424. doi:10.1002/jcb.29158
15. Hays E, Bonavida B. YY1 regulates cancer cell immune resistance by modulating PD-L1 expression. Drug Resist Updat. 2019;43:10–28. doi:10.1016/j.drup.2019.04.001
16. Qiao K, Ning S, Wan L, et al. LINC00673 is activated by YY1 and promotes the proliferation of breast cancer cells via the miR-515-5p/MARK4/Hippo signaling pathway. J Exp Clin Cancer Res. 2019;38(1):418. doi:10.1186/s13046-019-1421-7
17. Meng S, Zhou H, Feng Z, et al. CircRNA: functions and properties of a novel potential biomarker for cancer. Mol Cancer. 2017;16(1):94. doi:10.1186/s12943-017-0663-2
18. Kristensen LS, Hansen TB, Venø MT, Kjems KJ. Circular RNAs in cancer: opportunities and challenges in the field. Oncogene. 2018;37(5):555–565. doi:10.1038/onc.2017.361
19. Ganapathy-Kanniappan S, Geschwind J-FH. Tumor glycolysis as a target for cancer therapy: progress and prospects. Mol Cancer. 2013;12(1):152. doi:10.1186/1476-4598-12-152
20. Vaupel P, Schmidberger H, Mayer A. The Warburg effect: essential part of metabolic reprogramming and central contributor to cancer progression. Int J Radiat Biol. 2019;95(7):912–919. doi:10.1080/09553002.2019.1589653
21. Lunt SY, Vander Heiden MG. Aerobic glycolysis: meeting the metabolic requirements of cell proliferation. Annu Rev Cell Dev Biol. 2011;27(1):441–464. doi:10.1146/annurev-cellbio-092910-154237
22. Garcia SN, Guedes RC, Marques MM. Unlocking the Potential of HK2 in Cancer Metabolism and Therapeutics. Curr Med Chem. 2019;26(41):7285–7322.
23. Feng Y, Xiong Y, Qiao T, Li X, Jia L, Han Y. Lactate dehydrogenase A: a key player in carcinogenesis and potential target in cancer therapy. Cancer Med. 2018;7(12):6124–6136.
24. Zhong Y, Du Y, Yang X, et al. Circular RNAs function as ceRNAs to regulate and control human cancer progression. Mol Cancer. 2018;17(1):79.
25. Xie F, Li Y, Wang M, et al. RNA BCRC-3 suppresses bladder cancer proliferation through miR-182-5p/p27 axis. Mol Cancer. 2018;17(1):144.
26. Luo E-C, Chang Y-C, Sher Y-P, et al. MicroRNA-769-3p down-regulates NDRG1 and enhances apoptosis in MCF-7 cells during reoxygenation. Sci Rep. 2014;4:5908.
27. Wang K, Yang S, Gao Y, Zhang C, Sui Q. MicroRNA-769-3p inhibits tumor progression in glioma by suppressing ZEB2 and inhibiting the Wnt/β-catenin signaling pathway. Oncol Lett. 2020;19:1.
28. Ju Q, Zhao L, Gao J, et al. Mutant p53 increases exosome-mediated transfer of miR-21-3p and miR-769-3p to promote pulmonary metastasis. Chin J Cancer Res. 2019;31(3):533–546.
29. Lee MH, Lahusen T, Wang RH, et al. 1 positively regulates BRCA1 and inhibits mammary cancer formation. Oncogene. 2012;31(1):116–127.
30. Wang J, Zhou L, Li Z, et al. YY1 suppresses FEN1 over-expression and drug resistance in breast cancer. BMC Cancer. 2015;15:50.
 © 2021 The Author(s). This work is published and licensed by Dove Medical Press Limited. The
full terms of this license are available at https://www.dovepress.com/terms
and incorporate the Creative Commons Attribution
- Non Commercial (unported, 3.0) License.
By accessing the work you hereby accept the Terms. Non-commercial uses of the work are permitted
without any further permission from Dove Medical Press Limited, provided the work is properly
attributed. For permission for commercial use of this work, please see paragraphs 4.2 and 5 of our Terms.
© 2021 The Author(s). This work is published and licensed by Dove Medical Press Limited. The
full terms of this license are available at https://www.dovepress.com/terms
and incorporate the Creative Commons Attribution
- Non Commercial (unported, 3.0) License.
By accessing the work you hereby accept the Terms. Non-commercial uses of the work are permitted
without any further permission from Dove Medical Press Limited, provided the work is properly
attributed. For permission for commercial use of this work, please see paragraphs 4.2 and 5 of our Terms.