Back to Journals » Journal of Pain Research » Volume 12
Chronic pain clinic efficiency analysis: optimization through use of the Gantt diagram and visit diagnoses
Authors Hundley HE, Hudson ME, Wasan AD ![]() , Emerick TD
, Emerick TD ![]()
Received 3 July 2018
Accepted for publication 16 October 2018
Published 17 December 2018 Volume 2019:12 Pages 1—8
DOI https://doi.org/10.2147/JPR.S173345
Checked for plagiarism Yes
Review by Single anonymous peer review
Peer reviewer comments 4
Editor who approved publication: Professor E Alfonso Romero-Sandoval
Hayden E Hundley,1 Mark E Hudson,2,3 Ajay D Wasan,3,4 Trent D Emerick3,4
1Department of Anesthesiology, University of Pittsburgh Medical Center, Pittsburgh, PA, USA; 2Department of Anesthesiology, University of Pittsburgh School of Medicine, Pittsburgh, PA, USA; 3University of Pittsburgh Physicians, Pittsburgh, PA, USA; 4Division of Chronic Pain, Department of Anesthesiology, University of Pittsburgh School of Medicine, Pittsburgh, PA, USA
Objective: The aim of this study is to identify scheduling inefficiencies and to develop a personalized schedule based on diagnosis, service time (face-to-face time between the patient and the provider), and patient wait time using a Gantt diagram in a chronic pain clinic.
Design: This is an observational prospective cohort quality improvement (QI) study.
Setting: This study was carried out at a single outpatient multidisciplinary pain management clinic in a university teaching hospital.
Subjects: New and established chronic pain patients at the University of Pittsburgh Medical Center (UPMC) Montefiore Chronic Pain Clinic were recruited for this study.
Methods: Time tracking data for each phase of clinic visit and pain-related diagnoses were collected from 81 patients on 5 clinic days in March 2016 for patient flow analysis.
Results: A Gantt diagram was created using Microsoft Excel® software. Areas of overbooking and underbooking were identified. Median service times (minutes) differed dramatically based on the diagnosis and were highest for facial pain (23 [IQR, 15–31]) and chronic abdominal and/or pelvic pain (21.5 [IQR, 16–27]) and lowest for myalgia. Abdominal and/or pelvic pain and facial pain median service times consistently exceeded the 15-minute allocation for return visits.
Conclusion: Schedule efficiency analysis using the Gantt diagram identified trends of overbooking and underbooking and inefficiencies in examination room utilization. A 15-minute appointment for all return patients is unrealistic due to variation of service times for some diagnoses. Scheduling appointments based on the diagnosis is an innovative approach that may reduce scheduling inefficiencies and improve patient satisfaction and the overall quality of care. To the best of our knowledge, this type of scheduling diagram has not been used in a chronic pain clinic.
Keywords: quality of health care, chronic pain, outcome assessment, pain management, physician performance, referral and consultation, satisfaction, strategic planning
Introduction
Comprehensive assessment and multimodal treatment is a cornerstone of high-quality pain specialty practice.1 Naturally, additional face-to-face time between the patient and the provider may be needed for the more complicated cases of treatment refractory pain, such as chronic pelvic pain. However, in clinical practice, it can be quite difficult to operationalize this principle and proactively manage the scheduling of patients to foster a higher quality of service delivery and improve patient satisfaction. For instance, follow-up visits might only be scheduled for 15 or 20 minute (min) appointments, regardless of the diagnosis and whether the visit is likely to take a shorter time or longer than this time. In this study, we applied an analysis technique used in the manufacturing sector to a pain clinic in an effort to improve the quality of care.
A Gantt diagram is a horizontal bar chart used to analyze process efficiencies and used historically in manufacturing sectors to track specific tasks within a project schedule and to achieve better visibility of work flow constraints for process improvement analysis, eg, bottlenecks in processing rate or wait time.2,3 Additional advantages of the Gantt chart include its simplicity and ease of understanding while conveying complex dynamics within a schedule.4
Outside the field of chronic pain, one published study used Gantt diagrams to prospectively simulate scheduling in a primary care setting.5 Another study at an academic residency program’s internal medicine clinic used business-proven six sigma methodologies to improve clinic efficiency.6 Other outpatient medical clinics have also used another business and engineering practice – the application of lean methodologies – to eliminate waste and identify value in an effort to improve clinic efficiency.7,8 Queue line theory is often used in construction and manufacturing sectors to describe waiting time, idle time, system capacity, and service stations.9 In that sense, queue line theory could also be used to describe a chronic pain clinic whereby the attending chronic pain physician would serve as a single service station. This study analyzed a sample of median service times and their variability and also analyzed median time spent in the queue (wait times). These are important factors when determining arrival and service patterns in a single-server queuing system.
A personalized schedule based on diagnosis, service time, and wait time using a Gantt diagram has not been applied to a chronic pain clinic in an effort to analyze a schedule and improve its efficiency. A five-day sample of patient wait and service times in a single provider chronic pain clinic schedule was analyzed using this method with the aim of identifying scheduling inefficiencies and reducing wait times.
Methods
Overview
With institutional University of Pittsburgh Medical Center Quality Improvement (QI) Committee approval (#427), an observational prospective cohort study of outpatient clinic scheduling efficiency was conducted using Gantt diagrams. Data for the development of these diagrams were collected from 81 adult patients during five separate clinic days at a single chronic pain clinic within a large multi-clinic chronic pain program. All patients were under the medical care of one board-certified pain management physician. Time points collected included the time of the patient appointment, patient arrival, patient entering examination room, provider(s) entering examination room, and provider and patient leaving the examination room. Providers included advanced practice providers, residents, fellows, and/or the attending physician. Pain-related diagnosis, visit type (new versus return visit), and no-shows were recorded.
Total service time was defined as total time an advanced practice provider, resident, fellow, and/or attending physician spent with the patient in the examination room and/or procedure room.
Total wait time was defined as duration spent by the patient in the waiting room and examination room without any provider present. This included the period of time the patient waited in the examination room following the completion of the initial provider evaluation (advanced practice provider, resident, or fellow) until the attending physician entered the examination room. In most situations, the attending physician exited the examination room prior to the patient while discharge instructions for the patient were being prepared. This remaining short period of time until the patient was discharged from the room was excluded from the calculation of patient wait time.
Setting and data collection
The UPMC Montefiore Chronic Pain Clinic is an outpatient multidisciplinary pain management clinic in a university teaching hospital. The clinic utilizes four examination rooms and one procedure room. Fifteen-minute intervals are allotted for each follow-up visit, and 30-minute intervals are allotted for new patients, which are defined as patients who have not been seen by any provider within the hospital network’s chronic pain division within the past 3 years. These short scheduling intervals are also structured to account for an expected “no-show” rate of approximately 15%, and thus, it is expected that initial and follow-up visits may routinely take longer than these times.
Most patients were evaluated by an advanced practice provider, a fellow, or a resident prior to the attending physician’s evaluation. All new and follow-up evaluations at UPMC Pain Medicine clinics follow a structured comprehensive assessment and multimodal treatment planning approach, which had been studied and shown to have uniform application in practice in our treatment network.10 Time points were recorded onto a standardized checklist during the course of the clinic visit for each patient. Clinic staff recorded the time points of the patient appointment, patient arrival, patient entering examination room, and patient leaving the examination room. The provider entering examination room time and provider leaving examination room time were recorded by the respective provider. These data were subsequently deidentified and recorded in a Microsoft Excel spreadsheet for each of the 5 clinic days. The clinic days that were chosen during the study period represented days when the physician provider staffed the clinic at this single location either in the morning or both in the morning and afternoon.
Per clinic policy, patients who arrived 15 minutes after scheduled appointment time were rescheduled for an appointment at a future date and documented as a missed appointment or “no-show.” All 5 clinic days in this sample included a 45-minute break period in the schedule to account for staff break times that did not include scheduled appointments, although patients were often evaluated during this time period.
Patients
Eighty-one adult patients were evaluated consecutively by one pain medicine attending physician at an outpatient chronic pain clinic. This sample included both initial and established patient visits. Specific patient diagnoses were recorded and documented as one of the following six categories based on the chief complaint: neck/back pain or cervical/lumbar radiculitis, facial pain, chronic abdominal and/or pelvic pain, other joint pain, myalgia, miscellaneous (eg, complex regional pain syndrome, multiple sclerosis, diabetic neuropathy).
Gantt chart creation
A Gantt chart was constructed using the Microsoft Excel® software stacked bar chart feature and de-identified patient time points for each of the 5 clinic days. Each diagram depicts all scheduled patients for 1 clinic day, with a horizontal axis representing the total time span of a single clinic day and a vertical axis representing patients with scheduled clinic appointments specific to 1 clinic day (Figure 1). Specifically, the X-axis, measured in time units (minutes), corresponded to the time of day of clinic operation; the horizontal minimum and maximum bounds were limited to the first and last hour of the clinic day, rounded to the nearest hour. Patients were represented numerically in a chronological order of appointment time on the Y-axis.
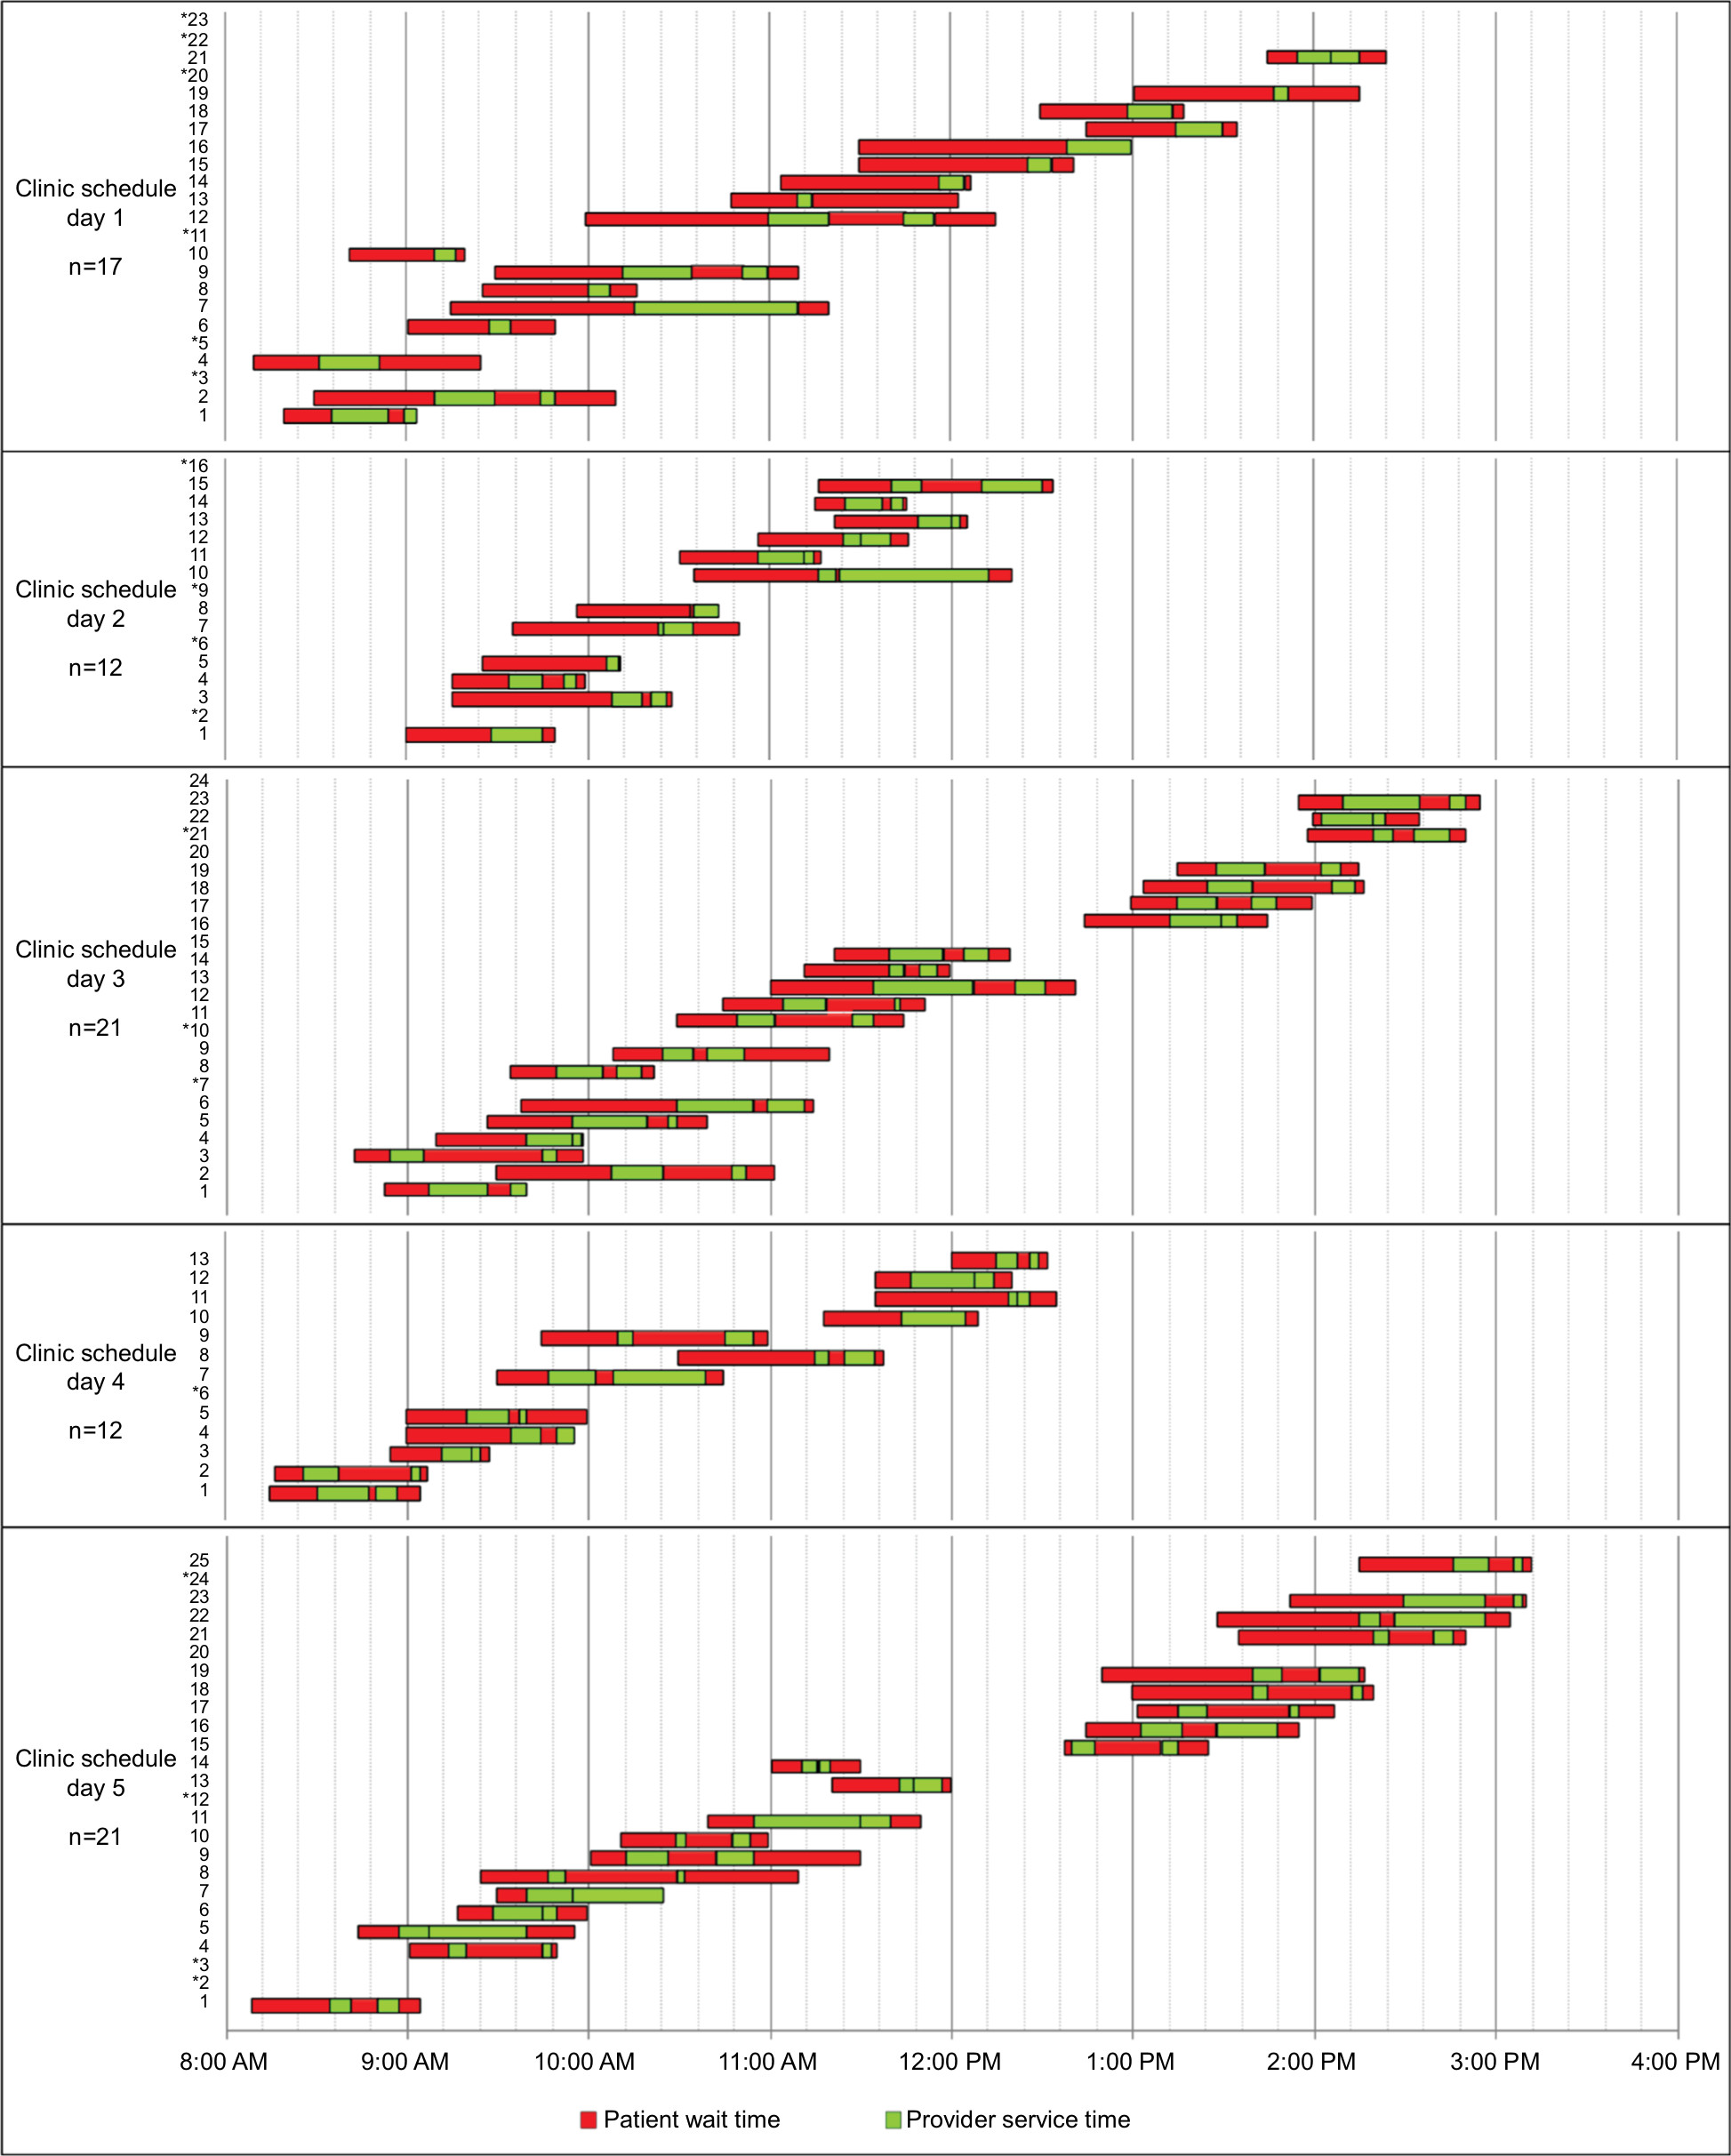 | Figure 1 The number of return/follow-up patients with each diagnosis type is shown in parentheses and the median service time in minutes is shown at the inner right side of each bar. The thick vertical line in the middle of the figure shows the allotted appointment time, and diagnoses that on average exceeded this time extend beyond this line to the right. |
The clinic visit duration is depicted by a single horizontal bar for each patient, which is divided into red and green sectors to represent the wait time and service time, respectively. The individual wait and service intervals can be compared temporally among same day visits to the clinic schedule.
Patients who were documented as “no-shows” are represented by an asterisk on the Y-axis of the diagram without a corresponding bar on the X-axis.
Data analyses
The Shapiro–Wilk test and the normal probability plot were used to test the normality of data. The time interval data and diagnosis subgroups demonstrated non-normal distribution patterns, and non-parametric tests were used for all statistical analyses. Descriptive statistics are presented with median value and IQR. Wait and service time data were compared for new and return patients using the Wilcoxon test. The Kruskal–Wallis test was used to compare the distribution of these values across the pain subgroups and to compare the 5 clinic days. P-values <0.05 were considered statistically significant. JMP®, Version 14.0 (SAS Institute Inc., Cary, NC, USA), 2018, was used for all statistical analyses.
Results
The 5 clinic days included 101 scheduled appointments with 20 no-shows. Of the 81 patients evaluated, 69 were established patients. Two of the 5 clinic days included return patients only although both new and follow-up patients could be scheduled on any given day. The relative number of new and return patients during the clinic days was representative of the provider’s schedule. The median clinic day duration (time of first scheduled appointment until the completion of last appointment) was 5 hours and 55 minutes (range=3 hours and 33 minutes to 6 hours and 24 minutes), with a median of 17 (range=12–20) patient evaluations. Fourteen patients (17%) in the 5-day sample were evaluated by attending physician only; this included 12 of 17 patients on the first clinic day and 2 of 12 patients on the second clinic day. All others were evaluated by a resident, a fellow, or an advanced practice provide prior to the attending physician. New patients were typically seen by a trainee (a resident or a fellow) for teaching purposes. These cases could potentially decrease clinic efficiency because they could lead to increased wait times and service times due to the extra time spent by the trainee with the patient and subsequently discussing the patient with the attending physician prior to the attending physician entering the examination room. However, many follow-up patients were seen by trainees as well since many of these cases also had educational value.
The median clinic visit time for new patients was 72.5 minutes (IQR, 57–97 minutes), including a median wait time of 42 minutes (IQR, 24–58 minutes), and service time of 24 minutes (IQR, 17–31 minutes). The median clinic visit time for established patients was 58 minutes (IQR, 47–75 minutes), including a median wait time of 30 minutes (IQR, 23–46 minutes), and service time of 16 minutes (IQR, 11–23 minutes). Although the median duration of service times was expectably longer for initial visits than follow-up visits (P=0.0425), there were no significant differences in the median values for total clinic visit time and wait time between the groups (P=0.0664 and P=0.1587, respectively).
Clinic visit wait time included the time interval that the patient spent in the waiting room from scheduled appointment time until initial interaction with a provider in the examination room (median, 25 minutes [IQR, 15–38 minutes]) and the period of time between providers (median, 5 minutes [IQR, 0–14 minutes]), if applicable. Time spent in examination room after the attending physician exited the room (median, 6 minutes [IQR, 3–10 minutes]) was excluded. This additional period of waiting time until the patient left the room was used to complete the patient’s orders, prescriptions, urine drug screens, and discharge instructions. Median total examination room time was 55 minutes [IQR, 46.5–73 minutes], and median time spent by the patient in the examination room without a provider present was 35 minutes [IQR, 24.5–51 minutes].
Time spent by the patient in the waiting room before scheduled appointment time was excluded from the analysis (ie, arrival time). This included an additional median wait time of 26 minutes [IQR, 15–36 minutes] for the 64 patients with punctual or early arrival with respect to scheduled appointment time. Seventeen patients arrived <15 minutes late for appointment; those arriving later than 15 minutes were documented as no-shows. Wait times and service times for patients arriving late vs punctual to the clinic appointment did not differ significantly (P=0.5363 and P=0.8527, respectively).
Total median service time, defined as the total time a provider (eg, advanced practice provide, resident, fellow, and/or attending physician) spent in the examination room with the patient, was 18 minutes (IQR, 13–24.5 minutes) for all patients. Median service times (Figure 2) differed dramatically based on the diagnosis (P=0.0051); median wait times were similar (P=0.9703). Diagnoses associated with higher median service times in this sample included facial pain (23 minutes [IQR, 15–31 minutes]), chronic abdominal and/or pelvic pain (21.5 minutes [IQR, 16–27 minutes]), and cervical or lumbar radiculitis or neck/back pain (16 minutes [IQR, 10–22 minutes]). Shorter duration of time with provider were those presenting with myalgia (8 minutes [IQR, 8–8 minutes]) and other joint pain (9 minutes [IQR, 5–17 minutes]); these were the only two groups in the sample that did not include new patient visits.
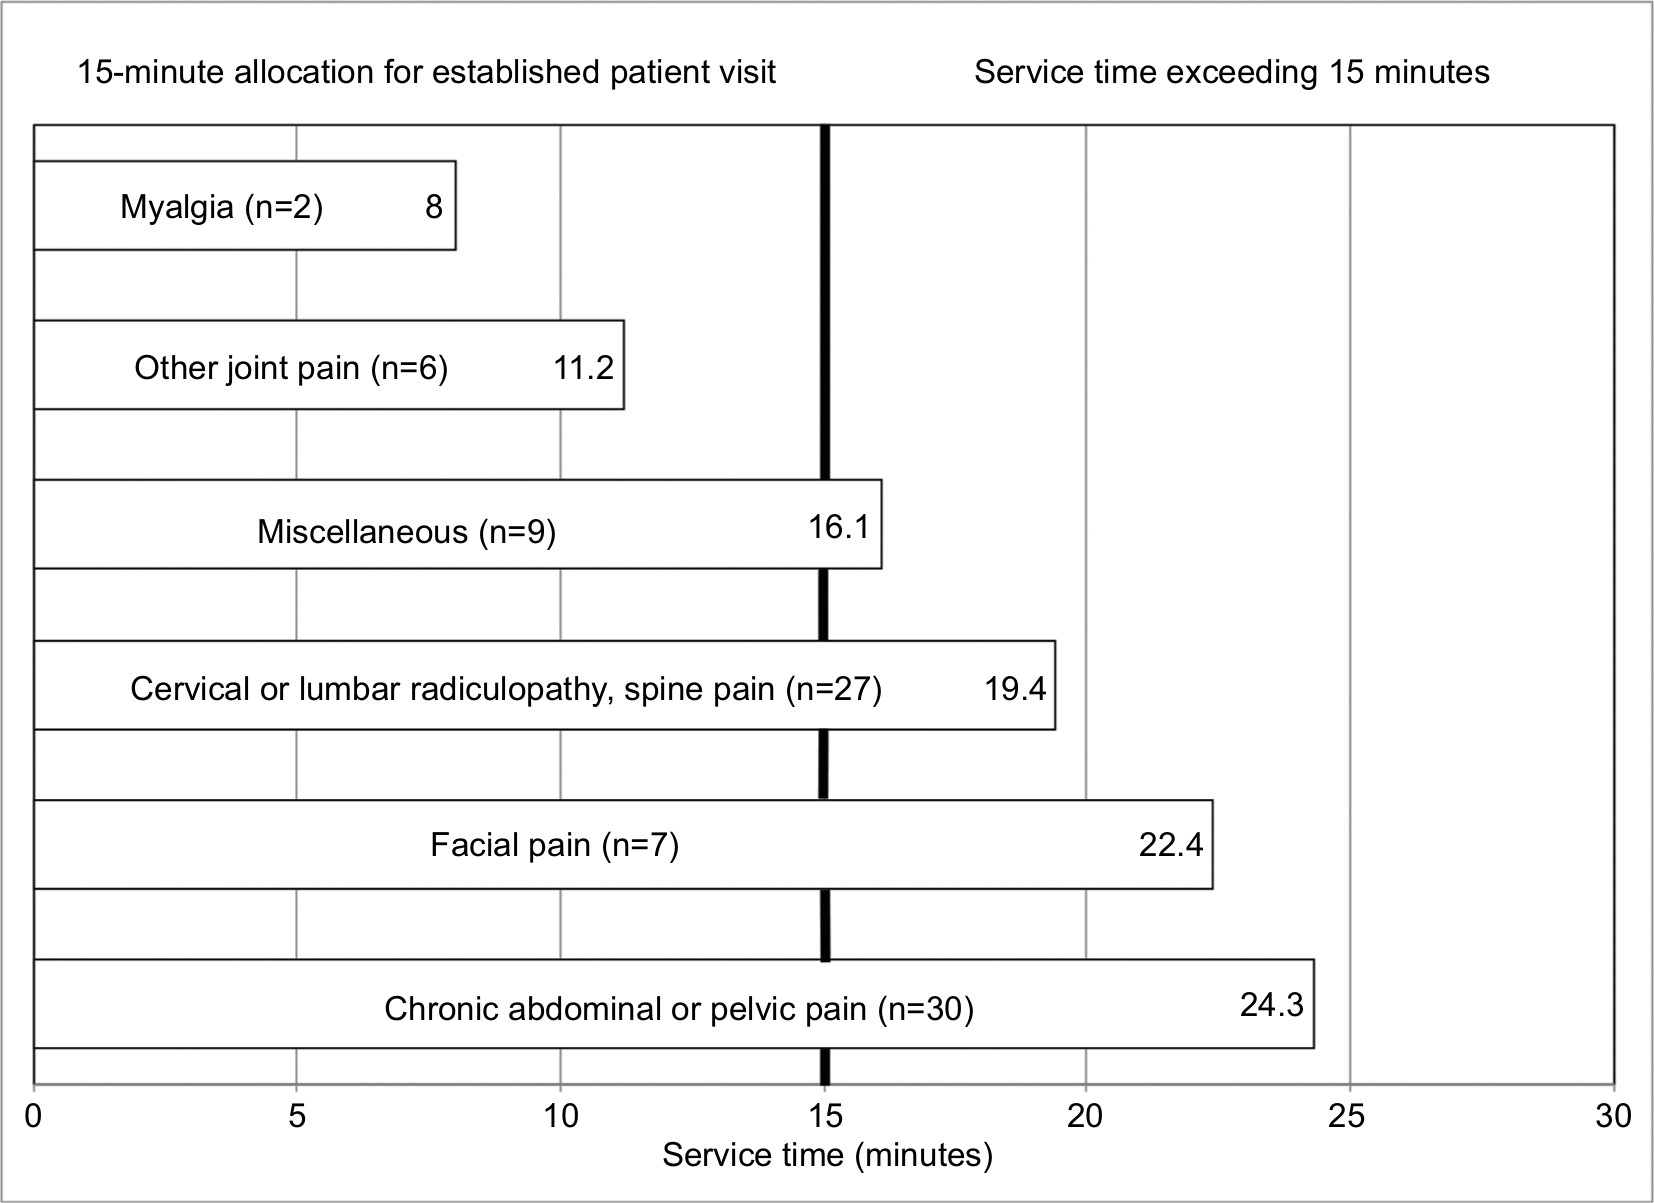 | Figure 2 Service time (minutes) based on the diagnosis, University of Pittsburgh Medical Center pain clinic, March 2016. Notes: The mean wait time for the six diagnosis categories is shown above. The number of return/follow-up patients with each diagnosis type is shown in parentheses and the mean service time in minutes is shown at the inner right side of each bar. The thick vertical line in the middle of the figure shows the allotted appointment time, and diagnoses that on average exceeded this time extend beyond this line to the right. |
Bottlenecks in the clinic schedule due to overbooking were observed to occur at approximately 09:30, and underbooking occurred after 13:00. Although median patient wait times were similar across 5 clinic days (range, 25–33.5 minutes; P=0.5800), specific intervals during individual clinic days are easily visualized on the Gantt Chart in Figure 1.
Discussion
A Gantt chart analysis was applied to a representative clinic schedule of one attending physician to identify both scheduling inefficiencies and areas for process improvement. Specific time points were recorded to determine wait time and service time for all patients in this sample, and Gantt charts provided a visual assessment of patient throughput trends, such as the time of day when patients waited the most and least. Schedule efficiency analysis revealed several factors that contributed to clinic inefficiency.
Our standard practice of booking 30 minutes for new patients and 15 minutes for follow-up patients has been shown to be different from actual practice. This observation would certainly differ based on the individual provider’s practice habits. Adjusting appointment time lengths is not by itself a new concept; a previous study completed at a pain clinic found that allowing specific chronic pain patients to switch from 15- to 30-minute follow-up visits improved certain aspects of their satisfaction with the visit.11 Schedule efficiency analysis also shows that the typical 15-minute return patient time allotment is unrealistic for specific patient diagnoses due to the observation of differing service times depending on the diagnosis. Inaccurate time allotment for patients can affect not only patient satisfaction but also the overall quality of care. In this sample, abdominal and/or pelvic pain and facial pain consistently had service times exceeding the 15-minute allocation for return visits. Scheduling by diagnosis instead of the designated 15-minute established patient (30 minutes for initial patient visit) allotment may prove efficacious; this had not previously been widely reported in the literature and would be a novel booking scheme for patients. However, it would be unrealistic to create a clinic schedule based on the appointment slots set to an exact number of minutes. Instead, the six diagnosis categories used in this study could be used by office schedulers to help create appointment slots that approximate the expected length of visit. An example of how this change could be implemented is presented in Table 1.
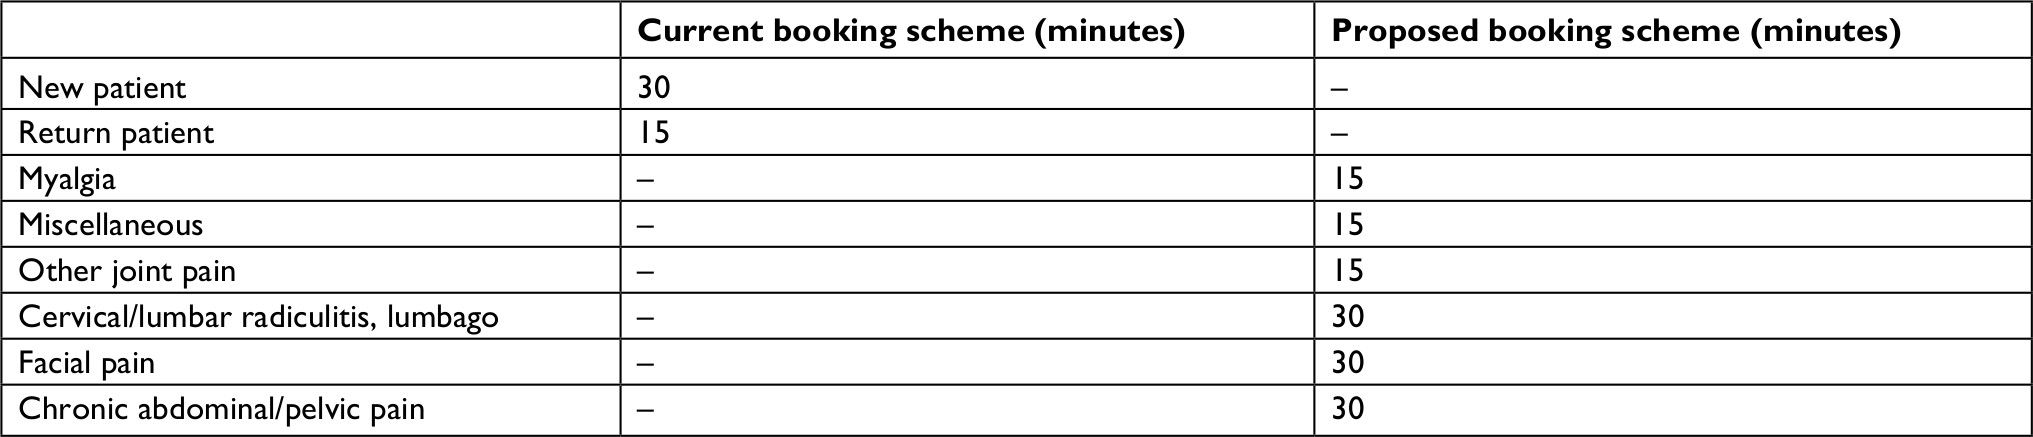 | Table 1 Proposed appointment booking scheme by pain diagnosis |
Certain diagnoses tended to have longer office visits. Specifically, visits were longer for the diagnoses of facial pain and chronic abdominal and/or pelvic pain. These visits tended to be longer in duration for multiple reasons, including the need to often have detailed discussions on the risks and benefits of specific injections pertaining to their diagnosis, discussions surrounding the use of controlled substances, and the need for attention to the psychiatric components of their pain history. Furthermore, patients with these diagnoses often had been referred to this university-based pain management clinic after having seen numerous other specialists in the past, and therefore had a complex medical history to review with the patient. Factors that attributed to the shorter duration of time spent with the provider among those with a diagnosis of myalgia include the decreased use and discussion of controlled substances (eg, opioids) as treatment options and a decreased utilization of fluoroscopic guidance for procedures.
Examination room utilization was also inefficient with approximately 62% of examination room time as idle time. Such “down” time may be an opportunity for patient education about pain using written or electronic materials or for the completion of surveys for patient-reported outcomes. This idle time could also be used for complementary techniques that encourage patient relaxation such as ambient music therapy.12 Idle time may also be considered a negative consequence of clinic inefficiency because it gives the patient additional time to agonize about the reason for their visit and potentially feel a sense of abandonment.13
Given that the majority of patients seen in this clinic were established patients for 15-minute appointments, any schedule change that would result in established patients being seen in 30-minute appointment slots could theoretically decrease the number of patients seen per day by any provider. However, an improvement in scheduling efficiency may allow for improved satisfaction through lower patient wait times and for the potential to add additional patient appointments during underbooked time periods. One retrospective study of new patient wait times at an orthopedic clinic found a significant correlation between wait times at the clinic and the patient’s overall satisfaction with the clinic experience.14
Variables contributing to clinic inefficiency may differ between physicians and institutions. Gantt charts can be used to make a personalized “smart” schedule for each physician based on a provider’s average service rates (provider time with patient) and waiting time rates. This offers the ability to identify factors contributing to inefficiencies specific to individual and can be adjusted accordingly.
Clinic efficiency can also be improved through other strategies. One study ran simulations to show that overbooking patients can help counterbalance patient “no-shows,” especially in clinics with lower service time variability and large patient volumes.15 Computer simulation and modeling has also been used to identify optimal staff levels, identify causes of delay in patient flow, and improve scheduling.16,17
This study is not intended to account for factors contributing to inefficiencies at other clinics or institutions; instead, it provides a method that may aid clinic efficiency analysis and improve the quality of care that could then be applied to other outpatient clinic settings.
Limitations
Analysis for this study involved data from 81 patients over a 5-day period. Although an individual Gantt diagram can be created for each clinic day, the short study period may lead to a skewed representation of the time data given the limited data points. An individual provider’s schedule may vary dramatically from the schedule template used by this provider. For example, the median clinic day duration may be considered shorter than expected. This was due to the provider spending the first 3 hours of each day in other inpatient care and offsite responsibilities.
Patients arriving more than 15 minutes late were rescheduled for a future appointment and were documented as “no-shows” in this analysis. The provider entering examination room time and provider leaving examination room time were recorded by the respective provider; all providers were aware that these data were being collected for a clinic efficiency analysis. Utilization of an independent observer to record times could be used to help minimize this bias. Finally, the grouping of patients into specific diagnosis categories is often an oversimplification that becomes difficult in real practice when one accounts for overlapping of diagnoses, multiple diagnoses, and severity of disease. If the clinic schedule was switched to book based on diagnosis, it would also require basic medical knowledge of the scheduling staff to determine the diagnosis category of the patient.
Conclusion
This single provider study is intended to demonstrate a method that may aid in analysis of outpatient chronic pain clinic efficiency and scheduling management. The next step in this project is to perform additional analyses of wait times and services times with new Gantt diagram creation after the implementation of a booking scheme based on the patient diagnosis. An understanding of queue line theory principles, such as wait times and service times, can help both practice managers and individual providers optimize scheduling to improve efficiency.
Acknowledgment
The authors thank the UPMC Montefiore Chronic pain clinic staff for their assistance with data acquisition.
Disclosure
The authors report no conflicts of interest in this work.
References
Department of Health and Human Services. National pain strategy: a comprehensive population health-level strategy for pain; 2016. Available from: https://iprcc.nih.gov/sites/default/files/HHSNational_Pain_Strategy_508C.pdf. Accessed October 7, 2018. | ||
Belson D. Managing a patient flow improvement project. In: Hall R, editor. Patient Flow. Boston, MA: Springer US; 2013:507–527. | ||
Clark W, Polakov WN, Trabold FW. The Gantt Chart. A Working Tool of Management. New York: Ronald Press Company; 1922. | ||
Wilson JM. Gantt charts: A centenary appreciation. Eur J Oper Res. 2003;149(2):430–437. | ||
Oh HJA, Muriel A, Balasubramanian H. A user-friendly excel simulation for scheduling in primary care practices. Proceedings of the 2014 Winter Simulation Conference. 2014; Savannah, Georgia. | ||
Fischman D. Applying Lean Six Sigma methodologies to improve efficiency, timeliness of care, and quality of care in an internal medicine residency clinic. Qual Manag Health Care. 2010;19(3):201–210. | ||
Duska LR, Mueller J, Lothamer H, Pelkofski EB, Novicoff WM. Lean methodology improves efficiency in outpatient academic Gynecologic Oncology clinics. Gynecol Oncol. 2015;138(3):707–711. | ||
Skeldon SC, Simmons A, Hersey K, et al. Lean methodology improves efficiency in outpatient academic uro-oncology clinics. Urology. 2014;83(5):992–997. | ||
Sheikh A, Lakshmipathy M, Prakash A. Application of queuing theory for effective equipment utilization and maximization of productivity in construction management. Int J App Eng Res. 2016;11(8):5664–5672. | ||
Heres EK, Itskevich D, Wasan AD. Operationalizing multidisciplinary assessment and treatment as a quality metric for interventional pain practices. Pain Med. 2018;19(5):910–913. | ||
Baule KA, Scott LD, Rosenberger KD, Minore WS. Improving satisfaction among established patients in a midwestern pain clinic. Appl Nurs Res. 2017;33:54–60. | ||
Fenko A, Loock C. The influence of ambient scent and music on patients’ anxiety in a waiting room of a plastic surgeon. HERD. 2014;7(3):38–59. | ||
Rondeau KV. Managing the clinic wait: an important quality of care challenge. J Nurs Care Qual. 1998;13(2):11–20. | ||
Kreitz TM, Winters BS, Pedowitz DI. The influence of wait time on patient satisfaction in the orthopedic clinic. J Patient Exp. 2016;3(2):39–42. | ||
Laganga LR, Lawrence SR. Clinic overbooking to improve patient access and increase provider productivity. Dec Sci. 2007;38(2):251–276. | ||
Harper PR, Gamlin HM. Reduced outpatient waiting times with improved appointment scheduling: a simulation modelling approach. OR Spectrum. 2003;25(2):207–222. | ||
Rohleder TR, Lewkonia P, Bischak DP, Duffy P, Hendijani R. Using simulation modeling to improve patient flow at an outpatient orthopedic clinic. Health Care Manag Sci. 2011;14(2):135–145. |
 © 2018 The Author(s). This work is published and licensed by Dove Medical Press Limited. The
full terms of this license are available at https://www.dovepress.com/terms
and incorporate the Creative Commons Attribution
- Non Commercial (unported, 3.0) License.
By accessing the work you hereby accept the Terms. Non-commercial uses of the work are permitted
without any further permission from Dove Medical Press Limited, provided the work is properly
attributed. For permission for commercial use of this work, please see paragraphs 4.2 and 5 of our Terms.
© 2018 The Author(s). This work is published and licensed by Dove Medical Press Limited. The
full terms of this license are available at https://www.dovepress.com/terms
and incorporate the Creative Commons Attribution
- Non Commercial (unported, 3.0) License.
By accessing the work you hereby accept the Terms. Non-commercial uses of the work are permitted
without any further permission from Dove Medical Press Limited, provided the work is properly
attributed. For permission for commercial use of this work, please see paragraphs 4.2 and 5 of our Terms.