Back to Journals » Clinical Ophthalmology » Volume 13
Chromatic pupilloperimetry for objective diagnosis of Best vitelliform macular dystrophy
Authors Ben Ner D, Sher I ![]() , Hamburg A, Mhajna MO, Chibel R, Derazne E, Sharvit-Ginon I
, Hamburg A, Mhajna MO, Chibel R, Derazne E, Sharvit-Ginon I ![]() , Pras E, Newman H, Levy J
, Pras E, Newman H, Levy J ![]() , Khateb S, Sharon D, Rotenstreich Y
, Khateb S, Sharon D, Rotenstreich Y
Received 23 October 2018
Accepted for publication 9 January 2019
Published 5 March 2019 Volume 2019:13 Pages 465—475
DOI https://doi.org/10.2147/OPTH.S191486
Checked for plagiarism Yes
Review by Single anonymous peer review
Peer reviewer comments 2
Editor who approved publication: Dr Scott Fraser
Video abstract presented by Ygal Rotenstreich.
Views: 243
Daniel Ben Ner,1,2 Ifat Sher,1 Amit Hamburg,1,2 Mohamad O Mhajna,1,2 Ron Chibel,1,2 Estela Derazne,2 Inbal Sharvit-Ginon,3,4 Eran Pras,2,5 Hadas Newman,2,6 Jaime Levy,7 Samer Khateb,7 Dror Sharon,7 Ygal Rotenstreich1,2
1Goldschleger Eye Institute, Sheba Medical Center, Tel Hashomer, Israel; 2Sackler Faculty of Medicine, Tel Aviv University, Tel Aviv, Israel; 3Department of Psychology, Bar Ilan University, Ramat Gan, Israel; 4The Joseph Sagol Neuroscience Center, Sheba Medical Center, Ramat Gan, Israel; 5The Matlow’s Ophthalmo-Genetics Laboratory, Department of Ophthalmology, Assaf-Harofeh Medical Center, Zerifin, Israel; 6Ophthalmology Department, Tel Aviv Sourasky Medical Center, Tel Aviv, Israel; 7Department of Ophthalmology, Hadassah-Hebrew University Medical Center, Jerusalem, Israel
Purpose: To determine the pupil response of Best vitelliform macular dystrophy (BVMD) patients for focal blue and red light stimuli presented at 76 test points in a 16.2° visual field (VF) using a chromatic pupilloperimeter.
Methods: An observational study was conducted in 16 participants: 7 BVMD patients with a heterozygous BEST1 mutation and 9 similar-aged controls. All participants were tested for best-corrected visual acuity, chromatic pupilloperimetry and Humphrey perimetry. Percentage of pupil contraction (PPC), maximal pupil contraction velocity (MCV) and latency of MCV (LMCV) were determined.
Results: The mean PPC and MCV recorded in BVMD patients in response to red stimuli were lower by >2 standard errors (SEs) from the mean of controls in 47% and 43% of VF test points, respectively. The mean PPC and MCV recorded in the patients in response to blue stimuli were lower by >2 SEs from the mean of controls in 36% and 24% of VF test points, respectively. The patients’ mean and median MCV recorded in response to red light correlated with their Humphrey mean deviation score (r=−0.714, P=0.071 and r=−0.821, P=0.023, respectively) and visual acuity (r=0.709, P=0.074 and r=0.655, P=0.111, respectively). A substantially shorter mean LMCV was recorded in BVMD patients compared to controls in 54% and 93% of VF test points in response to red and blue light, respectively. Receiver operating characteristic analysis for LMCV in response to red light identified a test point at the center of the VF with high diagnostic accuracy (area under the curve of 0.94).
Conclusion: Chromatic pupilloperimetry may potentially be used for objective noninvasive assessment of rod and cone cell function in different locations of the retina in BVMD patients.
Keywords: Best vitelliform macular dystrophy, pupillary light reflex, perimetry, pupilloperimetry, visual field
Introduction
Best vitelliform macular dystrophy (BVMD) is an autosomal dominant macular degeneration disease. Over 120 causative mutations were identified in the BEST1 gene that encodes the calcium-activated anion channel bestrophin-1.1 Aberrant cellular ion flux due to defects in bestrophin-1 trafficking, channel activity and calcium signaling pathways leads to aberrant retinal pigment epithelium (RPE) cell function and accumulation of lipofuscin in the RPE cells and in the sub-RPE space, followed by RPE cell loss of function and photoreceptor degeneration.2–4
BVMD is clinically characterized by a bilateral egg yolk-like macular lesion.5 At the early stage of BVMD, a dome-shaped, fluid-filled (vitelliform) lesion in the center of the macula can be observed by fundus autofluorescence (FAF) imaging. Most BVMD patients first notice a reduction of visual acuity when the vitelliform lesions change to the pseudohypopyon stage, followed by vitelliruptive changes and finally resulting in atrophic lesions. The full-field electroretinogram (ERG) is normal in these patients.6 Hence, evaluation of retinal function is based mainly on electrooculography and visual acuity testing that are limited by their low sensitivity and subjectivity, respectively.7 BVMD disease progression can be monitored at the structural level using optical coherence tomography (OCT) and FAF.8,9 However, these structural assessments do not provide functional information.
In previous studies, we demonstrated that chromatic pupilloperimetry may be used for objective assessment of visual field (VF) defects and photoreceptor function at distinct locations of the VF in patients with retinitis pigmentosa, a predominantly peripheral retinal disease. Low test–retest variability was demonstrated, and the patients presented significantly lower percentage of pupil contraction (PPC) and maximal pupil contraction velocity (MCV) compared to similar-age controls in VF areas that were abnormal by chromatic dark adapted Goldmann VF.10 Transient pupil response to blue light, which is mediated mainly by rods, was more affected in the patients than the pupil response to red light, which is mediated mainly by cones, in agreement with the disease pathology. In the present study, we examined the feasibility of using chromatic pupilloperimetry for objective assessment of focal photoreceptor function in BVMD patients.
Participants and methods
Participants
The study was conducted according to the tenets of the Declaration of Helsinki, received approval from the Sheba Medical Center Institutional Review Board Committee and was registered at www.ClinicalTrials.gov (registration no NCT02014389). Informed written consent was obtained from all participants included in the study.
Since BVMD is a very rare condition, seven BVMD patients (24–82 years old) were enrolled. We originally planned to test seven controls; however, we had the possibility to enroll nine healthy participants (29–60 years old). The mean age of the participants in the two groups did not differ significantly (mean ± SD: 44.63±17.77 vs 42.89±13.19, respectively, P=0.9).
All participants underwent monocular visual acuity testing using a Snellen chart at a working distance of 6 m under mesopic conditions. Inclusion criteria for the control group were normal eye examination with no history of ocular disease, normal color vision (Farnsworth/Lanthon D-15 Test), best-corrected visual acuity (BCVA) of 20/20, no use of topical or systemic medications that could adversely affect the pupil response and normal Humphrey 24-2 perimetry testing (Humphrey Field Analyzer II, Swedish Interactive Threshold Algorithm 24-2; Carl Zeiss Meditec, Inc., Jena, Germany).
The BVMD group (three females and four males) was recruited on the basis of a clinical diagnosis of BVMD made by a board-certified ophthalmologist and a confirmed mutation in the BEST1 gene. Patients’ characteristics are detailed in Table 1.
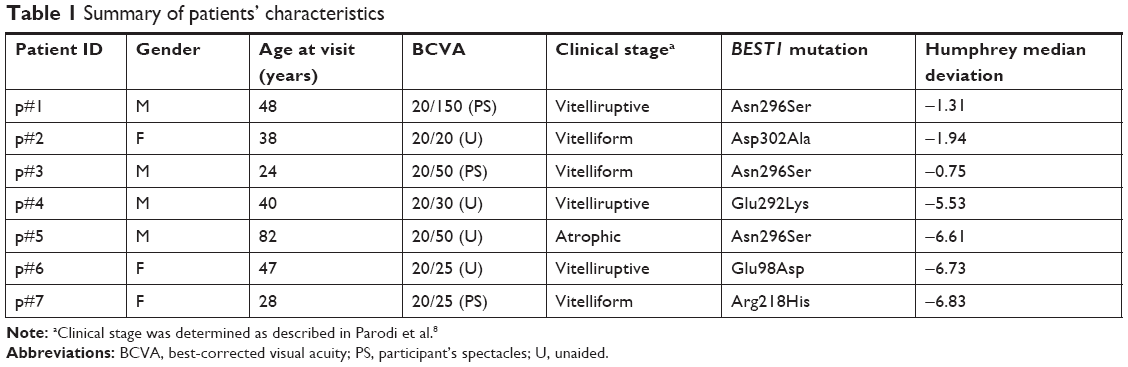 | Table 1 Summary of patients’ characteristics |
Exclusion criteria were a concurrent ocular disease and any other condition affecting the pupil response. Data were recorded for all patients, including gender, genetic mutation, Snellen BCVA and 24-2 Humphrey perimetry. Although the 10-2 program is aimed at macular (10°) perimetry, the 24-2 program was chosen in order to cover the 16.2° VF that was tested by the chromatic pupillometry.
Chromatic pupilloperimetry
participants were adapted for mesopic light conditions for 2 minutes prior to testing, and the test was performed in a dark room. Light stimuli (0.43°, Goldmann size III) were presented in a 16.2° VF from 76 targets (light-emitting diodes [LEDs]; Figure S1A) using a chromatic pupilloperimeter (Accutome Inc.) as we previously described.10
A white light background luminance was presented in the device at an intensity of 0.05 cd/m2. The right eye was tested and the left eye was occluded. Participants were asked to fixate on a central white fixation LED (light intensity 0.9 cd/m^2) at the center of the dome. All participants, including BVMD patients, easily fixated their gaze on the fixation LED throughout the test. Fixation was monitored by the technician on the computer screen. If loss of fixation was detected, the test was paused, the subject was requested to fixate on the central fixation LED and the test point was retested. Light stimuli were presented for 1 second, and the time interval between consecutive light stimuli was 4 seconds. Full recovery of pupil size was obtained by 3.5 seconds following light stimulus onset. Red (624±5 nm, 1,000 cd/m2) and blue (485±5 nm, 400 cd/m2) light stimuli were used. The light intensities were chosen based on the minimal stimulus intensity that yielded a substantial transient pupil response in five healthy participants (data not shown). Pupil diameter was recorded at a rate of 30 Hz. Three pupil response parameters were determined automatically by the software: PPC, MCV (in pixel/s) and the latency of MCV (LMCV, in seconds, measured from stimulus onset to the time that maximal contraction velocity was recorded) as we previously described (Figure S1B and references Chibel et al10 and Skaat et al11). Test points in which the subject blinked during the first 2.5 seconds following stimulus onset were excluded, and the test points were automatically retested. Test points in which the device failed to record the pupil response due to blinking were aborted after three retest attempts and PPC, MCV and the latency of MCV were marked as “n” in the “pupilloperimetry VF” maps and were not included in the analysis.
The mean absolute deviation of LMCV of each subject was calculated by determining the mean of the absolute difference between the mean LMCV among the subject’s 76 test points and the measurement in each of the test points, as previously described.10,11
Precision of LMCV measurement was quantified by calculating the mean, SD, average deviation, range and coefficient of variation in three healthy participants (three females, age 22–46 years) who were retested eight to ten times in central (#33) and peripheral (#39) VF test points in response to red and blue light. Repeated testing was performed every 30 minutes. Results are shown in Table S1. The pupilloperimetry data of controls and BVMD patients are presented in Tables S2 and S3, respectively.
Statistical analyses
Statistical analysis was performed using the SPSS Statistics for Windows, Version 23.0 (IBM Corporation, Armonk, NY, USA). Age and gender of the study groups were compared using Student’s t-test and Fisher’s exact test, respectively. Test points in which the device failed to record the pupil response due to blinking were not included in the analysis. Variability in LMCV recordings between test points was measured by the mean absolute deviation, and this measure was compared between the BVMD and the control group using a two-sided Mann–Whitney test. The area under the receiver operating characteristic (ROC) curve (AUC) and P-value were calculated for LMCV in response to blue and red light for each test point. Spearman correlation was used to assess the association between the patients’ median and mean PPC, MCV and LMCV recorded in response to red and blue light and their Humphrey mean deviation (MD) score and BCVA. We did not adjust the P-values for multiple comparisons, although we performed several tests due to the following:
- To the best of our knowledge, this study tests the pupillary responses of BVMD patients for focal chromatic light stimuli for the first time. We followed Rothman’s approach and have not corrected for multiple comparisons as we wanted to avoid missing a possible effect. This concept was suggested by Rothman in 1990 and the results are considered to be hypotheses for further studies.12
- We have an a priori hypothesis that AUC will differ between test points, and that the association between the different pupilloperimetry variables and Humphrey MD and BCVA will differ.13,14
Results
Characterization of pupil responses of control participants
All control participants were included in the study and analyzed. The mean pupilloperimetry results of the control group are presented in Figure 1.
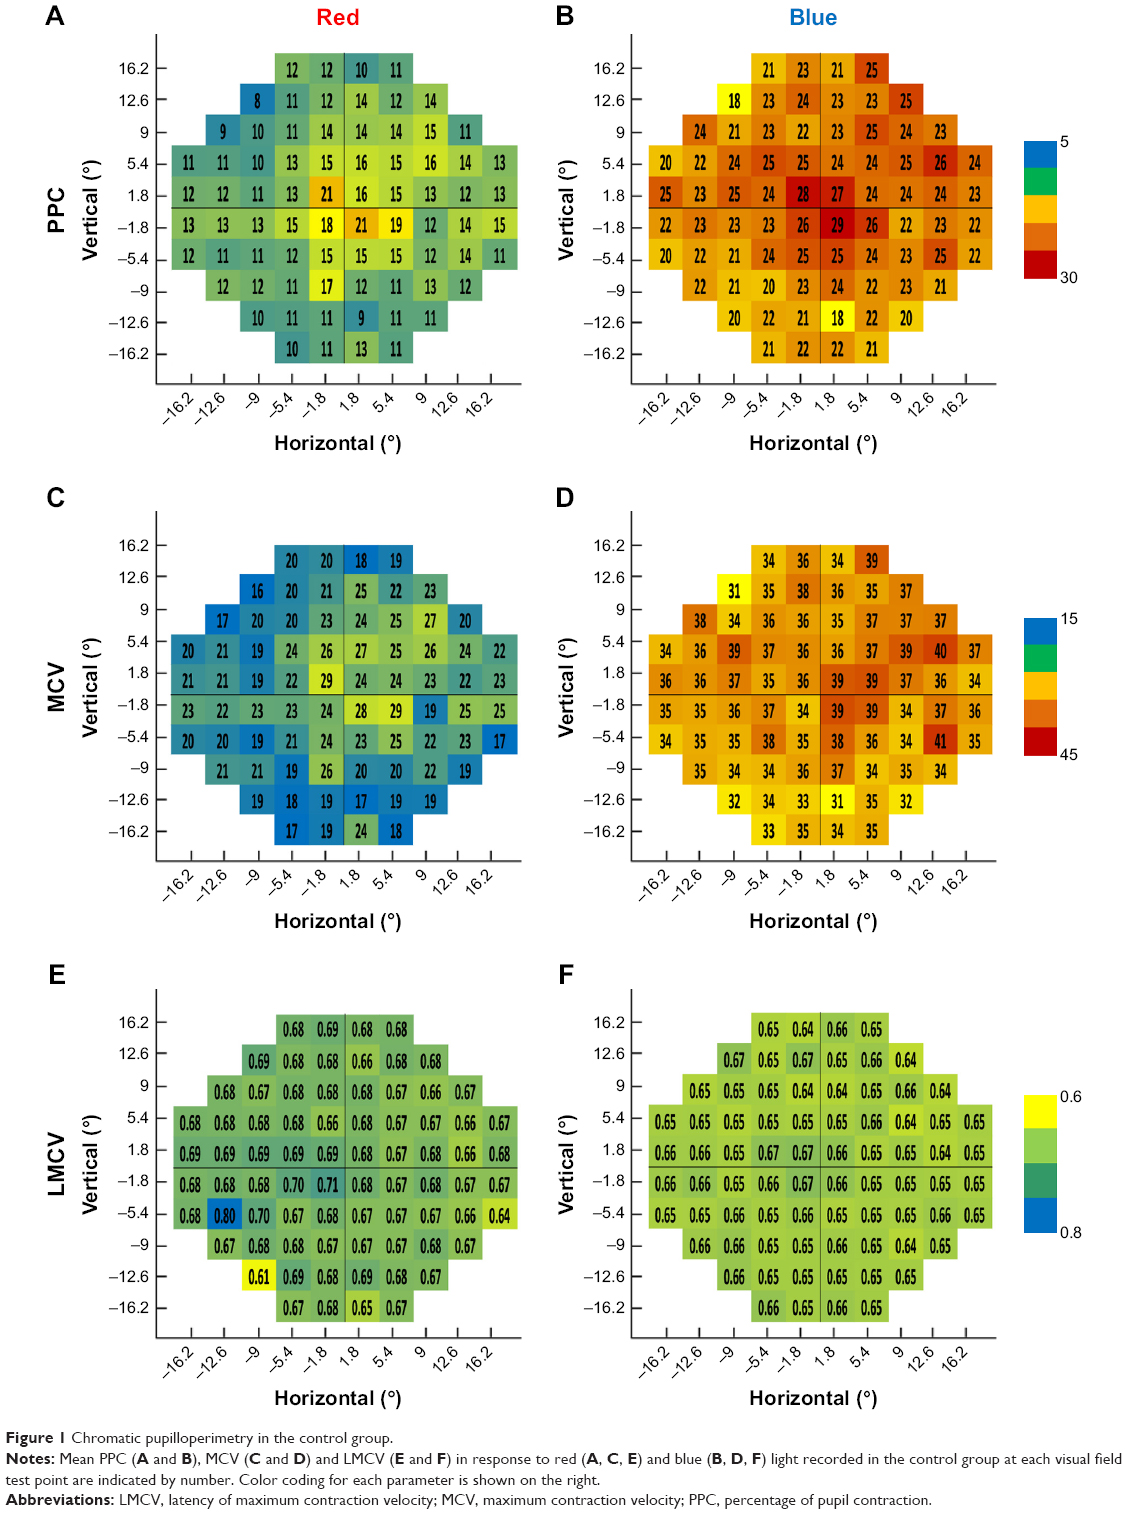 | Figure 1 Chromatic pupilloperimetry in the control group. |
Although the red light stimuli were presented at a 2.5-fold higher intensity than the blue light stimuli, the mean PPC recorded in response to red light stimuli was lower than the mean PPC recorded in response to blue light stimuli in the same VF test points (Figure 1A and B). Higher mean PPC was recorded in central compared with peripheral VF test points in response to red light (Figure 1A). The central–peripheral gradient pattern was less evident in response to blue light (Figure 1B). The mean MCV recorded was lower in response to red light stimuli compared with blue light stimuli (Figure 1C and D). The mean LMCV ranged between 0.6 and 0.8 seconds. In general, the mean LMCV was longer in response to red light than to blue light. In response to red light, mean LMCV >0.66 seconds was measured in 88% of the VF test targets. By contrast, in response to blue light, mean LMCV >0.66 seconds was measured only in five VF test targets (Figure 1E and F).
BVMD patients demonstrated lower PPC and MCV compared with controls, with a more substantial defect in response to red than blue light
All BVMD patients were included in the study and analyzed. Figure 2 illustrates the chromatic pupilloperimetry maps of mean PPC (Figure 2A and B), MCV (Figure 2C and D) and LMCV (Figure 2E and F) recorded in each VF test point in response to red and blue light stimuli in the BVMD group. Color coding was used for visualization of pupil response defects. White color denotes values that are within two standard errors (SEs) from the mean of controls; dark gray color was used for values that were lower in patients by over 2 SEs from the mean of controls; yellow-orange color was used for values that were higher in patients by over 2 SEs from the mean of controls.
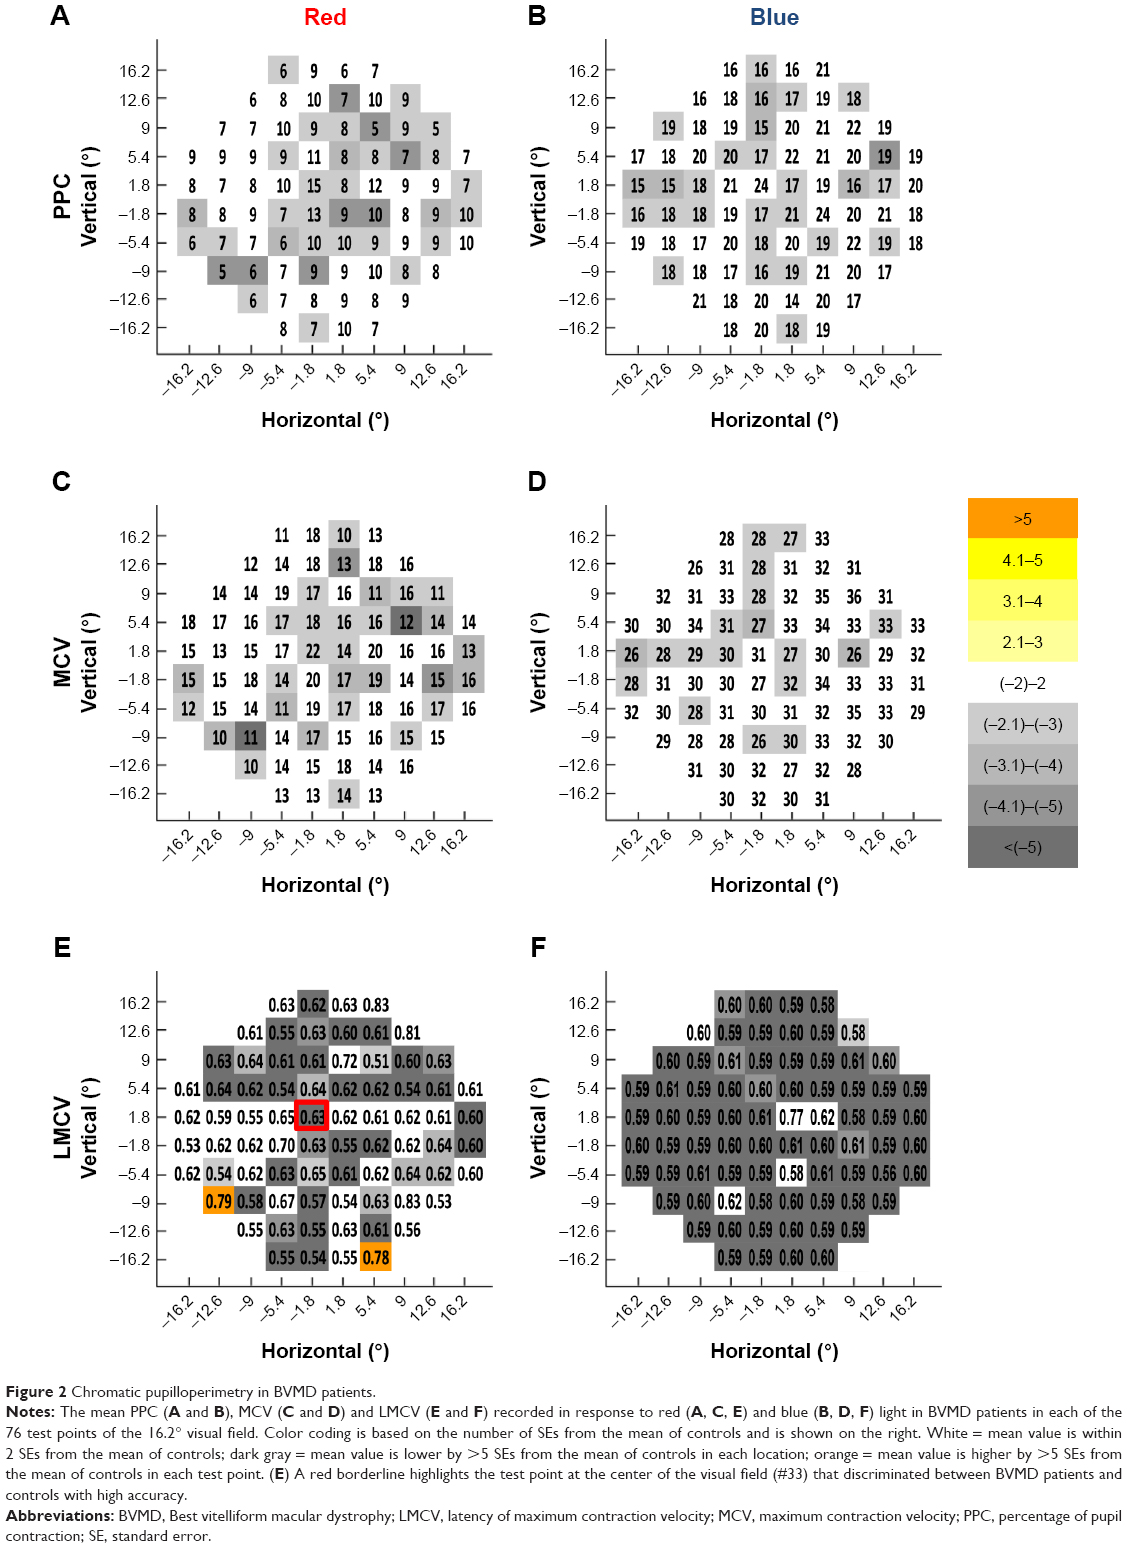 | Figure 2 Chromatic pupilloperimetry in BVMD patients. |
BVMD patients demonstrated lower mean PPC compared to controls in response to red light in 47% of VF test points (Figure 2A). A milder reduction in PPC was recorded in patients in response to blue light, with only 27 VF test points (36%) that presented mean PPC values that were lower than 2 SEs from the mean of controls (Figure 2B). The MCV recorded in the patients was lower by >2 SEs away from the mean of controls in 43% and 24% of VF test points in response to red and blue light stimuli, respectively (Figure 2C and D).
LMCV recorded in a central VF target in response to red light discriminates between patients and controls with high sensitivity and specificity
Surprisingly, a substantially shorter mean LMCV was recorded in BVMD patients compared to controls in 54% and 93% of test points in response to red and blue light, respectively (Figure 2E and F). The mean LMCV of patients was shorter by over 2 SEs from the mean of controls in three of the four central VF targets in response to both light colors. Figure S2 illustrates representative normalized pupil response waveforms of four BVMD patients recorded in a central VF test (#33) in response to red and blue light. Patient #2 who was diagnosed with an early-stage BVMD presented normal latency of pupil response. By contrast, participants #1, #5 and #6, who were diagnosed with a more advanced disease, presented shorter than normal latencies of pupil response.
Similar to controls, BVMD patients demonstrated a relatively narrow range of LMCV values with a small mean absolute deviation in response to red (0.05 [SD =0.07] vs 0.02 [SD =0.02], P=0.21) and blue (0.02 [SD =0.01] vs 0.01 [SD =0.003], P=0.68) light stimuli. ROC AUC analysis revealed that LMCV recorded in response to red light in the central VF test target #33 had the largest AUC (94%, P=0.004) and was selected for discriminating BVMD patients from controls (Figure S3). This target is highlighted with a red square in Figures 2–4.
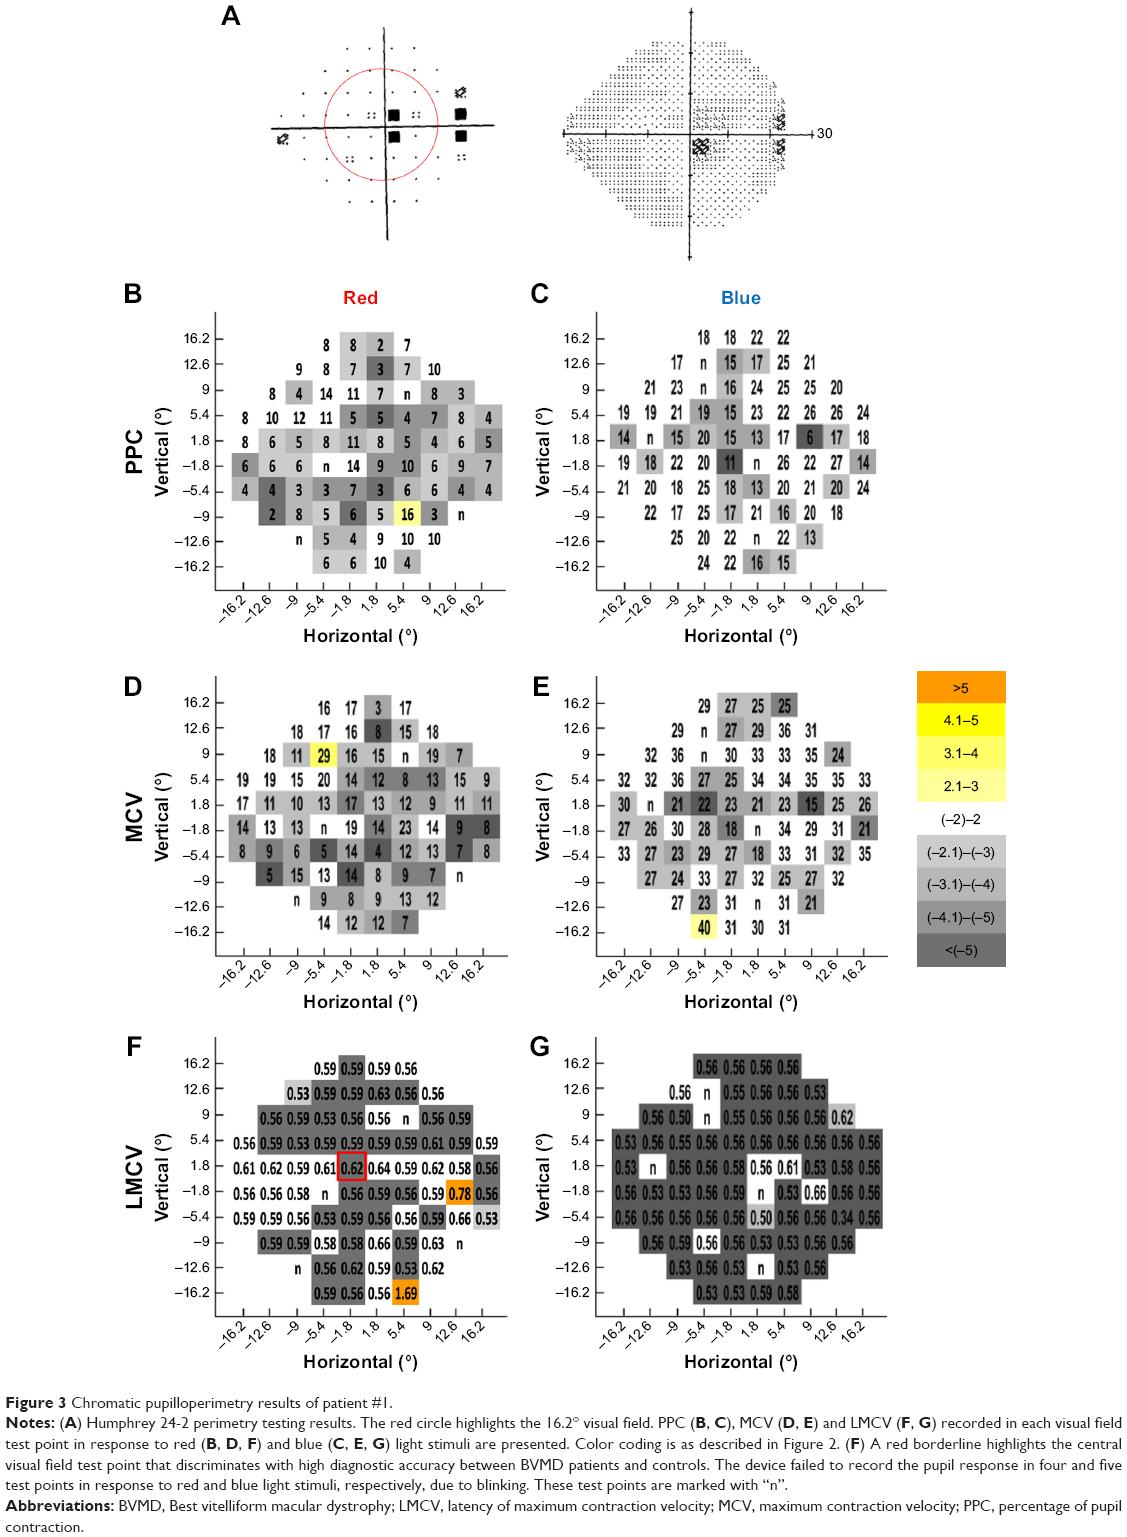 | Figure 3 Chromatic pupilloperimetry results of patient #1. |
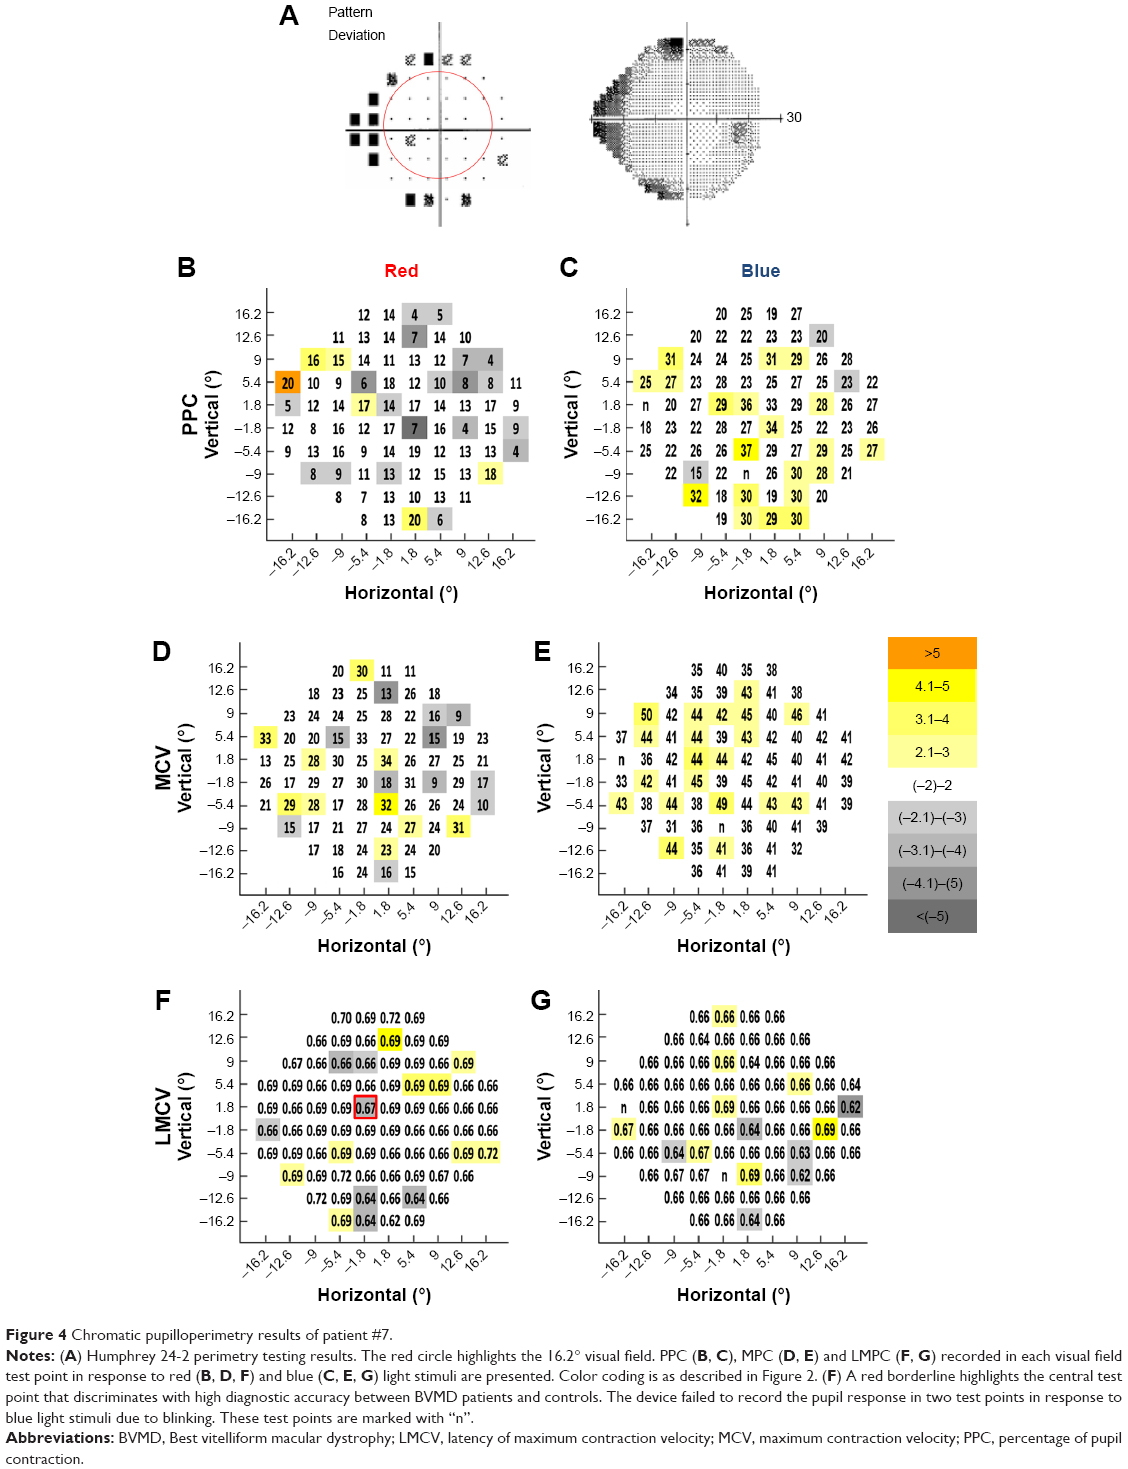 | Figure 4 Chromatic pupilloperimetry results of patient #7. |
Correlation between patients’ MCV, Humphrey perimetry MD score and BCVA
Spearman correlation was used to assess the association between the patients’ median and mean PPC, MCV and LMCV recorded in response to red and blue light, their Humphrey MD score and BCVA (Table S4). The mean and median MCV recorded in response to red light correlated with the patients’ Humphrey MD score (r=−0.714, P=0.071 and r=−0.821, P=0.023, respectively) and BCVA (r=0.709, P=0.074 and r=0.655, P=0.111, respectively). In addition, the mean and median MCV recorded in response to blue light correlated with the patients’ Humphrey MD score (r=−0.893, P=0.007 and r=−0.893, P=0.007, respectively).
Individual cases
Patient #1 – vitelliruptive/fibrotic stage with BCVA of 20/150
Patient #1 carried the p.Asn296Ser mutation and was diagnosed with a vitelliruptive/fibrotic stage and BCVA of 20/150. Humphrey perimetry demonstrated a central VF loss (Figure 3A). Pupilloperimetry testing revealed a diminished pupil response to red light, with 71% of the VF test points presenting PPC and MCV values that were <2 SEs from the mean of controls (Figure 3B and D). The PPC and MCV were less affected in response to blue light. In 30% and 46% of the test targets, the PPC and MCV recorded were lower by over 2 SEs from the mean of controls (Figure 3C and E). The LMCV was shorter than the mean of controls by >2 SEs in a majority of the VF test points in response to red and blue light (53% and 87% of the VF test points; Figure 3F and G, respectively). In a vast majority of these test points, LMCV was shorter by over 5 SEs away from the mean of controls. As illustrated in Figure 3F (red square) and Figure S2, the LMCV recorded in this patient in the discriminatory central VF test point was lower by over 5 SEs from the mean of controls.
Patient #7 – vitelliform stage with BCVA of 20/25
Patient #7 carried the p.Arg218His mutation and at the time of testing, the patient was diagnosed with an earlier stage of the disease compared with patient #1 (vitelliform stage). Humphrey 24-2 perimetry demonstrated loss of peripheral nasal VF with sparing of the central 20° VF (Figure 4A). The PPC and MCV recorded in response to red light in this patient were lower by >2 SEs than the mean of controls in 25% and 15% of the VF test points, respectively. These test points were mostly localized in the periphery of the VF (Figure 4B and D). LMCV was shorter by >2 SEs than the mean of controls in 9% of the VF test points, including the discriminatory central VF test point (Figure 4F). The PPC recorded in response to blue light in this patient was lower by over 2 SEs from the mean of controls only in three peripheral VF test points (Figure 4C). The MCV recorded in response to blue light in this patient was similar to or higher than the mean of controls in all VF test points (Figure 4E). In 8% of the VF test points, LMCV in response to blue light was shorter by >2 SEs compared with controls; most of these targets were located at the peripheral VF (Figure 4G).
Discussion
To the best of our knowledge, this study characterized for the first time the pupillary responses to chromatic light stimuli in BVMD patients. BVMD patients presented aberrant pupillary responses characterized by reduced PPC and MCV in response to focal red and blue light stimuli, with a more substantial defect in response to red than blue light. Studies by our group and by others suggested that the transient pupillary responses to red light is mainly mediated by cones (mostly L-cones), whereas the transient pupillary responses to low-intensity blue light are mainly mediated by rods.10,15–17 Hence, our findings suggest that the cones are more affected in BVMD patients than the rods. These data are in agreement with the findings of Campos et al that demonstrated a gradual reduction in cone function in BVMD patients as the disease progresses,18 as well as with the findings of Scholl et al who documented aberrant L- and M-cone ERG responses in BVMD patients.19 Nevertheless, since the blue light in our study was presented at an intensity of 400 cd/m2, we cannot exclude the possibility that some of the pupillary responses to blue light, especially in central test points, were mediated by M- and S-cones. The transient characteristics of the pupillary responses exclude the possibility of melanopsin-mediated pupil response.20 Surprisingly, BVMD patients presented shorter LMCV as compared with controls. Scholl et al demonstrated significantly phase-advanced cone-driven ERG responses in BVMD patients,19 in accordance with our findings of faster pupillary responses in BVMD patients. Furthermore, faster ERG responses are recorded using incremental light intensities,21 which may suggest that loss of pigment and RPE cells in BVMD may allow more light to reach the photoreceptors which may induce faster responses to relatively increase the sensation of light. Specifically, measurement of LMCV in a test point at the center of the VF (which correlates with the primary location of BVMD pathology) demonstrated high sensitivity and specificity in discriminating between BVMD patients and controls.
We have previously demonstrated that retinitis pigmentosa patients presented a more significantly reduced pupillary response to blue light than to red light stimuli, with longer than normal LMCV and higher mean absolute deviation in LMCV between different VF test points compared with controls.10 In the present study, BVMD patients demonstrated substantially different pupillary responses, with a more diminished PPC and MCV in response to red light than the blue light and shorter than normal LMCV with a low mean absolute deviation between different VF test points. Our study suggests that the pupillary response to chromatic focal light stimulus may be used as a novel biomarker for differential diagnosis of peripheral and central retinal degeneration pathologies.
The findings that the mean MCV in response to red light correlated with the Humphrey perimetry MD score and BCVA suggest that chromatic pupilloperimetry may present a novel objective biomarker for visual function in these patients. Our study is limited by the small number of patients. Future studies with larger cohorts are required to validate the presented findings. The data demonstrating higher PPC values in central VF targets in response to red light compared with peripheral VF test targets are in accordance with our previous study,10 as well as with the physiological studies by Curcio et al who demonstrated higher concentration of cones at the fovea.22
In future studies, the specificity and sensitivity of pupilloperimetry testing will be assessed in larger cohorts of retinal and macular degeneration patients, including the more prevalent age-related macular degeneration patients. Future longitudinal studies that will include imaging analysis (eg, FAF and OCT) will enable to determine the feasibility of using chromatic pupilloperimetry for monitoring BVMD disease progression and the correlation with structural changes.
Conclusion
Comprehensive analysis of pupil response to focal light stimuli presented at different wavelengths at different locations of the VF demonstrates abnormal pupil responses which correlate with BCVA and Humphrey MD score in BVMD patients.
Data sharing statement
The authors confirm that the pupilloperimetry and visual acuity data supporting the findings of this study are available within the article and its supplementary materials. The Humphrey perimetry data of all patients are available from YR ([email protected]) upon reasonable request up to 5 years from the publication date.
Acknowledgments
This paper was presented at the SPIE Photonics West Biomedical Optics (BiOS) 2017 conference (San Francisco, CA, USA; Jan 28-Feb 2, 2017) as a conference talk with interim findings and the talk’s abstract has been published in “Presentation Abstracts” in the SPIE BiOS Proceedings Volume 10045, Ophthalmic Technologies XXVII; 100451L.23
The research was supported by Accutome, Inc. (Malvern, PA, USA). Accutome Inc. staff participated in review of the manuscript, but had no role in the design or conduct of this research.
Disclosure
YR discloses United States patents US 9655509 (System And Method For Objective Chromatic Perimetry Analysis Using Pupillometer) and US 9986907 (System And Method For Objective Chromatic Perimetry Analysis Using Pupillometer). YR and IS disclose United States patent US 20190008381 (System and Method for Performing Objective Perimetry and Diagnosis of Patients with Retinitis Pigmentosa and Other Ocular Diseases). The authors report no other conflicts of interest in this work.
References
Boon CJ, Klevering BJ, Leroy BP, Hoyng CB, Keunen JE, den Hollander AI. The spectrum of ocular phenotypes caused by mutations in the BEST1 gene. Prog Retin Eye Res. 2009;28(3):187–205. | ||
Marmorstein AD, Marmorstein LY, Rayborn M, Wang X, Hollyfield JG, Petrukhin K. Bestrophin, the product of the Best vitelliform macular dystrophy gene (VMD2), localizes to the basolateral plasma membrane of the retinal pigment epithelium. Proc Natl Acad Sci U S A. 2000;97(23):12758–12763. | ||
Bakall B, Radu RA, Stanton JB, et al. Enhanced accumulation of A2E in individuals homozygous or heterozygous for mutations in BEST1 (VMD2). Exp Eye Res. 2007;85(1):34–43. | ||
Kay CN, Abramoff MD, Mullins RF, et al. Three-dimensional distribution of the vitelliform lesion, photoreceptors, and retinal pigment epithelium in the macula of patients with Best vitelliform macular dystrophy. Arch Ophthalmol. 2012;130(3):357–364. | ||
Renner AB, Tillack H, Kraus H, et al. Morphology and functional characteristics in adult vitelliform macular dystrophy. Retina. 2004;24(6):929–939. | ||
François J, De Rouck A, Fernandez-Sasso D. Electro-oculography in vitelliform degeneration of the macula. Arch Ophthalmol. 1967;77(6):726–733. | ||
Cross HE, Bard L. Electro-oculography in Best’s macular dystrophy. Am J Ophthalmol. 1974;77(1):46–50. | ||
Parodi MB, Iacono P, Campa C, Del Turco C, Bandello F. Fundus autofluorescence patterns in Best vitelliform macular dystrophy. Am J Ophthalmol. 2014;158(5):1086–1092. | ||
Duncker T, Greenberg JP, Ramachandran R, et al. Quantitative fundus autofluorescence and optical coherence tomography in Best vitelliform macular dystrophy. Invest Ophthalmol Vis Sci. 2014;55(3):1471–1482. | ||
Chibel R, Sher I, Ben Ner D, et al. Chromatic multifocal pupillometer for objective perimetry and diagnosis of patients with retinitis pigmentosa. Ophthalmology. 2016;123(9):1898–1911. | ||
Skaat A, Sher I, Kolker A, et al. Pupillometer-based objective chromatic perimetry in normal eyes and patients with retinal photoreceptor dystrophies. Invest Ophthalmol Vis Sci. 2013;54(4):2761–2770. | ||
Rothman KJ. No adjustments are needed for multiple comparisons. Epidemiology. 1990;1(1):43–46. | ||
Perneger TV. What’s wrong with Bonferroni adjustments. BMJ. 1998;316(7139):1236–1238. | ||
Armstrong RA. When to use the Bonferroni correction. Ophthalmic Physiol Opt. 2014;34(5):502–508. | ||
Kardon R, Anderson SC, Damarjian TG, Grace EM, Stone E, Kawasaki A. Chromatic pupillometry in patients with retinitis pigmentosa. Ophthalmology. 2011;118(2):376–381. | ||
Kawasaki A, Crippa SV, Kardon R, Leon L, Hamel C. Characterization of pupil responses to blue and red light stimuli in autosomal dominant retinitis pigmentosa due to NR2E3 mutation. Invest Ophthalmol Vis Sci. 2012;53(9):5562–5569. | ||
Kawasaki A, Munier FL, Leon L, Kardon RH. Pupillometric quantification of residual rod and cone activity in leber congenital amaurosis. Arch Ophthalmol. 2012;130(6):798–800. | ||
Campos SH, Forjaz V, Kozak LR, Silva E, Castelo-Branco M. Quantitative phenotyping of chromatic dysfunction in Best macular dystrophy. Arch Ophthalmol. 2005;123(7):944–949. | ||
Scholl HP, Kremers J, Apfelstedt-Sylla E, Zrenner E. L- and M-cone driven ERGs are differently altered in Best’s macular dystrophy. Vision Res. 2000;40(22):3159–3168. | ||
Kardon R, Anderson SC, Damarjian TG, Grace EM, Stone E, Kawasaki A. Chromatic pupil responses: preferential activation of the melanopsin-mediated versus outer photoreceptor-mediated pupil light reflex. Ophthalmology. 2009;116(8):1564–1573. | ||
Perlman I. The electroretinogram: ERG by IDO Perlman. Available from: https://webvision.med.utah.edu/book/electrophysiology/the-electroretinogram-erg/. Accessed October 17, 2018. | ||
Curcio CA, Sloan KR, Kalina RE, Hendrickson AE. Human photoreceptor topography. J Comp Neurol. 1990;292(4):497–523. | ||
Rotenstreich Y, Ben-Ner D, Chibel R, Mahajna MO, Sher I. Chromatic multifocal pupillometry for objective perimetry in patients with Best’s vitelliform macular dystrophy (Conference Presentation); 2017. Available from: https://www.spiedigitallibrary.org/conference-proceedings-of-spie/10045/1/Chromatic-multifocal-pupillometry-for-objective-perimetry-in-patients-with-Bests/10.1117/12.2251486.short?SSO=1. Accessed January 30, 2019. |
 © 2019 The Author(s). This work is published and licensed by Dove Medical Press Limited. The
full terms of this license are available at https://www.dovepress.com/terms
and incorporate the Creative Commons Attribution
- Non Commercial (unported, 3.0) License.
By accessing the work you hereby accept the Terms. Non-commercial uses of the work are permitted
without any further permission from Dove Medical Press Limited, provided the work is properly
attributed. For permission for commercial use of this work, please see paragraphs 4.2 and 5 of our Terms.
© 2019 The Author(s). This work is published and licensed by Dove Medical Press Limited. The
full terms of this license are available at https://www.dovepress.com/terms
and incorporate the Creative Commons Attribution
- Non Commercial (unported, 3.0) License.
By accessing the work you hereby accept the Terms. Non-commercial uses of the work are permitted
without any further permission from Dove Medical Press Limited, provided the work is properly
attributed. For permission for commercial use of this work, please see paragraphs 4.2 and 5 of our Terms.