Back to Journals » Clinical Ophthalmology » Volume 8
Choroidal thickness in patients with diabetic retinopathy
Authors Ünsal E, Eltutar K, Zirtiloğlu S, Dinçer N, Erkul S, Güngel H
Received 18 December 2013
Accepted for publication 15 January 2014
Published 27 March 2014 Volume 2014:8 Pages 637—642
DOI https://doi.org/10.2147/OPTH.S59395
Checked for plagiarism Yes
Review by Single anonymous peer review
Peer reviewer comments 3
Erkan Ünsal, Kadir Eltutar, Sibel Zirtiloğlu, Nurhan Dinçer, Sezin Özdoğan Erkul, Hülya Güngel
Department of Ophthalmology, Istanbul Education and Research Hospital, Istanbul, Turkey
Purpose: The aim of the study reported here was to assess choroidal thickness (CT) and central macular thickness (CMT) in patients with diabetic retinopathy.
Materials and methods: A total of 151 eyes from 80 patients from the retina department of Istanbul Training and Research Hospital who had type 2 diabetes mellitus with diabetic retinopathy were studied retrospectively in this cross-sectional research. Patients were divided into three groups: mild–moderate nonproliferative diabetic retinopathy without macular edema (NPDR), mild–moderate nonproliferative diabetic retinopathy with macular edema (DME), and proliferative diabetic retinopathy (PDR). In addition, 40 eyes of 20 healthy individuals comprised a control group. Choroidal thickness was measured from the posterior edge of the retinal pigment epithelium to the choroid/sclera junction at 500-µm intervals up to 1,500 µm temporal and nasal to the fovea. The CMT measurement was obtained for each eye. Serum hemoglobin A1c (HbA1c) levels were measured.
Results: The study included 191 eyes, comprising 151 eyes of 80 patients and 40 eyes of 20 healthy individuals. Of the 151 patient eyes, 61 had NPDR, 62 had PDR, and 28 eyes had DME. There was no statistically significant difference in age between the groups (P>0.05). In both the PDR and DME groups, the CT was statistically significantly decreased compared with the control group (P<0.001, P<0.001 for the PDR and DME groups, respectively). The mean CMT in the DME group was increased significantly compared with both the NPDR and PDR groups (P<0.001, P<0.001, respectively). In all three groups, serum HbA1c levels were found to be increased significantly compared with the control group (P=0.000). We found a statistically weak–moderate negative correlation between central macular and foveal CT (r=-289, P=0.000). There was a statistically strong correlation between CMT and HbA1c levels (r=0.577, P=0.483) and a statistically weak–moderate negative correlation between the central CT and HbA1c levels (r=-0.331, P<0.001).
Conclusion: Diabetes changes the CT. CT was found to be significantly decreased in the DME and PDR groups.
Keywords: choroidal thickness, diabetic retinopathy, optical coherence tomography
A Letter to the Editor has been received and published for this article.
Introduction
A healthy choroid is essential for retinal function. Until recently, the choroid could only be evaluated by indocyanine green angiography, laser flowmetry, and ultrasonography. However, these techniques are only able to show us choroidal vessel abnormalities and blood flow changes; they cannot show the three-dimensional anatomy of choroid layers or the retinal pigment epithelium. Optical coherence tomography (OCT) is a noninvasive imaging modality, which is used in acquiring high-resolution sections of retina. Recently, enhanced depth imaging (EDI) spectral-domain OCT has been described. EDI software automatically captures a cross-sectional image with the choroid close to the zero delay line to maximize sensitivity on the outer limit of the choroid.1,2
Diabetic patients have many pathological changes in their choroid. These changes are increased tortuosity and focal vascular dilatation, micro aneurysms, and non-perfusion areas. Recent studies have analyzed choroidal structure and histopathological changes in diabetes using spectral-domain OCT. The reason for inadequate choroidal imaging in the past was that the beam passed inadequately through the retinal pigment epithelium. Now, this enhanced software makes it possible to capture an image that includes the sclera.1
In our study, our aim was to assess choroidal thickness (CT) and central macular thickness (CMT) using OCT in patients with nonproliferative diabetic retinopathy (NPDR), proliferative diabetic retinopathy (PDR), and diabetic macular edema (DME). Diabetic retinopathy is the main cause of vision loss worldwide.3 PDR and DME are usually responsible for this visual loss. In diabetic retinopathy, many histopathological disorders of choroidal circulation are seen.4 This circulatory defect may be seen by indocyanine green angiography as a filling defect or filling delay in choriocapillaries.5
Materials and methods
Between January 1 and July 1, 2013, 151 eyes of 80 type 2 diabetic patients with a diagnosis of diabetic retinopathy in our retina department were included in our retrospective and cross-sectional study. The control group comprised 20 healthy individuals (40 eyes) of similar age to those in the study groups, with normal visual acuity and no retinal or choroidal pathology.
Diabetic patients were divided into three groups according to the criteria of the Early Treatment Diabetic Retinopathy Study:6 the NPDR group comprised patients with mild–moderate nonproliferative diabetic retinopathy without macular edema (n=61); patients with mild–moderate nonproliferative diabetic retinopathy with macular edema comprised the DME group (n=28), and patients in the PDR group had PDR (n=62). In our study, we included DME cases that had no signs of PDR, retinal thickening with two disc area or larger that included the center of the macula, and CMT of >300 μm as determined by OCT.
Informed consent was obtained from every patient and the study was performed according to the Declaration of Helsinki. Approval of the Clinical Trials Ethics Commitee of Istanbul Training and Reserch Hospital was granted.
On each patient’s first visit, a detailed systemic and ophthalmological medical history was taken, visual acuity was measured using a Snellen chart, a slit-lamp examination was performed, intraocular pressure was measured with Goldmann applanation tonometry, and a dilated fundus examination with a 90D lens was undertaken.
Patients in the PDR group were chosen from those with a history of pan-retinal laser photocoagulation (PRP) with no active neovascularization. The time between PRP and CT measurement was ignored. The arterial blood pressure of all patients was measured. Patients with systemic arterial hypertension and unregulated arterial blood pressure despite medication, corneal or vitreal opacity, hyperopia of +3 diopters (D) or more, myopia of −6 D or more, age-related macular degeneration, and/or having had any eye surgery except for cataract were excluded.
OCT measurement of all patients was performed using the same OCT device, an Optovue RTVue 100-2 (Optovue, Fremont, CA, USA) by the same person with the chorioretinal line mode (v 5.1) after pupillary mydriasis (>5 mm). Images of low quality necessitated re-measurement. To determine the reliability of the measurements, we included only measurements that had a reliability index of 60 or higher, which is specified by the manufacturer of the OCT device. Those measurements were considered reliable. Any patient whose measurement reliability index was under 60 was excluded from the study.
A fovea-centered 3 mm horizontal line was used in our choroidal evaluation. Measurement was performed perpendicularly from the outer part of the hyper-reflective line (retinal pigment epithelial layer) to the line corresponding to the choroidal-scleral junction, perpendicularly. Sub-foveal CT (M) and CTs at temporal distances from the central fovea of 500 μm (T500), 1,000 μm (T1000), 1,500 μm (T1500), and nasal distances of 500 μm (N500), 1,000 μm (N1000), and 1,500 μm (N1500) were measured. In addition, the CMT measurement was obtained for each eye. Serum hemoglobin A1c (HbA1c) levels were also measured.
Statistical evaluation
The CT and CMT of the control and patient groups were compared with OCT measurements in seven different localizations. Independent groups were compared using the independent-samples t-test. Pearson’s correlation analysis was used to compare CMT and foveal CT, CMT and HbA1c levels.
All statistical analyses were done using IBM SPSS Statistics (v 15.0, IBM Corporation, Chicago, IL, USA). P-values of <0.05 were accepted as being statistically significant.
Results
A total of 191 eyes of 100 individuals were included in the study. Of these, 151 eyes were of 39 male (48.8%) and 41 female (51.2%) patients with type 2 diabetes mellitus, and 40 eyes were of nine female (45%) and eleven male (55%) healthy individuals. A total of 61 eyes had NPDR, 62 had PDR, and 28 had DME. The mean age of the patients was 60.5±8.2 years (Table 1).
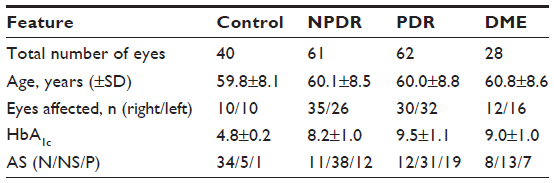 | Table 1 Patient characteristics by group |
Regarding CT, there was no statistically significant difference between the control group and NPDR group (P>0.05), except in terms of T500 (P=0.022). In both the PDR and DME groups, the CT was decreased statistically significantly compared with the control group (P<0.001, P<0.001 for the PDR and DME groups, respectively; Table 2). The mean CT at each location was plotted (Figure 1).
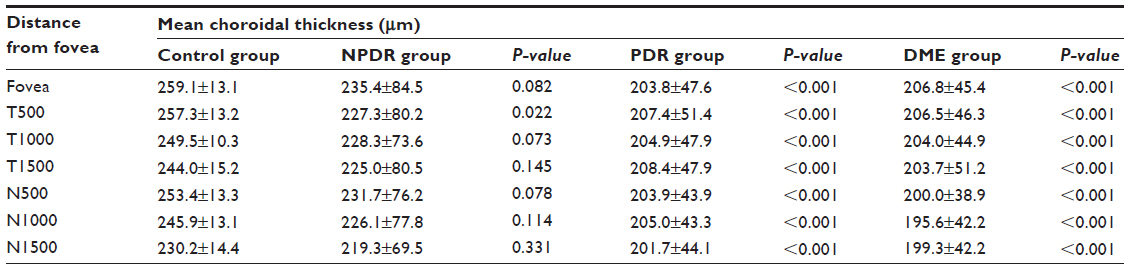 | Table 2 The choroidal thickness in healthy individuals and diabetic patient groups in seven different locations |
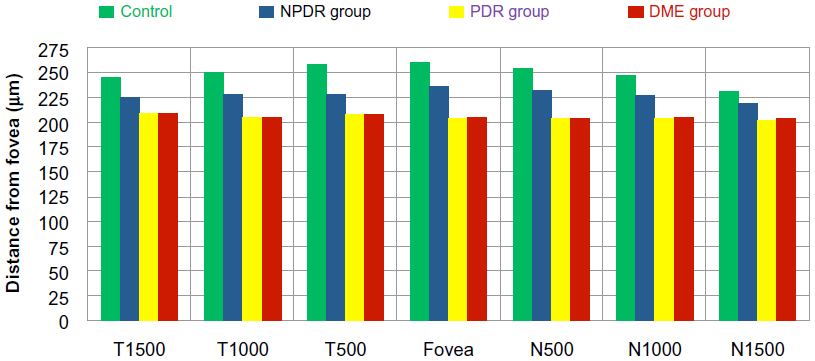 | Figure 1 Mean choroidal thicknesses in all study groups (μm). |
Regarding CT, there was no statistically significant difference between the NPDR and DME group in terms of any measurement distance from the choroidal quadrants (P>0.05), except for N500 (P=0.041). In addition, there was no statistically significant difference between the PDR and DME groups (P>0.05; Table 2). Representative images of patients in the different groups are shown in Figure 2.
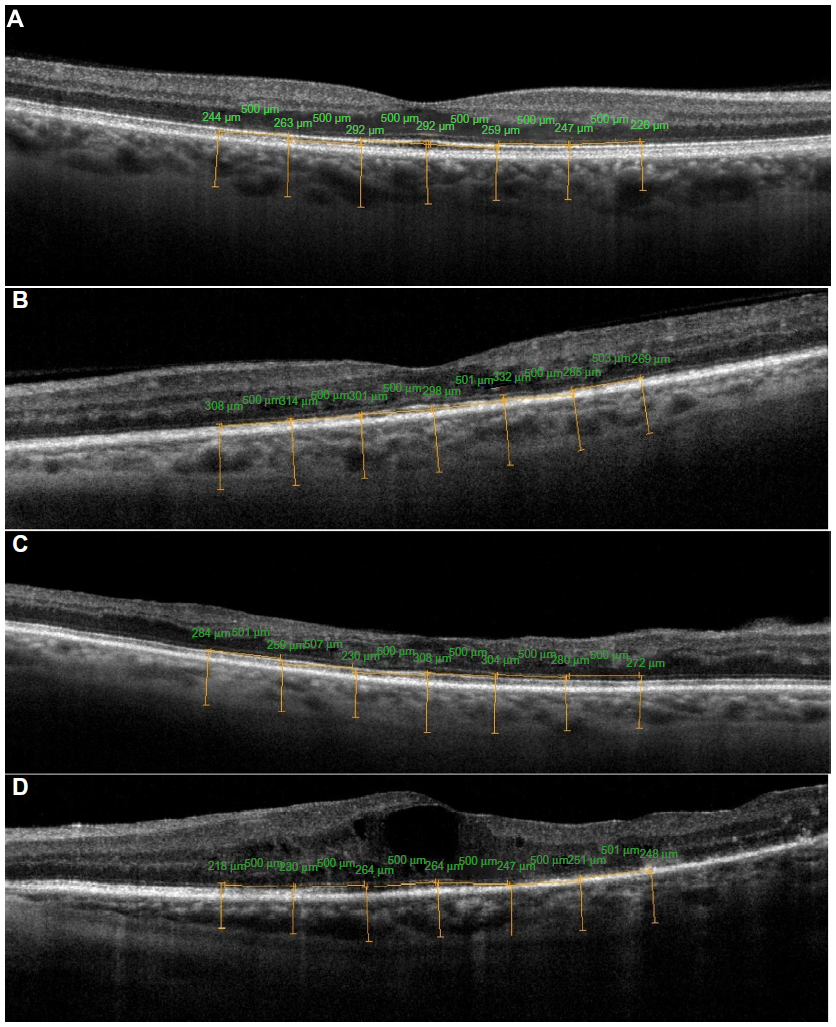 | Figure 2 Representative images of (A) the eye of the control patient; (B) the eye of a patient with mild nonproliferative diabetic retinopathy; (C) a patient with moderate nonproliferative diabetic retinopathy and diabetic macular edema; and (D) a patient with treated proliferative diabetic retinopathy – note that in this patient there is a disruption in the photoreceptor inner/outer segment junction, probably because of the retinal ischemia. |
In all groups, the thickest choroid was in the sub-foveal area. The CT decreased from the sub-foveal area to the nasal and temporal choroid; in particular, the nasal CT was thinner (Table 2).
The mean CMT was 168.8±9.5 standard deviation (SD) in the control group, 253.0±48.2 SD in the NPDR group, 256.3±40.0 SD in the PDR group, and 371.4±86.7 SD in the DME group (Figure 3). The mean CMT was increased statistically significantly in patients from all three groups compared with in those from the control group (P<0.001). The mean CMT in the DME group was increased significantly compared with both the NPDR and PDR groups (P<0.001, P<0.001, respectively). Regarding CMT, there was no statistically significant difference between the NPDR and PDR groups (P=0.76).
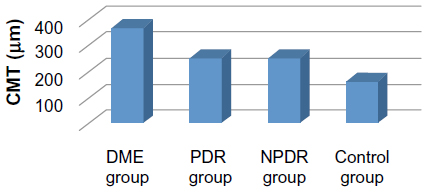 | Figure 3 Central macular thicknesses (CMTs) of patients (μm). |
hemoglobin A1c (HbA1c) levels were 4.8±0.2 SD in the control group, 8.2±1.0 SD in the NPDR group, 9.5±1.1 SD in the PDR group, and 9.0±1.0 SD in the DME group (Figure 4). In all three groups, serum HbA1c levels were found to be significantly increased compared with in the control group (P<0.001).
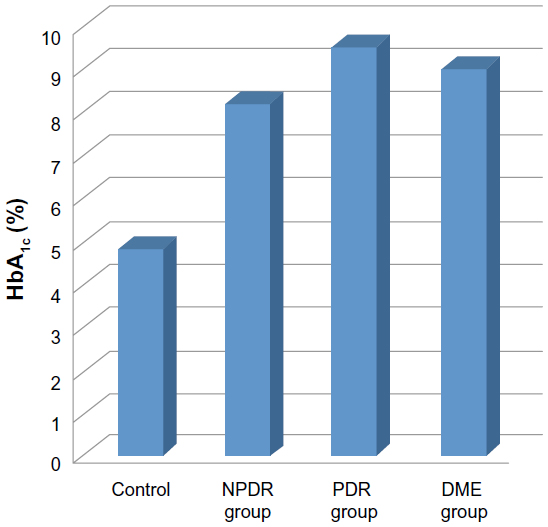 | Figure 4 Mean HbA1c values. |
We found a statistically weak–moderate negative correlation between central macular and foveal CT (r=−289, P<0.001). There was a statistically strong correlation between CMT and HbA1c levels (r=0.577, P=0.483) and there was a statistically weak–moderate negative correlation between the central CT and HbA1c levels (r=−0.331, P<0.001).
Discussion
In this study, we aimed to compare the CT in patients with NPDR, PDR, and DME. We found that CT decreases as the disease progresses from mild–moderate NPDR to PDR. This shows us the relation between the severity of irregularities in plasma glucose levels and CT in diabetes mellitus.
Regatieri et al compared NPDR, PDR, and DME patients with healthy controls using a Cirrus™ HD-OCT (Carl Zeiss Meditec, Dublin, CA, USA) and reported no significant difference between the NPDR and control groups, but that the CT was decreased in the PDR and DME groups.7
In the study by Kim et al, CT was found to be significantly increased as the disease progressed in severity from moderate–severe NPDR to untreated PDR.8 However, the choroid of PDR patients who had had PRP treatment was thinner than that of PDR patients who had not had any laser therapy. The sub-foveal choroid in DME-group eyes was significantly thicker than in non-DME eyes.8 In our study, we included PDR patients who had received PRP treatment. In this group, we found the CT was decreased significantly. However, in our study, the CT of patients with diabetic macular edema was significantly thinner than that of non-DME patients. This contradiction can be explained by different patient profiles. In our study, all patients had advanced retinopathy and had all been treated by PRP therapy.
In a prospective study, Cho et al investigated 28 eyes with severe NPDR or PDR, and found that the CT and CMT increased significantly after three sessions of PRP. CT and CMT were measured before PRP and 1 week after three sessions of PRP with OCT.9 The authors suggested that the reason for this thickening is the shifting of blood flow from the peripheral retina to the foveal area secondary to PRP. However, in our study, CT was decreased in the PDR group. Patients in the PDR group had their laser treatment completed 3 months before the study. Thus, Cho et al probably found CT was increased because they measured it 1 week after PRP treatment, increased blood flow, vasodilation and consequently effusion in the retina and choroid.
In our study, as in other studies, CT was thickest in the sub-foveal area and got thinner towards the nasal or temporal area.7,8,10,11
Spaide has reported that CT decreases with age.12 We included patients of similar age, so the age factor was eliminated.
In our study, CT in the PDR and DME groups was significantly thinner than in the control group. Decreased CT can indicate that treated PDR and DME patients may have decreased choroidal blood flow. Earlier studies with laser Doppler flowmetry in NPDR patients have shown a reduction in choroidal blood flow and selective filling of the choriocapillaris during indocyanine green angiography.5,13 So, decreased CT can be related to hypoxia of the retinal tissue. It is unclear whether underlying ischemia of the retina is primary or secondary to another process.
Nagaoka et al showed that NPDR patients with DME have a reduction in choroidal circulation compared with NPDR patients without DME. They presumed this decreased circulation could be secondary to retinal hypoxia because of the inadequate blood flow, and that this could cause the macular edema.14
In our study, CT was found to decrease along with progression of the retinopathy. However, in the DME group, the decreased CT may be false due to inhibition of the signal transduction and reflection from the choroid secondary to increased ocular opacity as a result of macular edema.
This retrospective study has some limitations. Untreated PDR patients were excluded from the study, so it is possible that our results might be affected by changing CT measurements resulting from laser photocoagulation. Further, in our study, the time between the PRP treatment and when the CT measurements were taken was ignored. Axial length, which was also not evaluated, affects CT values. In future studies, the relationship between CT and choroidal blood circulation in patients with diabetic retinopathy can be analyzed by using spectral-domain OCT.
Spectral-domain OCT is a successful noninvasive device with which to evaluate the choroid. Especially in diabetic retinopathy, it can be a useful device to evaluate blood flow changes in the choroid. To understand the role of the choroid in diabetic retinopathy and its pathophysiology, more prospective studies should be done.
Disclosure
The authors declare no conflicts of interest in this work.
References
Spaide RF, Koizumi H, Pozzoni MC. Enhanced depth imaging spectral-domain optical coherence tomography. Am J Ophthalmol. 2008;146(4):496–500. | |
Coscas G, Zhou Q, Coscas F, et al. Choroid thickness measurement with RTVue optical coherence tomography in emmetropic eyes, mildly myopic eyes, and highly myopic eyes. Eur J Ophthalmol. 2012;22(6):992–1000. | |
Kempen J, O’Colmain B, Leske M, et al. The prevalence of diabetic retinopathy among adults in the United States. Arch Ophthalmol. 2004;122:552–563. | |
Freyler H, Prskavec F, Stelzer N. [Diabetic choroidopathy – a retrospective fluorescein angiography study. Preliminary report]. Klin Monbl Augenheilkd. 1986;189(2):144–147. German. | |
Weinberger D, Kramer M, Priel E, Gaton DD, Axer-Siegel R, Yassur Y. Indocyanine green angiographic findings in nonproliferative diabetic retinopathy. Am J Ophthalmol. 1998;126(2):238–247. | |
Gardner TW, Sander B, Larsen ML, et al. An extension of the Early Treatment Diabetic Retinopathy Study (ETDRS) system for grading of diabetic macular edema in the Astemizole Retinopathy Trial. Curr Eye Res. 2006;31(6):535–547. | |
Regatieri CV, Branchini L, Carmody J, Fujimoto JG, Duker JS. Choroidal thickness in patients with diabetic retinopathy analyzed by spectral-domain optical coherence tomography. Retina. 2012;32(3):563–568. | |
Kim JT, Lee DH, Joe SG, Kim JG, Yoon YH. Changes in choroidal thickness in relation to the severity of retinopathy and macular edema in type 2 diabetic patients. Invest Ophthalmol Vis Sci. 2013;54(5):3378–3384. | |
Cho GE, Cho HY, Kim YT. Change in subfoveal choroidal thickness after argon laser panretinal photocoagulation. Int J Ophthalmol. 2013;6(4):505–509. | |
Manjunath V, Taha M, Fujimoto JG, Duker JS. Choroidal thickness in normal eyes measured using Cirrus HD optical coherence tomography. Am J Ophthalmol. 2010;150(3):325–329. | |
Ikuno Y, Kawaguchi K, Nouchi T, Yasuno Y. Choroidal thickness in healthy Japanese subjects. Invest Ophthalmol Vis Sci. 2010;51:2173–2176. | |
Spaide RF. Age-related choroidal atrophy. Am J Ophthalmol. 2009; 147(5):801–810. | |
Schocket LS, Brucker AJ, Niknam RM, Grunwald JE, DuPont J, Brucker AJ. Foveolar choroidal hemodynamics in proliferative diabetic retinopathy. Int Ophthalmol. 2004;25(2):89–94. | |
Nagaoka T, Kitaya N, Sugawara R, et al. Alteration of choroidal circulation in the foveal region in patients with type 2 diabetes. Br J Ophthalmol. 2004;88(8):1060–1063. |
 © 2014 The Author(s). This work is published and licensed by Dove Medical Press Limited. The
full terms of this license are available at https://www.dovepress.com/terms
and incorporate the Creative Commons Attribution
- Non Commercial (unported, 3.0) License.
By accessing the work you hereby accept the Terms. Non-commercial uses of the work are permitted
without any further permission from Dove Medical Press Limited, provided the work is properly
attributed. For permission for commercial use of this work, please see paragraphs 4.2 and 5 of our Terms.
© 2014 The Author(s). This work is published and licensed by Dove Medical Press Limited. The
full terms of this license are available at https://www.dovepress.com/terms
and incorporate the Creative Commons Attribution
- Non Commercial (unported, 3.0) License.
By accessing the work you hereby accept the Terms. Non-commercial uses of the work are permitted
without any further permission from Dove Medical Press Limited, provided the work is properly
attributed. For permission for commercial use of this work, please see paragraphs 4.2 and 5 of our Terms.