Back to Journals » Clinical Ophthalmology » Volume 14
Choroidal Thickness and microRNA146 in Lupus Nephritis Patients
Authors Hassan Salah S ![]() , Makled HS
, Makled HS ![]() , ElMekawey H
, ElMekawey H ![]() , Elgengehy FT
, Elgengehy FT ![]() , Medhat BM
, Medhat BM ![]() , Abdel Baki NM
, Abdel Baki NM ![]() , Koptan D
, Koptan D ![]()
Received 17 March 2020
Accepted for publication 11 May 2020
Published 2 June 2020 Volume 2020:14 Pages 1503—1510
DOI https://doi.org/10.2147/OPTH.S254288
Checked for plagiarism Yes
Review by Single anonymous peer review
Peer reviewer comments 2
Editor who approved publication: Dr Scott Fraser
Shaymaa Hassan Salah, 1 Hebatalla Samir Makled, 1 Hany ElMekawey, 1 Fatema T Elgengehy, 2 Basma M Medhat, 2 Noha M Abdel Baki, 2 Dina Koptan 3
1Ophthalmology Department, Kasr Alainy, Cairo University, Cairo, Egypt; 2Rheumatology and Rehabilitation, Kasr Alainy, Cairo University, Cairo, Egypt; 3Clinical Pathology, Kasr Alainy, Cairo University, Cairo, Egypt
Correspondence: Shaymaa Hassan Salah
Kasr Alainy Hospital, 1 Saray Al-Manial, Cairo 11559, Egypt
Tel +201002229645
Fax +20223636504
Email [email protected]
Purpose: To evaluate the choroidal thickness (CT) in the macular area in patients with lupus nephritis and to compare the results with both non-nephritic patients and normal control. To assess the relation of CT to serum microRNA146, disease duration, activity index, and medications.
Patients and Methods: Thirty-five SLE patients and thirty normal healthy controls were enrolled for this cross-sectional prospective study. All participants have undergone optical coherence tomography using RTVue OCT (Optovue Inc., Fremont, CA, USA). The scan used was the macular cross 6-mm line. We measured CT from the posterior edge of the retinal pigment epithelium (RPE) to the choroid-sclera junction at subfovea, and 750 μm both temporal and nasal to the fovea.
Results: The mean central subfoveal CT in patients was 275.7 ± 41.0 μm (214– 374 μm), and the mean central subfoveal CT in the control group was 364.5± 23.0 μm (323– 411μm). There was a significant thinning at all three points in patients compared to the control group (p< 0.001, Mann–Whitney U-test). In the patients group, subfoveal choroid in non-nephritic subgroup showed significant thinning compared to nephritic subgroup (p=0.032, Mann–Whitney U-test). Drusen-like deposits (DLDs) were detected in 22.9% (8/35) of patients and none in control (p=.023). MiRNA146 showed a significant positive correlation with nephritic lupus patients (r=0.036, P=0.04).
Conclusion: The choroidal thickness was significantly thicker among the nephritic lupus patients as compared to the non-nephritic subgroup. Both SLE patients’ subgroups are thinner than normal control. Subfoveal choroidal thickening can be considered a biomarker in nephritic lupus especially in conjunction with an increase in miRNA146a. All SLE patients are at risk of small Drusen-like deposits.
Keywords: choroidal thinning, lupus nephritis, miRNA146a, SLEDI
A Letter to the Editor has been published for this article.
Introduction
Systemic lupus erythematosus (SLE) is a chronic, autoimmune connective tissue disease that presents with a myriad of clinical manifestations1 including ocular involvement; ranging from keratoconjunctivitis sicca to sight-threatening conditions as retinopathy.2 SLE can affect the vascular system in many territories including choroidal vessels either by immune complex deposition in the vessel wall and lumen inducing vasculitis or an increased atherosclerotic or thrombotic burden.3 The choroid has been shown to be affected in SLE patients in many studies.4,5 The choroid choriocapillaris and the renal glomerular capillaries have similar histology and are similarly affected by systemic diseases.3 As Lupus nephritis is a severe clinical form of SLE, choroidal thickness has been found as a tissue marker of high activity in patients with lupus nephritis.5 Choroidopathy was considered as a direct reflection of inflammatory cells deposition in choriocapillaris.3 The severity of the disease is an important key to decide and maintain a proper treatment, and so many activity indices were proposed. One of these is the SLEDAI (SLE disease activity index), that is considered an important index for disease morbidity.6 Enhanced depth imaging optical coherence tomography (EDI-OCT) is considered now the main noninvasive, rapid, objective, and reliable diagnostic technique for monitoring any choroidal changes. It allows in vivo examination and quantification of the choroid.7
The micro-ribonucleic acids (miRNAs) are nucleotides of short non-coding RNAs. They control the expression of multiple protein-encoding genes at the posttranscriptional level.8 Many studies have focused on the role of the miRNAs in various autoimmune diseases including SLE.9 SLE patients have distinct miRNA signatures in different tissues; peripheral blood mononuclear cells, plasma as well as serum.10 Among the miRNAs involved in the pathogenesis of SLE is the miRNA-146a-5p, member of the miR-146 family, that negatively regulates cytokine signaling via the NF-κB signaling pathway.11 MiRNA-146a shows a regulation of the immune response and inflammation and has been found to be essential in SLE, especially in lupus nephritis. The dysregulation of miRNAs has been associated with several ocular and systemic diseases that are characterized by alteration of the immune system, including Sjogren’s syndrome, ocular neoplasms, and uveal inflammation.12
Based on previous facts, this case–control prospective study was done to evaluate the subfoveal and parafoveal choroidal thickness, as measured by OCT, in cohort Egyptian SLE patients attending Cairo University Hospitals and to compare it to healthy controls. Correlation between ocular findings and disease activity as well as renal affection was also investigated. We also attempted to explore the potential association between changes in the choroidal thickness and serum miRNA-146a-5p among the study participants.
Patients and Methods
This study included 35 SLE patients fulfilling the SLICC (Systemic Lupus International Collaborating Clinics)13 criteria and managed at Cairo University, and 30 healthy controls. Patients with co-existing ocular diseases such as dense media opacities, ocular trauma, and/or surgery were excluded. Moreover, patients with a refractive error with a spherical equivalent > ±3 diopters (D) were also excluded. Patients with concurrent systemic diseases, including diabetes and/or hypertension, were not enrolled in the study. Complete history including the disease duration, activity score according to SLEDAI,6 and treatment doses was documented. The study was approved by the Kasr Alainy Research Ethics Committee. The committee approved a verbal informed consent process, which was obtained from all participants. The study follows the principles of the Declaration of Helsinki.
Rheumatologic Examination
In addition to demographic data, the treatment received at the time of the study was recorded. SLEDAI scores;6 document a range of a group of descriptors of activity, all evaluated by the Rheumatologist. Median SLEDAI scores ranged from 2 (inactive disease) to 8 (active disease).14 Patients group was examined on time of admission to document the score of their diseased condition.
Isolation of RNA and Real-Time Reverse Transcription-Polymerase Chain Reaction
Two-milliliter peripheral venous blood samples were withdrawn from patients and control subjects and allowed to clot then centrifuged to separate the serum which was stored at − 80°C until further processing. MiRNA was extracted from 200 µL serum samples using the miRNA easy Mini kit (Qiagen). The concentration and purity of eluted RNA were measured on a spectrophotometer (Nanodrop, Thermo Scientific). Extracted RNA was stored at −80°C till further processing. Quantification of miRNA-146a-5p was determined using two-step reverse transcription-polymerase chain reaction (RT-PCR): for miR-146a-5p complementary DNA synthesis, RNA was reverse transcribed using specific miRNA primers from the TaqMan miRNA assay and the TaqMan miRNA RT Kit. PCR products were amplified using the TaqMan miRNA Assay and the TaqMan Universal PCR Master Mix (all from Applied Biosystems) according to the manufacturer’s protocol. For normalization, Ce_miR-39_1 was used as a reference control. qPCR was performed on the step-one real-time PCR system (Applied Biosystems). Relative miR-146a-5p expression levels were calculated using the 2−ΔΔCt method as described by Schmittgen et al.15
Ophthalmological Examination
All candidates were examined for best-corrected visual acuity using the Snellen Decimal score. The results were then changed to the logarithm of the minimum angle of resolution (LogMAR). Detailed slit-lamp examination for evaluation of anterior segment was performed for each candidate. Also, posterior segment using Volk +90 D lens, as well as dilated pupil examination by indirect ophthalmoscopy was performed. Goldmann applanation tonometry was done.
Choroidal Thickness (CT) by OCT
All participants (patients and controls) had undergone OCT using RTVue OCT (Optovue Inc., Fremont, CA, USA) in Kasr Alainy diagnostic eye laser unit. In the patients group, the imaging was performed within 2–7 days of Rheumatologic examination, and blood sampling. The OCT was performed at midday (between 10 AM-12 PM). RTVue is a high-speed and high-resolution Spectral Domain OCT device with wavelength 840 nm, the scan rate of 26,000 A-scans per sec, and axial resolution of 5 µm. For this study, horizontal B-scan images centered on the fovea were used to measure CT. Each B-scan image consists of 1024 A-scans. The RTVue software provides a “Chorioretinal” imaging mode. This mode has the same value as enhanced depth imaging (EDI) described by Spaide et al16 with a slightly different approach. The scan used on the RTVue was the macular cross line that consists of 2 orthogonally oriented 6-mm lines. We chose the nasal-temporally horizontal line for measurement. The CT was measured by anterior and posterior boundaries: The posterior edge of the RPE (ie, the anterior boundary of the choroid) can be easily identified in the RTVue OCT images. The posterior boundary is the choroid-sclera junction which needs a special technique for identification due to the differences in its appearance within the population. We can use the Lamina Fusca (LF), which is a hyperreflective layer, as the natural posterior boundary of the choroid, or the outer vessel limit (OVL) if LF was not visible.17 In this study, we measured CT from the posterior edge of the retinal pigment epithelium (RPE) to the choroid-sclera junction at subfovea, and 750 µm temporal and nasal to the fovea (Figure 1). We selected those two particular points at 750 µm from the fovea to be as close to the foveal area for the best extent possible. Two operators were recruited to capture the images and measure the CT at the three loci in each eye of both groups. The recorded values were the average of the two operators who were totally blinded about the cases.
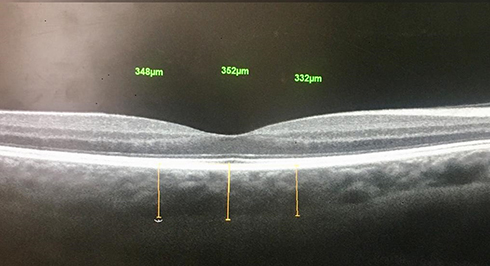 |
Figure 1 The choroidal thickness was measured at subfovea, and 750 µm temporal and 750 µm nasal to the fovea. |
Data were coded and entered using the statistical package SPSS (Statistical Package for the Social Sciences) version 25. Data were summarized using mean, standard deviation, median, minimum, and maximum in quantitative data and using frequency (count) and relative frequency (percentage) for categorical data. The Chi-square (x2) test was used to compare the prevalence of morphological changes in cases and controls. Comparisons between cases and control were done using unpaired t-test. Comparisons between quantitative variables were done using the non-parametric Mann–Whitney test. Correlations between quantitative variables were done using the Spearman correlation coefficient. ANCOVA analysis was performed to correct for an age when comparing subfoveal CT between cases and control. P-values less than 0.05 were considered as statistically significant.
Results
In this study, a total of 35 patients with SLE (20 right eyes, 15 left eyes), and 30 normal controls (15 right eyes, 15 left eyes) were examined and imaged. All participants were females. The mean age in the patients group was 31.2 ± 9.4 years (16–57 years). The mean age in the controls group was 34.3 ± 8.0 years (19–43 years).
In the patients group, the median duration of SLE was 6 years (1–15 years). The median SLEDI was 6 (0–36). The highest percentage of patients showed mild activity (n=15, 42.9%), Table 1. The patients diagnosed with lupus nephritis were 54% (19/35).
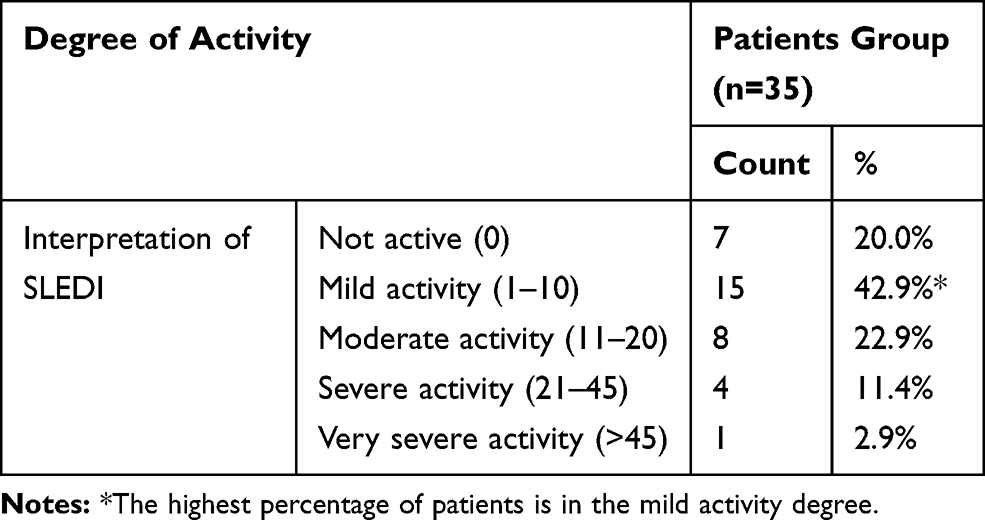 |
Table 1 Percentage of Activity of SLE According to SLEDI Scores in Patients Group |
The antimalarial drug, hydroxychloroquine (HCQ), is the main line of treatment for 91.4% of patients (32/35), the median daily dose in milligram (mg) is 400mg (200–600 mg).
The mean serum level of miRNA146 in patients group was 4.0 ± 5.1 fold change (0.4–26.7 fold change) and the mean in control group was1.54 ± 1.66 fold change (0.13–7.21 fold change) (p = 0.001)
Quantitative Data in OCT
The mean central subfoveal CT in the patients group was 275.7 ± 41.0 µm (214–374 µm).
The mean central subfoveal CT in the controls group was 364.5± 23.0 µm (323–411 µm), Figure 2, and Table 2.
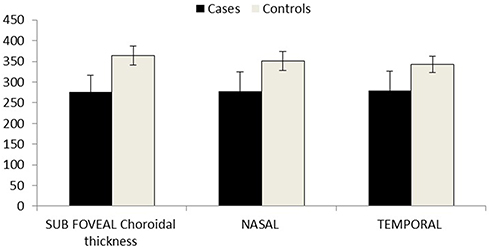 |
Figure 2 Shows the significant differences in choroidal thickness between both groups at selected loci. |
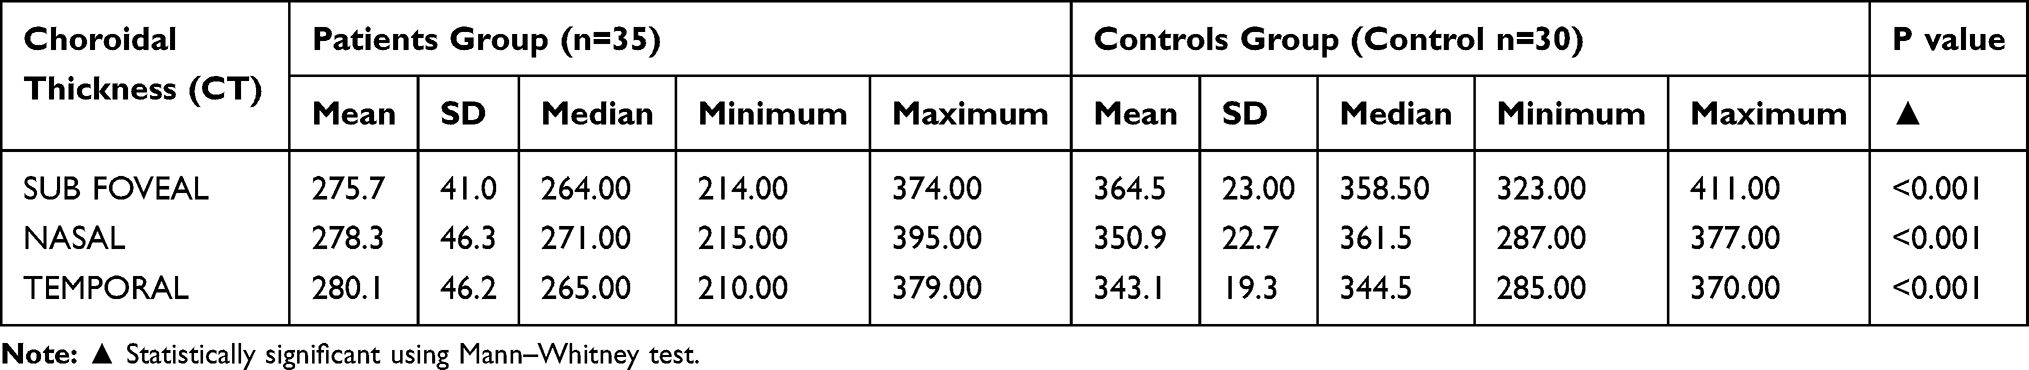 |
Table 2 Comparison Between Both Groups Regarding CT in the Three Loci in Each Eye |
In Patients Group, the mean CT in subfovea, nasal and temporal parafoveal points (750 µm from the center of fovea nasally and temporally, respectively) showed significant thinning as compared to Controls Group in the same loci, Table 2. When ANCOVA analysis was performed to correct for the age when comparing subfoveal CT, it was still significantly thinner in the patients compared to the controls, Table 3.
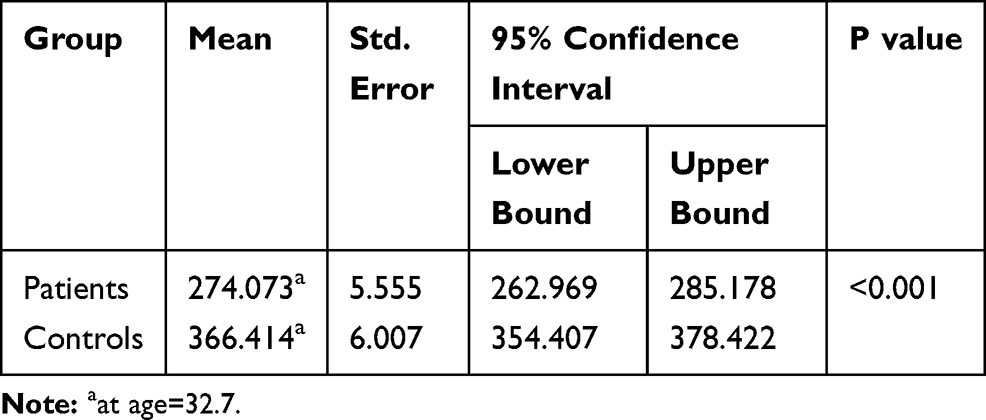 |
Table 3 Dependent Variable: Subfoveal Choroidal Thickness; Covariates Appearing in the Model are Evaluated at Age=32.7 |
In patients group; the subfoveal location only, Nephritic subgroup (19/35) showed significant thickening compared to non-nephritic subgroup (16/35) (P=0.032), Figure 3. Correlation between CT in nephritic subgroup and SLEDI in the same subgroup was positive but not significant (r=0.1663, P=0.5). Correlation between CT in nephritic subgroup and miRNA146 in the same subgroup was positive but also not significant (r=0.04, p=0.8)
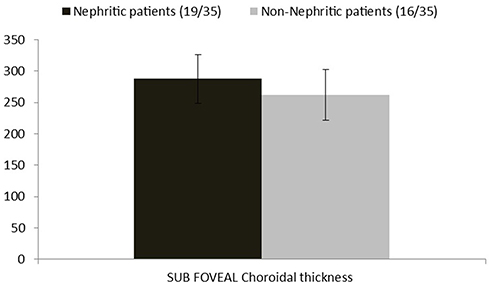 |
Figure 3 Patients group subfoveal choroidal thickness more significant in nephritic subgroup. |
Morphological Data in OCT
Drusen-like deposits (DLDs) were detected in 22.9% (8/35) of Patients Group and none in Controls Group (p=.023), Figure 4.
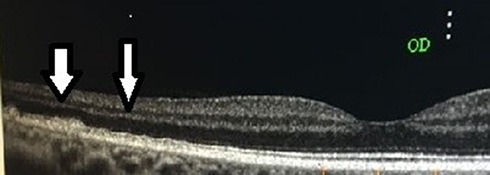 |
Figure 4 Parafoveal small DLDs (white arrows) in right eye in patients group. |
Peri-foveal inner retinal thinning (peri-foveal cupping) was detected in 11.4% (4/35) in Group1 and 3.3% (1/30) in Group2 (p=.222), Figure 5.
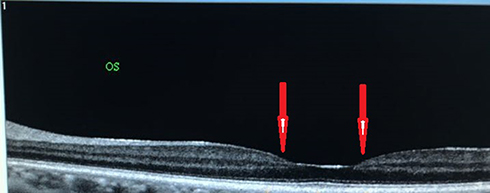 |
Figure 5 Peri foveal thinning (red arrows) in four eyes of patients in patients group. |
Drusen-like deposits (DLDs) were not significantly correlated to nephritis (r=0.09, p= 0.61). Peri-foveal inner retinal thinning was also not correlated to HCQ dose (r= −0.024, p=0.9).
No statistically significant correlation was found between (duration, lupus nephritis, SLEDI, and HCQ treatment) and CT in Group1. Age as a physiological factor affecting CT was correlated to CT at all loci, Table 4.
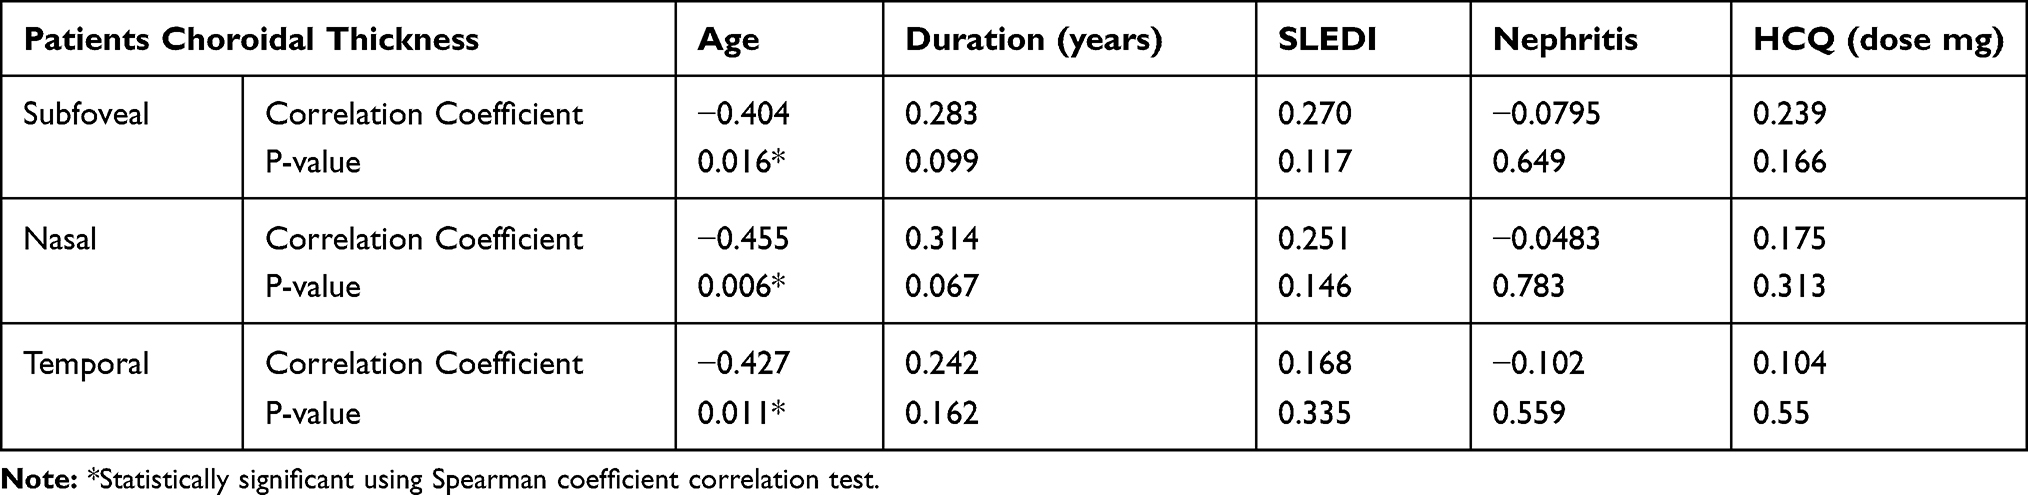 |
Table 4 Shows Correlation Between (Age, Duration, Nephritis and SLEDI, and HCQ) and CT at Selected Loci in Patients Group |
No statistically significant correlation was found between (age, CT by OCT at selected loci) and miRNA 146 in Group1. However, lupus Nephritis patients showed a statistically significant correlation with miRNA 146, Table 5.
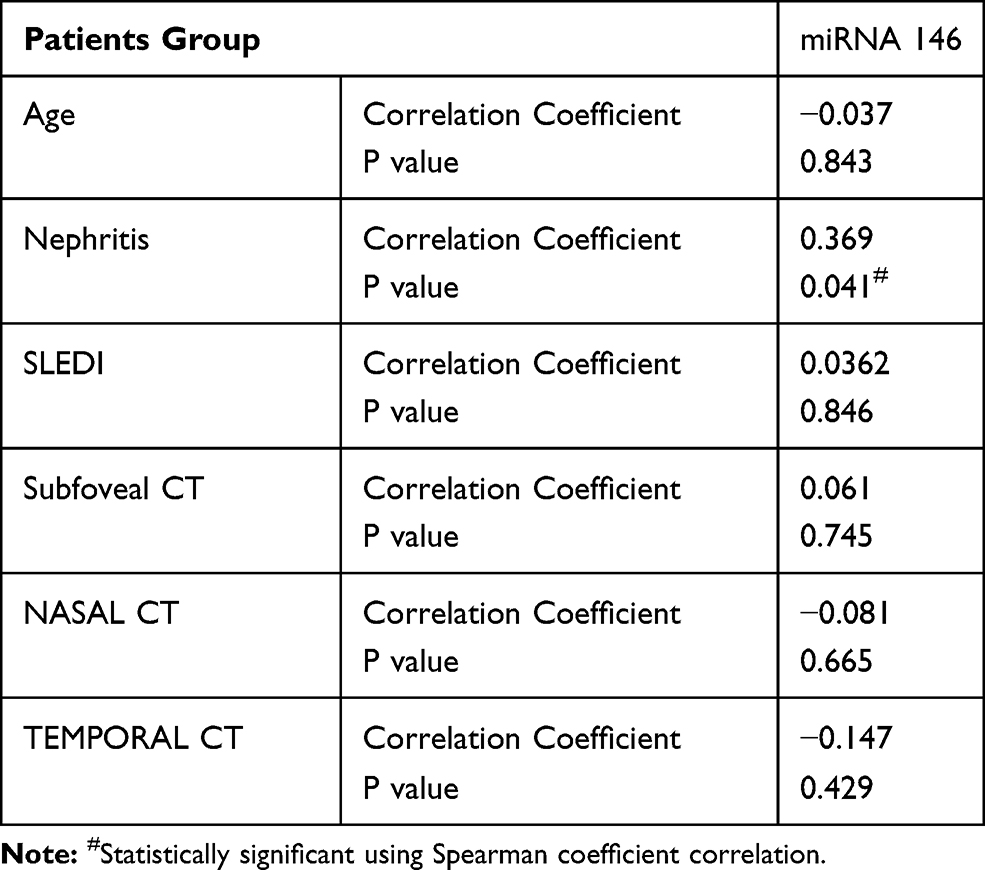 |
Table 5 Correlation Between miRNA and (CT, SLEDI and Nephritis) in Patient Group |
Discussion
Systemic Lupus Erythematosus is a multisystem chronic autoimmune disease. In women, it occurs approximately six times higher than in men.18 Interestingly, the choroidal involvement could reflect disease activity and/or morbidity in SLE;3 hence, measuring the subfoveal choroidal thickness could be of diagnostic and prognostic value. The RTVue allows non-invasive quantification of the choroidal thickness in the macular area using Chorioretinal scanning mode giving the same value as EDI. The choroidal thickness in the macular area, either with thinning or thickening; denote atrophy or activity, respectively.
In this study, the mean subfoveal CT in control (n= 30) was 364.5 ± 23.0 µm. Normal choroidal thickness has been described in a study by Margolis and Spaide using Spectralis, they reported the subfoveal choroidal thickness to be 287 ± 76 µm in 54 eyes.19 Manjunath et al using Cirrus reported a subfoveal choroidal thickness of 272 ± 81 µm in 34 eyes.20 These studies showed a different range of choroidal thinning can be attributed to using different machines, the difference in mean age, and/or ethnic variations. In a study by Branchini et al, obtained in 28 eyes of 28 healthy persons, the mean subfoveal choroidal thickness was 347.5 ± 94.4 µm by Cirrus, 347.5 ± 97.9 µm by Spectralis, and 337.7 ± 89.0 µm by RTVue.21 This was consistent with our results when corrected for age.
In this study, we evaluated the effect of SLE on the choroidal thickness (CT) by comparing patients with SLE (n=35), and control group (n=30). The CT in the subfoveal, nasal, and temporal parafoveal points, was significantly thinner in the patients group compared to controls (p<0.001). The median duration of the disease in our study was 6 years (1–15 years). Hence, choroidal thinning in the macular area of SLE patients could be explained by long duration (chronicity) causing immune and complement deposits in choroidal vessels with subsequent choroidal ischemia and atrophy.23
Interestingly, previous studies that measured CT in patients with SLE had contradictory results. In a study by Dias-Santos et al,3 68 SLE patients and 50 healthy controls were involved, measuring CT using EDI at 13 loci at subfovea and 500mirons spacing along the vertical and horizontal meridian. CT in the SLE group in their study appears to be thinner, but not statistically significant when compared to the control group.
Altinkaynak et al22 measured CT at three loci (subfoveal, 1500 microns nasal, and temporal peri-foveal) using EDI in 58 patients with inactive SLE and compared them with 58 normal controls. The mean (± SD) subfoveal, nasal, and temporal CT values for the study group were 231.2 ± 57.6 µm, 190.6 ± 30.6 µm, and 222.7 ± 37.5 µm, respectively, and for the control group 297.5 ± 45.1 µm, 248.3 ± 39.7 µm, and 286.5 ± 49.7 µm, respectively. There was a statistically significant decrease in all measurements compared with normal controls (p<0.001, for all). Although our patients showed significantly thinner CT in comparison to the control group, they showed an overall thicker Choroid if compared to Altinkaynak et al study. It is of note that our SLE patients were characterized by a higher disease activity (median SLEDAI was 6) which could explain this disparity; furthermore, there was a difference in the measuring points implemented in our study, being 750 microns as opposed to 1500 microns in the previously reported study; thus, could be an attributing factor to this discrepancy.
Age is one of the physiological factors that affect choroidal thickness.24 In this study, choroidal thinning showed a negative correlation to age in both groups at all evaluated points. The subfoveal CT was statistically correlated to age in the patients group (r= −0.464, p=0.005) and in controls (r= −0.497, p=0.007). When we remove the effect of age, still patients group showed thinner choroid compared to controls (p<0.001). These results were similar to many recent studies.3,22,25
The renal biopsy in nephritic patients is the gold standard for diagnosis but in remission and exacerbations of SLE, repeated biopsies are considered more dangerous than the disease itself. We divided the lupus patients into nephritic and non-nephritic subgroups according to renal impairment proved by laboratory results (creatinine and proteinuria). We compared the CT in the three loci between both subgroups. The subfoveal showed statistically significant thickening in nephritic (mean=287.3microns) subgroup than non-nephritic (mean=261.9 microns) (p=0.032). These results were contradictory to results obtained by Braga J et al.26 They found that the nephritic group had thicker choroid in macular area than both SLE non-nephritic patients and normal control. The results in our study suggest that the nephritic subgroup is in partial remission or that repeated immune complex aggregations cause subsequent ischemia to choriocapillaris. In a study conducted recently by Lee I et al.,27 they found no change in choroidal thickness between 12 nephritic patients in the remission phase and 11 non-nephritic SLE in the remission phase.
The severity of the SLE disease seems to have a stronger correlation with choroidal thickness than the duration of disease.26 The median SLEDAI was 6 (with 80% of patients had active lupus). We found a positive non-significant correlation between CT and SLEDAI (r=0.27, p=0.117).
Drusen-like deposits (DLDs) were significantly found in 22.9% in group1 (p=.023). In a study by Invernizzi A, et al on sixty patients with SLE, DLDs were detected in 40% of SLE similar to our study with respect to the number of sample size.28 Complement disorders seem to affect the prevalence of DLDs in SLE patients.29
The earliest retinal abnormality in antimalarial drugs, as Hydroxychloroquine (HCQ), is ganglion cell loss.30,31 As the densest area of ganglion cells population is at the peri-foveal region, so antimalarial drugs will first attack peri-foveal area causing the new sign, foveal cupping due to inner retinal thinning. The peri-foveal thinning is insignificant in our study; evident in 11.4% in group1, and 3.3% in group2 (p=.222). We could not find a significant correlation between the peri-foveal cupping and treatment dose (r= −0.024, p=0.9).
An earlier study by our group demonstrated increased serum miR-146a-5p in SLE patients with retinopathy compared to SLE patients without retinopathy.32 Previous studies demonstrate the dysregulated expression of miR-146a-5p in ocular component tissues, including the vitreous humor in patients with melanoma and retinal endothelial cells in patients with diabetic retinopathy.33 In our study, weadded plasma miRNA146 to correlate with choroidal thickness.It was found to be highly expressed in patients with SLE and especially nephritic lupus.12,13 The fold change wassignificantly higher in SLE patients (p=0.001). There was a significant positive correlation for lupus nephritis (r=0.37, p=0.04).
So being a prospective study that detected multifactorial influences on choroidal thickness, this can be a strong study that suggests that choroidal thinning is evident in all SLE patients (even active). Lupus nephritis, although it causes thinning compared to normal controls, but shows a significant increase compared to non-nephritic with positive correlation to both disease activity and miRNA146 fold increase.
Limitations in our study include manual OCT measurements of choroidal thickness. Nevertheless, this technique has been used before with high intraobserver reproducibility. Morphological findings in some participants, although not high, but deserves attention and better correlations. We did not depend on renal biopsy results in our study.
In conclusion: The choroidal thickness, as assessed by the RTVue, was significantly thinner among all SLE patients (nephritic and non-nephritic) as opposed to healthy control. Although thinner than normal control, subfoveal choroidal thickening can be considered a biomarker in nephritic lupus especially in conjunction with increase in miRNA146a. All SLE patients are at risk of small Drusen-like deposits.
Disclosure
All authors declare that they have no financial or other conflicts of interest.
References
1. Silpa-Archa S, Lee JJ, Foster CS. Ocular manifestations in systemic lupus erythematosus. Br J Ophthalmol. 2016;100(1):135–141. doi:10.1136/bjophthalmol-2015-306629
2. Boonsopon S, Maghsoudlou A, Foster CS. Ocular manifestations in systemic lupus erythematosus. Rheumatology (Sunnyvale). 2015;5:1.
3. Dias-Santos A, Ferreira JT, Pinheiro S, et al. Choroidal thickness changes in systemic lupus erythematosus patients. Clin Ophthalmol. 2019;13:1567–1578. doi:10.2147/OPTH.S219347
4. Makino S, Tamp H. Rare and unusual Choroidal abnormalities in a patient with systemic lupus erythematosus. Case Rep orts in Ophthalmology. 2013;4(2):81–86. doi:10.1159/000354288
5. Baglio V, Gharbiya M, Balacco-Gabrieli C, et al. Choroidopathy in patients with systemic lupus erythematosus with or without nephropathy. J Nephrol. 2011;24(4):522–529. doi:10.5301/JN.2011.6244
6. Tolba DA, El-Fayoumi DMS, Abdelaziz MS, Nabih MH. Fluorescein angiographic findings in patients with active systemic lupus erythematosus. Ocul Immunol Inflamm. 2017;25(6):884–890. doi:10.1080/09273948.2016.1192653
7. Povazay B, Hermann B, Hofer B, et al. Wide-field optical coherence tomography of the choroid in vivo. Invest Ophthalmol Vis Sci. 2009;50(4):1856–1863. doi:10.1167/iovs.08-2869
8. Wu L, Fan J, Belasco JG. MicroRNAs direct rapid deadenylation of mRNA. Proc Natl Acad Sci USA. 2006;103(11):4034–4039. doi:10.1073/pnas.0510928103
9. Carlsen AL, Schetter AJ, Nielsen CT, et al. 2013. Circulating microRNA expression profiles associated with systemic lupus erythematosus. Arthritis Rheum. 2015;65(5):1324–1334. doi:10.1002/art.37890
10. Schöler N, Langer C, Döhner H, Buske C, Kuchenbauer F. Serum microRNAs as a novel class of biomarkers: a comprehensive review of the literature. Exp Hematol. 2010;38(12):1126–1130. doi:10.1016/j.exphem.2010.10.004
11. Taganov KD, Boldin MP, Chang KJ, Baltimore D. NF-kappa B dependent induction of microRNA miR-146, an inhibitor targeted to signaling proteins of innate immune responses. Proc Natl Acad Sci USA. 2006;103(33):12481–12486. doi:10.1073/pnas.0605298103
12. Testa U, Pelosi E, Castelli G, Labbaye C. MiR-146 and miR- 155: two key modulators of immune response and tumor development. Non Coding RNA. 2017;3(3):22. doi:10.3390/ncrna3030022
13. Petri M, Orbai A-M, Alarcón GS, et al. Derivation and validation of systemic lupus international collaborating clinics classification criteria for systemic lupus erythematosus. Arthritis Rheum. 2012;64(8):2677–2686. doi:10.1002/art.34473
14. Bombardier C, Gladman DD, Urowitz MB, et al. Derivation of the SLEDAI. A disease activity index for lupus patients. The committee on prognosis studies in SLE. Arthritis Rheum. 1992;35(6):630–640. doi:10.1002/art.1780350606
15. Schmittgen TD, Zakrajsek BA, Mills AG, Gorn V, Singer MJ, Reed MW. Quantitative reverse transcription-polymerase chain reaction to study mRNA decay: comparison of endpoint and real-time methods. Anal Biochem. 2000;285(2):194–204. doi:10.1006/abio.2000.4753
16. Spaide RF, Koizumi H, Pozzoni MC. Enhanced depth imaging spectral-domain optical coherence tomography [erratum in Am J Ophthalmol 2009; 148: 325]. Am J Ophthalmol. 2008;146(4):496–500. doi:10.1016/j.ajo.2008.05.032
17. Coscas G, Zhou Q, Coscas F, et al. Choroid thickness measurement with RTVue optical coherence tomography in emmetropic eyes, mildly myopic eyes, and highly myopic eyes. Eur J Ophthalmol. 2012;22(6):992–1000. doi:10.5301/ejo.5000189
18. Fatoye F, Gebrye T, Svenson LW. Real-world incidence and prevalence of systemic lupus erythematosus in Alberta, Canada. Rheumatol Int. 2018;38(9):1721–1726. doi:10.1007/s00296-018-4091-4
19. Margolis R, Spaide RF. A pilot study of enhanced depth imaging optical coherence tomography of the choroid in nor- mal eyes. Am J Ophthalmol. 2009;147(5):811–815. doi:10.1016/j.ajo.2008.12.008
20. Manjunath V, Taha M, Fujimoto JG, Duker JS. Choroidal thickness in normal eyes measured using Cirrus HD optical coherence tomography. Am J Ophthalmol. 2010;150(3):325–329. doi:10.1016/j.ajo.2010.04.018
21. Branchini L, Regatieri CV, Flores-Moreno I, Baumann B, Fujimoto JG, Duker JS. Reproducibility of choroidal thickness measurements across three spectral domain optical coherence tomography systems. Ophthalmology. 2012;119(1):119–123. doi:10.1016/j.ophtha.2011.07.002
22. Altinkaynak H, Duru N, Uysal BS, et al. Choroidal thickness in patients with systemic lupus erythematosus analyzed by spectral-domain optical coherence tomography. Ocul Immunol Inflamm. 2016;24(3):254–260. doi:10.3109/09273948.2015.1006790
23. Haefliger IO, Meyer P, Flammer J, et al. The vascular endothelium as a regulator of the ocular circulation: a new concept in ophthalmology. Surv Ophthalmol. 1994;39(2):123–132. doi:10.1016/0039-6257(94)90157-0
24. Maul EA, Friedman DS, Chang DS, et al. Choroidal thickness measured by spectral domain optical coherence tomography. Factors affecting thickness in glaucoma patients. Ophthalmology. 2011;118(8):1571–1579. doi:10.1016/j.ophtha.2011.01.016
25. Barteselli G, Chhablani J, El-Emam S, et al. Choroidal volume variations with age, axial length, and sex in healthy subjects: a three-dimensional analysis. Ophthalmology. 2012;119(12):2572–2578. doi:10.1016/j.ophtha.2012.06.065
26. Braga J, Rothwell R, Oliveira M, et al. Choroid thickness profile in patients with lupus nephritis. Lupus. 2019;28(4):475–482. doi:10.1177/0961203319828525
27. Lee I, Marshall B, Ranganathan P, et al. Choroidal thickness in lupus nephritis. Lupus. 2020;29(2):205–209. doi:10.1177/0961203319898765
28. Invernizzi A, dell’Arti L, Leone G, et al. Drusen-like deposits in young adults diagnosed with systemic lupus erythematosus. Am J Ophthalmol. 2017;175:68–76. doi:10.1016/j.ajo.2016.11.014
29. Schlanitz FG, Ahlers C, Sacu S, et al. Performance of drusen detection by spectral-domain optical coherence tomography. Invest Ophthalmol Vis Sci. 2010;51(12):6715–6721. doi:10.1167/iovs.10-5288
30. Turgut B, Koca S. Perifoveal cupping detected by optical coherence tomography may represent an early sign of antimalarial-associated maculopathy. Firat Tip Dergisi. 2012;17(4):238–242.
31. Pasadhika S, Fishman GA, Choi D, Shahidi M. Selective thinning of the perifoveal inner retina as an early sign of hydroxychloroquine retinal toxicity. Eye (Lond). 2010;24(5):756–763. doi:10.1038/eye.2010.21
32. Labib DA, Koptan D, Ghoniem S, Salah SH, El Shazly R, El Refai RM. Dysregulation of microRNA146a-5p expression in systemic lupus erythematosus females: diagnostic potential and association with ocular manifestations. Egypt Rheumatologist. 2020;42(2):117–121. doi:10.1016/j.ejr.2019.07.004
33. Ye EA, Steinle JJ. MiR-146a attenuates inflammatory pathways mediated by TLR4/NF-kappaB and TNF alpha to protect primary human retinal microvascular endothelial cells grown in high glucose. Mediators Inflamm. 2016;2016:3958453. doi:10.1155/2016/3958453
 © 2020 The Author(s). This work is published and licensed by Dove Medical Press Limited. The
full terms of this license are available at https://www.dovepress.com/terms
and incorporate the Creative Commons Attribution
- Non Commercial (unported, 3.0) License.
By accessing the work you hereby accept the Terms. Non-commercial uses of the work are permitted
without any further permission from Dove Medical Press Limited, provided the work is properly
attributed. For permission for commercial use of this work, please see paragraphs 4.2 and 5 of our Terms.
© 2020 The Author(s). This work is published and licensed by Dove Medical Press Limited. The
full terms of this license are available at https://www.dovepress.com/terms
and incorporate the Creative Commons Attribution
- Non Commercial (unported, 3.0) License.
By accessing the work you hereby accept the Terms. Non-commercial uses of the work are permitted
without any further permission from Dove Medical Press Limited, provided the work is properly
attributed. For permission for commercial use of this work, please see paragraphs 4.2 and 5 of our Terms.