Back to Journals » Clinical Ophthalmology » Volume 14
Children with Dyslexia Have Altered Cross-Modal Processing Linked to Binocular Fusion. A Pilot Study
Authors Quercia P ![]() , Pozzo T, Marino A
, Pozzo T, Marino A ![]() , Guillemant AL, Cappe C
, Guillemant AL, Cappe C ![]() , Gueugneau N
, Gueugneau N
Received 9 August 2019
Accepted for publication 27 January 2020
Published 13 February 2020 Volume 2020:14 Pages 437—448
DOI https://doi.org/10.2147/OPTH.S226690
Checked for plagiarism Yes
Review by Single anonymous peer review
Peer reviewer comments 3
Editor who approved publication: Dr Scott Fraser
Supplementary video of "Binocular fusion and Children with dyslexia" [ID 226690].
Views: 974
Patrick Quercia, 1 Thierry Pozzo, 2 Alfredo Marino, 3 Anne Laure Guillemant, 1 Céline Cappe, 4 Nicolas Gueugneau 1
1Université de Bourgogne, Dijon, Campus Universitaire, UFR STAPS, BP 27877, F-21078 Dijon, France; INSERM U1093, Cognition, Action et Plasticité Sensorimotrice, Dijon F-21078, France; 2Center for Translational Neurophysiology, Istituto Italiano di Tecnologia, Ferrara, Italy; 3Private Consultant, Vicenza 36100, Italie; 4Brain and Cognition Research Center, CerCo, CNRS UMR 5549, Toulouse, France
Correspondence: Patrick Quercia
Medical Office, 15 Rue du Clair Matin, Beaune 21200, France
Tel +33 6 87822741
Email [email protected]
Introduction: The cause of dyslexia, a reading disability characterized by difficulties with accurate and/or fluent word recognition and by poor spelling and decoding abilities, is unknown. A considerable body of evidence shows that dyslexics have phonological disorders. Other studies support a theory of altered cross-modal processing with the existence of a pan-sensory temporal processing deficit associated with dyslexia. Learning to read ultimately relies on the formation of automatic multisensory representations of sounds and their written representation while eyes fix a word or move along a text. We therefore studied the effect of brief sounds on vision with a modification of binocular fusion at the same time (using the Maddox Rod test).
Methods: To check if the effect of sound on vision is specific, we first tested with sounds and then replaced them with proprioceptive stimulation on 8 muscular sites. We tested two groups of children composed respectively of 14 dyslexic children and 10 controls.
Results: The results show transient visual scotoma (VS) produced by sensory stimulations associated with the manipulation of oculomotor balance, the effect being drastically higher in the dyslexic group. The spatial distribution of the VS is stochastic. The effect is not specific for sounds but exists also with proprioceptive stimulations.
Discussion: Although there was a very significant difference between the two groups, we were not able to correlate the (VS) occurrence with the dyslexic’s reading performance. One possibility to confirm the link between VS and reading impairment would be to find a specific treatment reducing the occurrence of the VS and to check its effect on dyslexia.
Keywords: multisensory integration, developmental dyslexia, ocular proprioception, auditory, visual, proprioception, binocular balance
Introduction
Developmental dyslexia is a frequently occurring reading disability, characterized by difficulties with accurate and/or fluent word recognition and by poor spelling and decoding abilities.1 The cause is unknown. Two preeminent causal models have emerged.2 On the one hand the phonological disorder model suggests that dyslexia affects the dyslexic’s ability to represent the smallest units of speech sound called phonemes.3 Changes in the brain would be responsible for the deficit. In this phonological perspective dyslexics are considered as subjects with intact audition and vision.4 On the other hand, the second model suggests deficiencies in the processing of sensory stimuli, notably in auditory, visual, vestibular and motor processing at both behavioral and neurological levels.5–8 Motility is generally studied from the perspective of the equilibrium or the precision of the gesture.9,10 Only a few authors are interested in the sensory aspect of motor skills through the proprioceptive sense.11
Numerous studies have documented the presence of motor eye anomalies such as vergence and divergence insufficiency, accommodation deficits and low vertical heterophorias,12–14 Deficits of perception of low contrast, low spatial frequency, high frequency temporal visual information, anomalies of visual attention with certain forms of negligence or short visual attention spans have also been demonstrated in a large number of cases of dyslexia.15–19 The possible cause and clinical relevance of these deficits are uncertain.20
In the auditory field, a considerable body of evidence shows that measures of frequency, time, and duration of modulation and frequency modulation are most often impaired in patients with dyslexia.21
Learning to read ultimately relies on the formation of automatic multisensory representations of sounds and their written forms. Some studies show that dyslexic children have difficulties integrating auditory and visual information.22 They provide support for a theory of altered cross-modal processing with the existence of a pan-sensory temporal processing deficit associated with dyslexia.23–25
To our knowledge, none of these studies take into account the quality of ocular movements during auditory and visual stimulation. This quality is based on a mechanism coupling the efference copy (or corollary discharge) and a proprioceptive feedback whose role increases in case of errors.26 Numerous studies show that these errors are very frequent during the reading of dyslexic children.27 This suggests a more pronounced use of ocular proprioception in this particular group.28
Recently our team has shown that impaired binocular vision in a sample of children is able to increase visual losses during auditory stimulation.29 We proposed the same paradigm integrating vision, ocular proprioception and hearing modifications in dyslexic children. We changed ocular proprioception by using the vertical Maddox Rod Test (MRT) which dissociates the two retinal images. This reveals a latent vertical misalignment of the eyes called vertical heterophoria that is reduced via binocular vision mechanisms including ocular proprioception and corollary discharge.26,30 In order to verify whether the role of hearing is specific, we replaced sound stimulations with proprioceptive stimulations applied to different parts of the body.
Most studies investigating multisensory integration in dyslexia are focusing on the temporal window of integration of two brief stimuli.25 In our study, it is possible that the temporal window of integration may not intervene when three sensory modifications were combined simultaneously for a long time. It is a remarkable fact because disruptions in the temporal processing of multisensory information have been strongly linked to dyslexia.24
Materials and Methods
Subjects
Two groups of children were tested using an experimental protocol in conformity with the guidelines of the Declaration of Helsinki, after obtaining the written informed consent of their parents. The study was an observational clinical study with no therapeutic intervention. According to the guidelines of the clinical ethics committee of the University of Burgundy, it was not necessary to submit this study for approval. The children were recruited from a pediatric ophthalmological consultation in order of arrival as soon as they were of an age for visual tests and they were treated by speech therapy for dyslexia The groups were, respectively, composed of 14 dyslexic children (8 males and 6 females, mean age = 10.7 ± 1.2 years, range = 8–13), and 10 control children (5 males and 5 females, mean age = 11.3 ± 1.6, range = 10–13), with no significant age difference (t(22) = 1.96, p = 0.60).
The inclusion criteria for the dyslexics were a childhood history of dyslexia with a documented diagnosis, a past history of speech therapy, and a score of at least 24 months of literacy retardation on the Written Word Identification Test (WWIT/TIME 3 test).31 Conversely, children with no specific history of dyslexia, no history of speech therapy, and no retardation in reading skills (WWIT/TIME 3 test) were involved as controls. The objective of this test is to assess the reading level of children (7 to 15 years old) via the “identification of written words” component. The material consists of a single sheet which offers two-sided two-choice tasks consisting of finding the target item among 5 test items. The first task is to find the word corresponding to the image and, for the second, to associate two words related semantically. A total of 40 words are to be identified. The benchmarking was done with 1706 children with a strict control of lexical factors in the choice of words and test items and excellent psychometric indices (internal consistency of 0.92). This test is widely used in France to identify the decoding skills and the comprehension and spelling of these 40 typical French words. The result is given in months of deviation from a database corresponding to children of the same age. The reading value was positive for typical readers (16.4±8.9 months), which indicates a slight “advance” in reading level. The average delay was 33.46±9.9 months for the dyslexic children. For dyslexic children only, using the Odedys2 Battery helped classify the characteristics of dyslexia by assessing the reading of regular words, irregular words, pseudowords, and phonological capabilities.32
All the children had 20/20 vision in both eyes without refractive error based on evaluation with cyclopentolate (± 0.12Δ with Canon RKF2 Autorefractometer) and the stereopsis was always better than 120 arcsec (the assessment of stereoscopic vision was done using the Test of the Netherlands Organization for Applied Scientific Research [TNO].26 This test was completed by standard and alternating cover tests allowing the measurement of horizontal and vertical phorias for distance vision, using prisms and a light source placed at 4 m from the child. The convergence of each eye was measured in centimeters for near vision using a Mawas ruler. This battery of tests is a classical clinical method to evaluate the normality of binocular vision.26 We identified the dominant eye by using the hole method (the patient holds a sheet with a hole in its center at arm’s length and must aim for a light through the hole while rapidly approaching one of the two eyes). The slit lamp examination of the anterior and posterior segments was normal. Children with the following visual characteristics were excluded: strabismus with or without surgery, orthoptic rehabilitation in progress, vertical phoria >0.37° (physiological vertical phoria in normal subjects is on average 0.16±0.01°), reeducated amblyopia. Further exclusion criteria were psychiatric or genetic diseases, treatment with psychotropic drugs (especially phenyl ethylamine group or antiepileptics), delayed or abnormal psychomotor development and IQ level <90. All recruited children were kept for statistical analysis.
Experimental Design
Control and dyslexic children underwent the same protocol. Generally, the participants were submitted to multisensory integration paradigms where auditory (experiment 1) and proprioceptive (experiment 2) inputs were perturbed during a simple visual recognition task.
Modification of Binocular Vision (See Movie for Chapters 2.2.1 And 2.2.2)
The Maddox Rod Test (MRT), which disrupts fusion of retinal images, is performed with a red Maddox rod, consisting of 17 biconvex cylinders that give enough convergence to transform the image of a dot of white light into a red line perpendicular to the cylinder axis.26,29,33 For our experiment, the intensity of the light (Light-Emitting Diode) measured at 2 cm of the source is 120 Lumens. When stripes are positioned parallel to the vertical axis of the eye, the participant sees two dissociated images of a light source placed at a distance of four meters at eye level: a red horizontal line through the Maddox rod for one eye and a colorless light point for the other eye. Since the brain perceives the light as two distinct forms, the MRT alters the fusion of both retinal images. Consequently, the exact orientation of both eyes on the light could become less stable because it is only controlled by ocular proprioception and corollary discharge. A vertical angular deviation known as vertical heterophoria may occur. Hence the Maddox rod test allows a change in visual perception and cortical mechanisms while enhancing ocular proprioception and corollary discharge.
Then, during auditory stimulation only, instead of using the Maddox rod, the exact same visual perception is created using a laser to produce a red horizontal line on the light source. In this case, the participant sees an image similar to that which he sees during the MRT with both eyes but retinal fusion is respected and no ocular proprioception change occurs. This situation allows study of the role of ocular proprioception on the interplay between vision and hearing in the dyslexic and the non-dyslexic group.
Multisensory Integration Tasks
The children were able to rest as much as necessary between each event to limit the role of fatigue and inattention. The study was carried out in a large, silent and naturally lit room. The children were sitting in a comfortable position at a distance of 4 meters from the LED, which is located in the Frankfort horizontal plane. This plane is the reproducible position of the head when the upper margin of the ear openings and lower margin of the orbit of the eye are horizontal. Whether the stimulation is auditory or proprioceptive, the child was told to stare directly at the light dot. In order to give the place of eventual visual losses, six eight-centimeters-high drawings (extracted from Wingdings font – Word 2010*), separated by a distance of 0.4 degrees and easy for the children to identify, are placed on each side of the light (Figure 1). The participant was asked to specify in front of which drawing the line disappeared. He was asked to report the possible loss of vision of one or more drawings (Figure 2). The duration of the protocol is approximately 20 mins. The question asked was very simple: tell me if you see the entire red line or if parts of the red line are missing. If parts are missing, tell me opposite which drawing these parts are missing. There were 5 trials before noting the results.
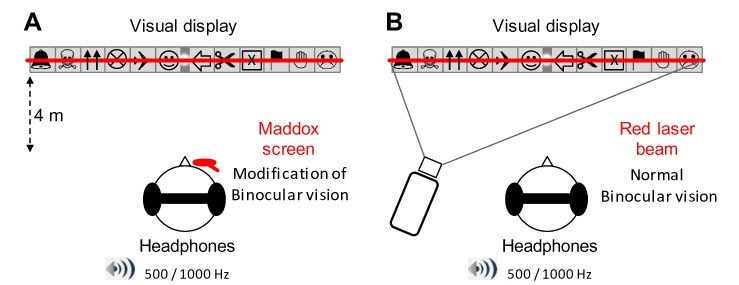 |
Figure 1 Schematic representation of the experimental set-up. (A) With the Maddox rod. The participants stood upright in front of the visual display, which was at the same height as the eyes’ participants. Here, the Maddox screen is represented over the subject’s right eye (see Experimental procedure and film for details). The participants wore headphones that delivered sounds of 500 or 1000 Hz (series of 500 ms “beep”). During the trials, the subject had to fixate with both eyes on a small light located at the exact center of the visual display. Top: detailed representation of the visual display. Six eight-centimeter-high drawings, easy for the children to identify, are placed on each side of the visual display (the light always appeared in the center gray zone). Bottom: when the Maddox screen is placed in front of one of the two eyes, the subject sees a combination of the vision of the non-occluded eye (light point in the center and 12 pictures) and of the other eye (a red horizontal line that goes through the light). Each of the two eyes thus sees a different image of the light, binocular fusion is modified. The subject fixates with both eyes on a light located in the center of 12, easily recognized, images. (B) With red laser beam. Here the red line is produced by a laser beam projected through the center of this light. Because both eyes see the same image, there is no change in binocular vision. |
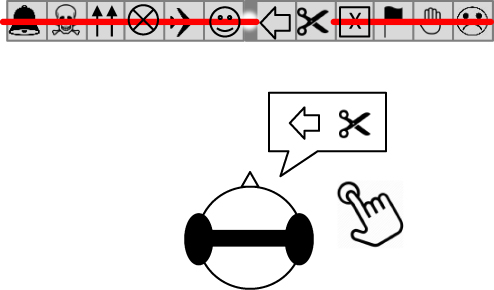 |
Figure 2 Example of a subject verbally reporting VS While fixating at the visual display, if the subject experienced a VS he had to press a hand-held button within his right hand, and clearly say to the experimenter where the “red line” had disappeared. In this case, at the level of the left oriented arrow and the scissors. |
The set of auditory stimulations was performed with the Maddox rod placed at random in front of the right or left eye. Sounds are emitted simultaneously in both ears through Sennheiser HD 200 PRO headphones.29 Each beep lasted 500msec at the exact volume of 50 dB. The participant receives successively a series of twenty-two 500Hz and twenty-three 1000Hz sound impulses delivered in a random mode allowing the child to respond without a time-limit.
He or she has to tell if and where visual losses appear. A rest period of 10 seconds was provided prior to each auditory stimulation. Testing with 45 stimulations required 15 to 20 mins according to the speed of the subject’s responses and the presence or absence of visual losses.
This task was performed before or after the audiovisual task, in a counterbalanced order with a similar number of children in both groups performing the tasks in each order (a pre-experimental testing did not reveal any order effect). To limit fatigue, the Maddox rod was always placed in front of the dominant eye. In order to change muscle proprioception, vibrations are produced using a hand vibrator (Vibrasens ©, Tecno Concept France) with a tip for tendinous application.34,35 The vibration frequency was 80Hz. The participant, sitting comfortably in a seat without a backrest, successively receives a series of 3 vibrations for a duration of approximately 3 seconds, distributed randomly at 4 different sites on the right and on the left: dorsal paravertebral muscles (in front of vertebrae T5-T6), lumbar paravertebral muscles (in front of vertebrae L4-L5), Achilles tendon (4 cm above the upper limit of posterior tuberosity of calcaneus), external surface of the forearm (6 cm above the base of the thumb, where the tendons of the brachioradialis muscle meet, extensor carpi radialis longus muscle and extensor carpi radialis brevis muscle). A total of 12 stimulations were induced to the right and left, either at the level of postural muscles, or at the level of muscles or peripheral tendons. As for the audiovisual task, he or she has to say if and where visual losses appeared. A rest period of 10 seconds was given before each stimulation.
Data Analysis and Statistics
Concerning binocular vision, mean (± SE) for each test of the visual assessment (stereoscopic vision, horizontal and vertical phorias for far vision and convergence of each eye) were computed for each group. Group differences were evaluated by means of two-tailed paired t-tests.
Visual losses induced by the sensory stimulations (audition or proprioception) were termed as visual scotomas (VS), i.e. a brief suppressive effect of visual perception. Here, one VS indicated a partial disappearance of the red line within the visual display, corresponding to a specific picture location. For instance, 2 VS indicated that a subject reported that the red line disappeared over 2 pictures (Figure 2). The number of VS ran from 0 to 12 per trial (i.e. 12 pictures, see Figure 1). VS were quantified as follows for each experimental condition in both groups.
Percentage of VS Occurrence
The number of trials with at least one VS was based on the total number of trials for each experimental condition. For instance in the audiovisual integration task, when a participant experienced at least one VS in 5 trials over a total of 22 trials, this gave (5 x 100)/22 = 22.72%, giving the percentage of VS occurrence. We obtained this percentage for each participant and experimental condition, for which we calculated the group mean (± SE) in each experimental condition.
Size of VS
We quantified the size of VS in two ways for each experimental condition: first, by considering the number of VS based on the total of trials for each condition; second, by considering the number of VS based only on the trials with VS For both variables we calculated the mean (± SE) in each experimental condition. As VS were absent in some trials, we could precisely quantified the mean size of VS from these two variables (see Results section).
Spatial Distribution of VS
We measured the percentage of VS occurrence for each picture location within the visual display. For each picture, we added the trials with VS occurrence and divided them by the total number of trials. That is, for each participant and experimental condition we obtained a percentage of VS occurrences for each picture location. This allowed us to track the position of VS occurrence within the participant visual field.
The data related to the Percentage of VS occurrence and the Size of VS were normally distributed (Shapiro–Wilk tests, p > 0.05), and sphericity (Muchly tests, p > 0.05) was respected. For the audiovisual task, these variables were entered as mixed-design repeated-measures ANOVA per Group (dyslexic, control) as between-subject factor; and MADDOX (left eye Maddox, right eye Maddox, binocular vision) and Sound frequency (500Hz, 1000Hz) as within-subject factors. Also, as normality was systematically violated for the variables related to spatial distribution of VS, we used an ANOVA of Friedman (non-parametric test) with a Location effect for each of the 12 experimental conditions (2 Group x 3 Maddox x 2 Sound frequency). For the visuo-proprioceptive task, the Percentage of VS occurrence and the Size of VS were entered as mixed-design repeated-measures ANOVA with Group (dyslexic, control) as between-subject factor; and Vibration Site (wrist, back) as within-subject factors. As normality was violated for the variables related to spatial distribution of VS, we used an ANOVA of Friedman with a Location effect for each of the 4 experimental conditions (2 Group x 2 Vibration Site).
Finally, to determine to what extent binocular vision would have a link with the presence of VS phenomenon, Pearson’s correlations were applied to assess any correlation between data from the visual tests and the percentage of VS occurrence in the dyslexic group.
Results
First, it has to be mentioned that no subject from any group has experienced VS phenomena during normal visual perception, i.e.; without sensory stimulation. Whether the subject was dyslexic or not he/she never perceived a suppressive effect on visual perception after receiving a sound stimulation (audiovisual task) or a proprioceptive stimulation (visuo-proprioceptive task).
Visual Tests
Stereoscopic vision, horizontal and vertical phorias for far vision and convergence of each eye are shown in Table 1. They make it possible to clearly distinguish the group of dyslexics from the non-dyslexic group. This is in keeping with what is known in the scientific literature.15
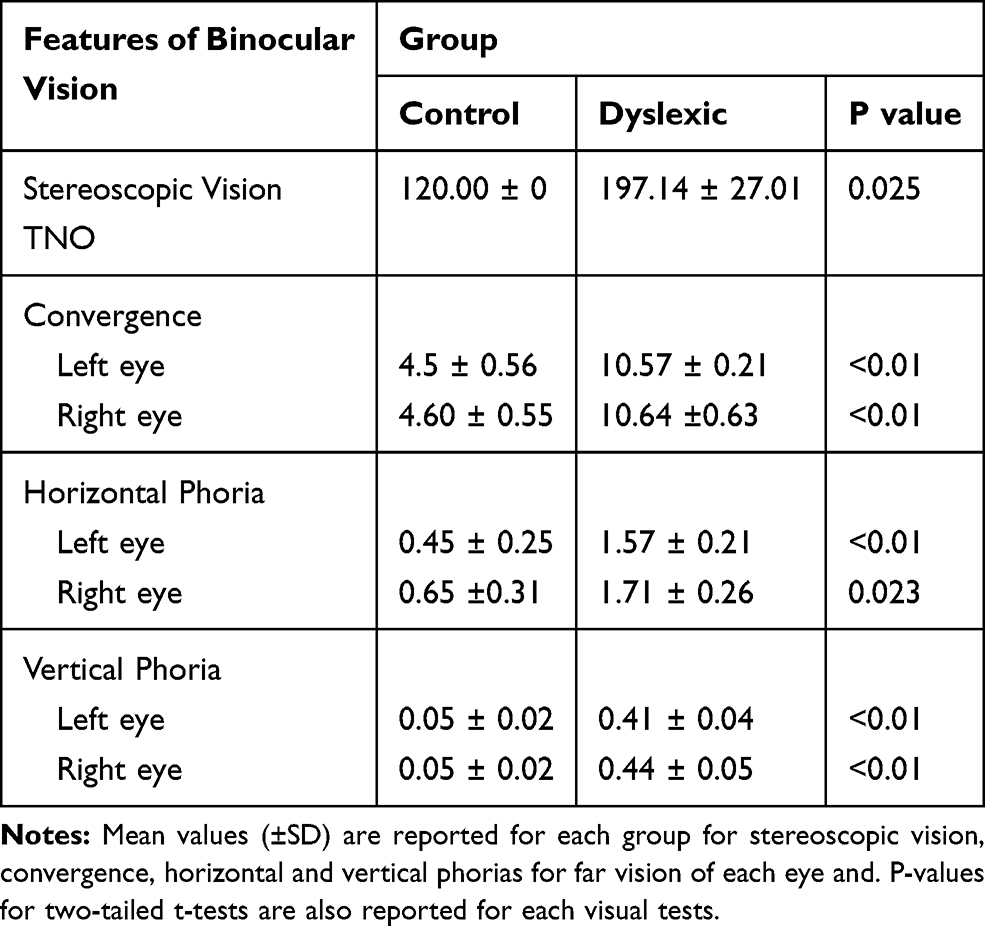 |
Table 1 Visual Assessment |
Audiovisual Task
Figure 3 shows the modulation of VS according to the experimental conditions during the audiovisual task for both dyslexics and controls. Generally, the occurrence of VS appears to vary across groups, and seems to be affected by the manipulation of binocular vision.
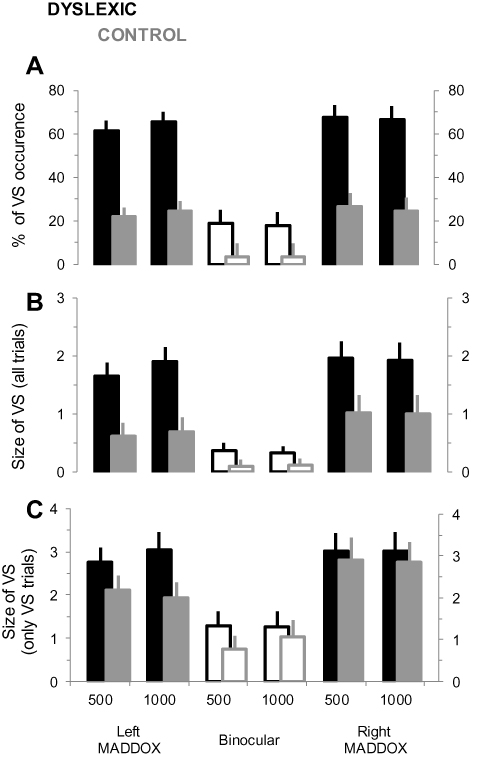 |
Figure 3 Occurrence and size of the VS phenomenon during the audiovisual task for dyslexic and control groups. (A) Mean percentage (±SD) of the VS occurrence for the different conditions of binocular vision, and for both sound frequencies. (B) Mean size (±SD) of the VS for the different experimental conditions. Note that the values are expressed as a number of “disappeared pictures”. (C) Same as in (B) but only the trials including a VS phenomenon are considered. |
The percentage of VS occurrence for all experimental conditions is indicated in Figure 3A. On average, it was 52.25 ± 5.53% (95% CI [43.10, 56.29]) and 17.25 ± 4.07% (95% CI [12.39, 22.54]) for dyslexic and controls, respectively. ANOVA analysis revealed significant main effects of Group (F1,22 = 29.78; p < 0.001; ηp2 = 0.74) and MADDOX (F2,22 = 38.94; p < 0.001; ηp2 = 0.86), and a significant Group x MADDOX interaction effect (F2,44 = 5.74; p = 0.042; ηp2 = 0.29). The Sound frequency effect was not significant (F1,22 = 0.05; p = 0.82; ηp2 = 0.01). Post-hoc analysis indicated that VS occurrence was higher in the MADDOX conditions compared to binocular vision in both groups (p < 0.001 for each comparison), with no significant difference between left and right MADDOX (p > 0.05 for each comparison). Interestingly, the mean VS occurrence in binocular vision for dyslexics was not significantly different to the one in MADDOX conditions for controls (p > 0.05 for each comparison).
The mean size of VS as a function of experimental conditions followed a pattern of modulation that was qualitatively similar to the percentage of VS occurrence (Figure 3B). On average, in control subjects 0.69 ± 0.07 (95% CI [0.32, 0.96]) and 1.01 ± 0.1 (95% CI [0.48, 1.4]) pictures per trial were occluded for left and right MADDOX respectively; and 0.11 ± 0.02 (95% CI [0.07, 0.19]) for binocular vision. In dyslexic subjects 1.78 ± 0.09 (95% CI [1.42, 2.12]) and 1.94 ± 1.11 (95% CI [1.50, 2.36]) pictures per trial were occluded for left and right MADDOX respectively; and 0.35 ± 0.05 (95% CI [0.17, 0.52]) for binocular vision. ANOVA analysis confirmed significant main effects of Group (F1,22 = 10.23; p = 0.009; ηp2 = 0.54) and MADDOX (F2,44 = 24.46; p < 0.001; ηp2 = 0.86). The Group x MADDOX interaction effect was close to significance (F2,44 = 3.49; p = 0.052; ηp2 = 0.27) and the Sound frequency effect was not significant (F1,22 = 0.09; p = 0.39; ηp2 = 0.02). Post-hoc analysis indicated that the mean size of VS was higher in the MADDOX conditions compared to binocular vision in both groups (p < 0.01 for each comparison), with no significant difference between left and right MADDOX (p > 0.05 for each comparison). Moreover, the mean size of VS in binocular vision for dyslexics was not significantly different to the mean size of VS in MADDOX conditions for controls (p > 0.05 for each comparison).
As no VS were observed in some trials, we also quantified the size of VS by considering only the trials in which VS were reported (Figure 3C). Here, on average 2.39 ± 0.28 (95% CI [2.05, 2.74]) and 1.96 ± 0.33 (95% CI [1.53, 2.40]) pictures per trial were occluded, for dyslexic subjects and controls respectively. ANOVA analysis confirmed a significant MADDOX effect (F2,44 = 18.09; p < 0.001; ηp2 = 0.60), but failed to detect any Group effect (F1,22 = 10.23; p = 0.33; ηp2 = 0.13) Sound frequency effect (F1,22 = 0.22; p = 0.63; ηp2 = 0.001), or interaction effects (p > 0.57). Post-hoc analysis indicated that the mean size of VS was higher in the MADDOX conditions compared to binocular vision in both groups (p < 0.001 for each comparison), with no significant difference between left and right MADDOX (p > 0.05 for each comparison).
Figure 4 indicates the spatial distribution of VS in each experimental condition. We show the percentage of VS occurrence for each picture location within the visual display, for the dyslexic and control group. Qualitatively, no clear pattern of a spatial modulation could be seen for the whole conditions. ANOVA of Friedman revealed no significant Location effect in any experimental condition for both groups. For the dyslexic group the analysis gave: χ2 = 8.63; p = 0.12 and χ2 = 2.33; p = 0.80 for the 500 Hz and 1000 Hz left MADDOX conditions respectively; χ2 = 9.51; p = 0.57 and χ2 = 13.16; p = 0.18 for the 500 Hz and 1000 Hz binocular vision respectively; χ2 = 11.21; p = 0.42 and χ2 = 11.87; p = 0.37 for the 500 Hz and 1000 Hz right MADDOX conditions respectively. For the control group, the analysis gave: χ2 = 11.50; p = 0.40 and χ2 = 14.54; p = 0.20 for the 500 Hz and 1000 Hz left MADDOX conditions respectively; χ2 = 6.01; p = 0.87 and χ2 = 12.26; p = 0.34 for the 500 Hz and 1000 Hz binocular vision respectively; χ2 = 32.50; p = 0.07 and χ2 = 9.23; p = 0.59 for the 500 Hz and 1000 Hz right MADDOX conditions respectively.
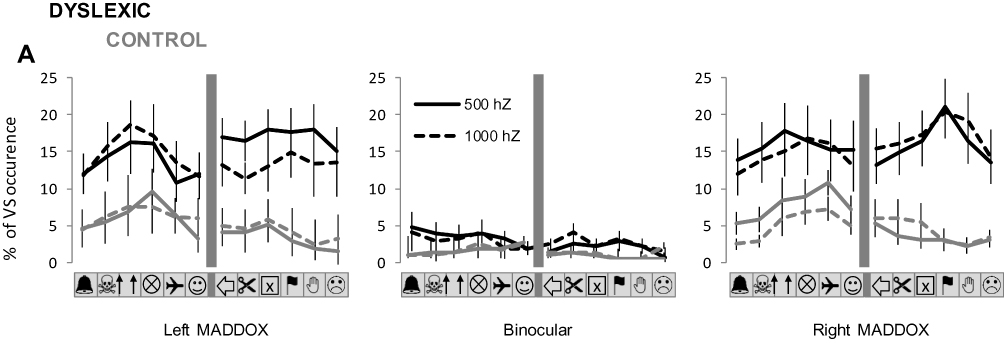 |
Figure 4 Spatial distribution of VS during the audiovisual task for dyslexic and control groups. The spatial distribution of VS occurrence within the visual display is represented for each experimental condition. The graphs precisely indicate, for each condition of binocular vision and sound frequency, the mean percentage (±SE) of VS occurrence for each picture location. |
Finally, during the audiovisual task no specific relationship was detected between VS occurrence and binocular vision within the dyslexic group. Specifically, considering each subject no significant correlation was measured between the percentage of VS and the performance from the binocular vision tests (R2 < 0.01; p > 0.57 for the percentage of VS vs the results of every visual test).
Generally, the results strongly suggest that, in our audiovisual task, the VS phenomenon is much more frequent in dyslexics compared to control subjects, but of relatively similar amplitude, and with no spatial bias. Also, no clear relation was detected between the performance from the visual tests and the presence of VS
Visuoproprioceptive Task
Figure 5 shows the modulation of VS according to the vibration site during the visuoproprioceptive task for both dyslexics and controls. The percentage of VS occurrence for the two conditions of vibration is indicated in Figure 5A. On average, it was 60.3 ± 9.07% (95% CI [48.98, 74.21]) and 15.9 ± 7.01% (95% CI [5.13, 26.73]) for dyslexic and control subjects, respectively. ANOVA analysis revealed a significant main effect of Group (F1,22 = 14.45; p < 0.001; ηp2 = 0.60). The Vibration Site and Interaction effects were not significant (F1,22 = 0.02; p = 0.86; ηp2 = 0.006, and F1,22 = 0.48; p = 0.49; ηp2 = 0.16, respectively).
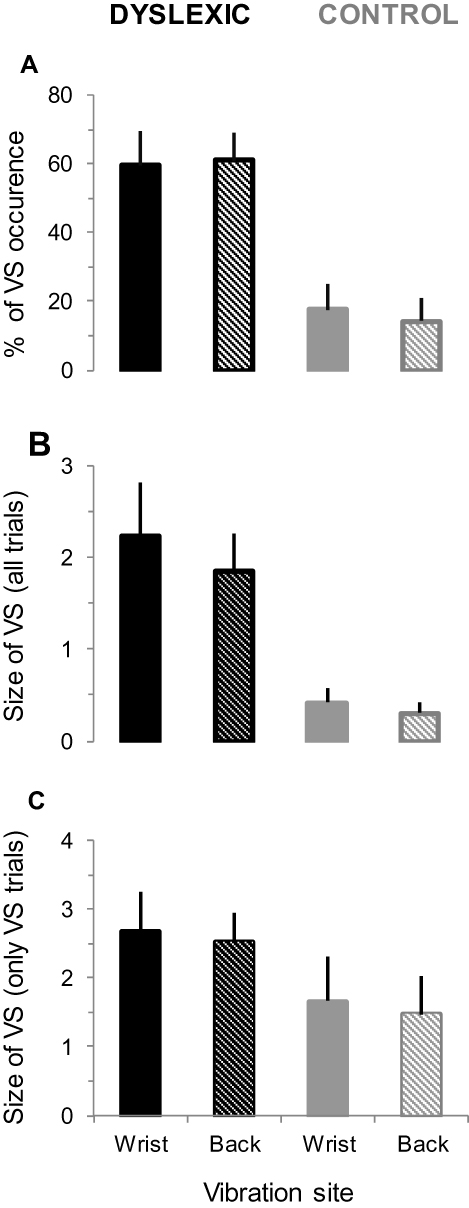 |
Figure 5 Occurrence and size of the VS phenomenon during the visuoproprioceptive task for dyslexic and control groups. (A) Mean percentage (±SD) of the VS occurrence for the different conditions of proprioceptive stimulation (wrist and back). (B) Mean size (±SD) of the VS for the same conditions. Note that the values are expressed as a number of “disappeared pictures”. (C) Same as in (B) but only the trials including a VS phenomenon are considered. |
The mean size of VS as a function of vibration is shown in Figure 5B. On average, there were 2.04 ± 0.49 (95% CI [1.46, 2.89]) and 0.36 ± 0.14 (95% CI [0.14, 0.57]) for dyslexic and control subjects, respectively. ANOVA analysis confirmed a significant Group effect (F1,22 = 9.02; p = 0.012; ηp2 = 0.80), while the Vibration Site and Interaction effects were not significant (F1,22 = 1.06; p = 0.31; ηp2 = 0.02, and F1,22 = 0.05; p = 0.81; ηp2 = 0.01, respectively). Moreover, as no VS were observed in some trials, especially for control subjects, we also quantified the size of VS by considering only the trials with VS (Figure 5C). On average, 2.59 ± 0.51 (95% CI [2.01, 3.5]) and 1.56 ± 0.61 (95% CI [0.62, 2.48]) pictures per trial were occluded, for dyslexic subjects and controls respectively. ANOVA analysis only revealed a marginally significant effect of Group (F1,22 = 3.23; p = 0.08; ηp2 = 0.47). The Vibration Site and Interaction effects were not significant (F1,22 = 0.14; p = 0.70; ηp2 = 0.001, and F1,22 = 0.05; p = 0.82; ηp2 = 0.02, respectively).
Figure 6 indicates the spatial distribution of VS for each condition of vibration. We show the percentage of VS occurrence for each picture location within the visual display, for dyslexics and controls.
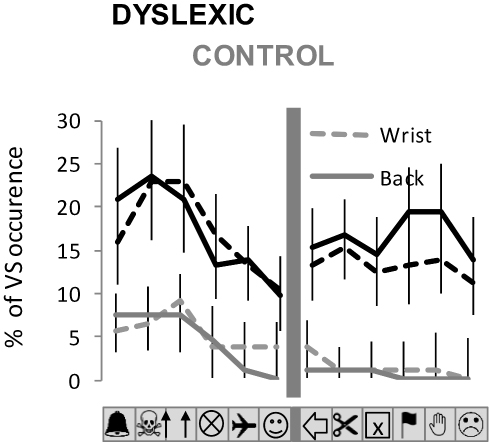 |
Figure 6 Spatial distribution of VS during the visuoproprioceptive task for dyslexic and control groups. The spatial distribution of VS occurrence within the visual display is represented for each experimental condition for the proprioceptive stimulation (wrist and back. The graphs precisely indicate, for each condition of binocular vision and sound frequency, the mean percentage (±SE) of VS occurrence for each picture location). |
Qualitatively, it appears that values of VS occurrence for pictures located at the extreme left of the visual display are slightly higher than for other picture locations. However, this tendency was only partially confirmed by the statistics. ANOVA of Friedman revealed no significant Location effect in any experimental condition for the dyslexic group, as the analysis gave: χ2 = 10.48; p = 0.48 and χ2 = 2.33; p = 0.80 for wrist and back vibration, respectively. For the control group, the analysis gave: χ2 = 13.5; p = 0.25 and χ2 = 33.00; p < 0.01 for wrist and back vibration, respectively. In the latter case, the % of visual occurrence was significantly higher for the 3 pictures at the left than for all the other pictures (p < 0.05 for each Post-hoc comparison).
Finally, during the visuoproprioceptive task, no specific relationship was detected between VS occurrence and binocular vision within the dyslexic group. For each subject no significant correlation was measured between the percentage of VS and the performance on the binocular vision tests (R2 < 0.02; p > 0.43 for the percentage of VS vs the results of every visual test).
The data thus strongly suggest that VS phenomenon is much more frequent in dyslexics compared to control subjects, but of relatively similar amplitude, and with no spatial bias. Also, no clear relation was detected between the performance from the visual tests and the presence of VS
Discussion
The evidence for changes in both visual and auditory function in dyslexia suggests that it may be necessary to consider the disorder in a more pan-sensory or multisensory framework.36 Most studies suggest that dyslexic children are “binding” visual and auditory stimuli over unusually long periods of time. This peculiarity of the multisensory temporal binding window could present difficulties for the construction of strong reading representations, in that it will present greater ambiguity as to which auditory elements of the written word (i.e., phonemes) belong with which visual elements (i.e., graphemes).25
We have investigated the effect of auditory and proprioceptive stimulations on vision in a sample of dyslexic and non-dyslexic children. Our study did not involve the multisensory temporal binding window since only the sound stimulus is brief. We used the Maddox Rod test to change the binocular balance (retinal fusion, ocular proprioception and efferent copy).
The pattern of the spatial distribution of visual losses was the same in the two groups whatever the type of stimuli tested (auditory or proprioceptive). More precisely, the spatial distribution was stochastic and did not depend on the eye covered by the Maddox rod or the body area where the proprioceptive stimulus was applied (postural muscle or not). Interestingly enough, the percentage of occurrence and the size of the VS were significantly different, in the two samples tested, only when binocular vision was manipulated. We found much more VS in the dyslexic sample compared to the controls. When controls presented VS, they did not show the same sensitivity to the stimuli as the dyslexics. In the following discussion, we consider several possible ways to explain these different effects found in the two groups.
VS and Binocular Vision
Visual perception was significantly affected in the two groups of children when the Maddox rod altered the binocular vision. However, this effect was much more important in the dyslexics. One hypothesis explaining such discrepancy between the two groups is a sensory deficiency of ocular proprioception in dyslexics.
MRT condition versus laser condition shows that appearance of VS depends on the quality of the binocular retinal signal. Because the retinal image of the same object on the 2 eyes is different during the Maddox Rod test, efferent copy is no longer sufficient to control ocular alignment. Keeping the visual axes together would then require an increase in the role of ocular proprioception.28 Non-dyslexic subjects with a low rate of VS have good binocular vision. On the other hand, all the criteria of oculomotricity were already different between the two groups of children prior to the study. Even the controversial relationship between oculomotor disorder and dyslexia reinforces the idea of mediocre quality of ocular proprioception in the group of dyslexics.11,37,38 The poor quality of the oculomotricity could thus be a factor explaining the high percentage occurrence of VS in the dyslexic group without being the direct cause of their appearance.
In fact, compared to the control condition with the laser where the two retinal images were the same, the Maddox rod induced two different retinal images. Thus the Maddox rod unbalanced the two visual axes, an effect much more pronounced in the dyslexic children suggesting a greater binocular instability and a peripheral origin of the present visual phenomenon.39 Indeed, the perceived cortical image remained the same despite the different retinal image in the Maddox rod (i.e., the horizontal red line plus a central white light point). Recent data suggest that both the corollary discharge of the oculomotor command and eye muscle proprioception provide eye position information to the brain.40,41 Under normal conditions, eye proprioception is not used for visual localization but continuously monitored when a mismatch with the efferent copy of the motor command is detected.28,42 This agrees with the idea that dyslexic children would be more affected by the manipulation of the visual input (with the MRT) that promoted the role of ocular motor control. It could also be that the Maddox rod increased the contribution of ocular proprioception by introducing a spatial discrepancy between the two eyes in the dyslexic, a group already identified as ocular balance deficient.13,14,43 In the present case the Maddox would weaken the ocular balance, already unstable in dyslexics.
VS, Multisensory Integration and Attention
Multimodal integration (e.g., audio + vision) requires greater attention. Further, because dyslexic children have attention disorders with difficulty shifting their attention between two sensory modalities one may have linked the presence of VS with attention level.44,45 Even if we did not systematically test children’s attention capacity, it should be stressed that participants’ performance did not change during the recording session, suggesting a stable attention level and consequently a limited contribution of this factor to the VS However, ocular proprioception modulates the deployment of attention in visual space, shifts visual sensitivity and codes the locus of attention in collaboration with the location of the image on the retinas.28,43,46 Thus, we cannot totally rule out a potential effect of attention associated with gaze motor control.
Interestingly, an additional effect on the VS was found after audio stimulation only in the Maddox condition while nothing was recorded in the laser condition. This suggests that multimodal integration (here audio + vision) was particularly affected when the sensory weight of ocular proprioception increased. Moreover, this effect was sensory unspecific and equally produced by both auditory and body proprioceptive stimuli, suggesting a predominant role of peripheral visual input changes.
VS and Types of Dyslexia
The stochastic appearance of VS, which hampers statistical evaluation of possible correlations, did not allow us to know whether there is a relationship between their appearance and the type or level of dyslexia.
Limits
The present study had several limitations.
First, we used a new scoring system for evaluating the multisensory integration tasks. Following an auditory or a proprioceptive stimulation, children have to tell if and where visual losses appear. Thus, comparisons with other results or broader interpretation might be limited.
Second, the study included a limited group of participants that strongly limits a generalization of our observations. Further study performed with a larger population would clarify some remaining questions (in particular the relationship with the dyslexia profile and the different characteristics of the reading deficit as well as the evolution with age or with phonological treatment). Nevertheless, because of the variability in brain structure and symptoms that can vary from patient to patient, and the existence of personal bias to a particular cognitive strategy, due to genetics or prior experience, classical aggregate statistics could produce the same weaknesses.47 Indeed, summarizing a larger group of measurements or observations would mask intersubject variability (cognitive styles) that probably also determines the response of the subject to the present task. Thus, it would not be the size of the group tested that would strengthen the conclusion of the study but the capacity to interpret intersubject variability. Relationships between variables (demographic, neural and behavioral) could typically be masked by standard averaging approaches in group analyses. The characterisation of intersubject variability would therefore complement standard group analyses and enrich our conclusions.
Third, changes in attentional processes have only been qualitatively estimated. However, there is currently an accepted consensus around the idea that this “attention” has a lot of different meanings that one single test would not be able to evaluate. “Attention” refers to both selective intention, visual search, selective decision making etc. and relies on complex multi-channel sensorimotor process.48 A dedicated study, investigating how some of these underlying processes can predict VS would thus be necessary before testing the potential bias of such processes on participants’ responses.
Conclusion
This paper shows for the first time transient visual scotoma produced by sensory stimulations associated with the manipulation of oculomotor balance, with an effect drastically higher in the dyslexic group. From a clinical point of view, it is noteworthy that the dyslexic children were tested in conditions approximating those used in learning to read i.e. to associate sounds with corresponding graphemes. The use of the Maddox rod test makes it possible to modify the ocular proprioception by accentuating a binocular equilibrium which is described as being often of poor quality in this group of children. Although there was a very significant difference between the two groups, we were not able to correlate the VS occurrence with the reading performance of the dyslexic. One possibility to confirm the link between VS and reading impairment would be to find a specific treatment reducing the occurrence of the VS and to check its effect on dyslexia.
Acknowledgments
We are grateful to our colleague Léonard Feiss MD for reviewing our English usage. This work was partly supported by a grant from the Association AF3dys. The funding sources had no role in writing of the report or the decision to submit this report for publication.
Disclosure
The authors report no conflicts of interest in this work.
References
1. Definition of Dyslexia—International Dyslexia Association. Available from: https://dyslexiaida.org/definition-of-dyslexia/.
2. Ramus F. Developmental dyslexia: specific phonological deficit or general sensorimotor dysfunction? Curr Opin Neurobiol. 2003;13:212–218. doi:10.1016/S0959-4388(03)00035-7
3. Stein J. The current status of the magnocellular theory of developmental dyslexia. Neuropsychologia. 2019;130:66–77. doi:10.1016/j.neuropsychologia.2018.03.022
4. Stein J. What is developmental dyslexia? Brain Sci. 2018;8:26. doi:10.3390/brainsci8020026
5. Tallal P. Auditory temporal perception, phonics, and reading disabilities in children. Brain Lang. 1980;9(2):182–198. doi:10.1016/0093-934X(80)90139-X
6. Eden GF, VanMeter JW, Rumsey JM, Zeffiro TA. The visual deficit theory of developmental dyslexia. Neuroimage. 1996;4(3):S108–S117. doi:10.1006/nimg.1996.0061
7. Sumerson JM. Auditory and vestibular findings in dyslexic children. Trans Pa Acad Ophthalmol Otolaryngol. 1985;37(2):196–200.
8. Nicolson RI, Fawcett AJ, Dean P. Developmental dyslexia: the cerebellar deficit hypothesis. Trends Neurosci. 2001;24(9):508–511. doi:10.1016/S0166-2236(00)01896-8
9. Bucci MP, Goulème N, Dehouck D, et al. Interactions between eye movements and posture in children with neurodevelopmental disorders. Int J Dev Neurosci. 2018;71:61–67. doi:10.1002/(ISSN)1873-474X
10. Razuk M, Barela JA. Dyslexic children suffer from less informative visual cues to control posture. Res Dev Disabil. 2014;35(9):1988–1994. doi:10.1016/j.ridd.2014.03.045
11. Quercia P, Demougeot L, Dos Santos M, Bonnetblanc F. Integration of proprioceptive signals and attentional capacity during postural control are impaired but subject to improvement in dyslexic children. Exp Brain Res. 2011;209(4):599–608. doi:10.1007/s00221-011-2593-3
12. Tiadi A, Gérard CL, Peyre H, Bui-Quoc E, Bucci MP. Immaturity of visual fixations in dyslexic children. Front Hum Neurosci. 2016;10:58. doi:10.3389/fnhum.2016.00058
13. Goulème N, Lions C, Gérard CL, Peyre H, Thai-Van H, Bucci MP. Vertical disconjugacy during reading in dyslexic and non-dyslexic children. Neurosci Lett. 2018;671:82–87. doi:10.1016/j.neulet.2018.02.016
14. Kapoula Z, Bucci MP, Jurion F, Ayoun J, Afkhami F, Brémond-Gignac D. Evidence for frequent divergence impairment in French dyslexic children: deficit of convergence relaxation or of divergence per se? Graefes Arch Clin Exp Ophthalmol. 2007;245(7):931–936. doi:10.1007/s00417-006-0490-4
15. Quercia P, Feiss L, Michel C. Developmental dyslexia and vision. Clin Ophthalmol. 2013;7:869–881. doi:10.2147/OPTH.S41607
16. Bosse ML, Tainturier MJ, Valdois S. Developmental dyslexia: the visual attention span deficit hypothesis. Cognition. 2007;104(2):198–230. doi:10.1016/j.cognition.2006.05.009
17. Facoetti A, Trussardi AN, Ruffino M, et al. Multisensory spatial attention deficits are predictive of phonological decoding skills in developmental dyslexia. J Cogn Neurosci. 2010;22(5):1011–1025. doi:10.1162/jocn.2009.21232
18. Michel C, Bidot S, Bonnetblanc F, Quercia P. Left minineglect or inverse pseudoneglect in children with dyslexia? Neuroreport. 2011;22(2):93–96. doi:10.1097/WNR.0b013e328342d2df
19. Vieira S, Quercia P, Bonnetblanc F, Michel C. Space representation in children with dyslexia and children without dyslexia: contribution of line bisection and circle centering tasks. Res Dev Disabil. 2013;34(11):3997–4008. doi:10.1016/j.ridd.2013.08.031
20. Creavin AL, Lingam R, Steer C, Williams C. Ophthalmic abnormalities and reading impairment. Pediatrics. 2015;135(6):1057–1065. doi:10.1542/peds.2014-3622
21. Hämäläinen JA, Salminen HK, Leppänen PH. Basic auditory processing deficits in dyslexia: systematic review of the behavioral and event-related potential/field evidence. J Learn Disabil. 2013;46(5):413–427. doi:10.1177/0022219411436213
22. Jones MW, Branigan HP, Parra MA, Logie RH. Cross-modal binding in developmental dyslexia. J Exp Psychol Learn Mem Cogn. 2013;39(6):1807–1822. doi:10.1037/a0033334
23. Laasonen M, Service E, Virsu V. Temporal order and processing acuity of visual, auditory, and tactile perception in developmentally dyslexic young adults. Cogn Affect Behav Neurosci. 2001;1:394–410. doi:10.3758/CABN.1.4.394
24. Hairston WD, Burdette JH, Flowers DL, Wood FB, Wallace MT. Altered temporal profile of visual-auditory multisensory interactions in dyslexia. Exp Brain Res. 2005;166(3–4):474–480. doi:10.1007/s00221-005-2387-6
25. Wallace MT, Stevenson RA. The construct of the multisensory temporal binding window and its dysregulation in developmental disabilities. Neuropsychologia. 2014;64:105–123. doi:10.1016/j.neuropsychologia.2014.08.005
26. Scheiman M, Wick B. Clinical Management of Binocular Vision: Heterophoric, Accommodative, and Eye Movement Disorders. Philadelphia: Lippincott Williams and Wilkins Ed; 2013.
27. Vagge A, Cavanna M, Traverso CE, Iester M. Evaluation of ocular movements in patients with dyslexia. Ann Dyslexia. 2015;65(1):24–32. doi:10.1007/s11881-015-0098-7
28. Balslev D, Himmelbach M, Karnath HO, Borchers S, Odoj B. Eye proprioception used for visual localization only if in conflict with the oculomotor plan. J Neurosci. 2012;32(25):8569–8573. doi:10.1523/JNEUROSCI.1488-12.2012
29. Quercia P, Pozzo T, Marino A, Guillemant AL, Cappe C, Gueugneau N. Alteration in binocular fusion modifies audiovisual integration in children. Clin Ophthalmol. 2019;4(13):1137–1145. doi:10.2147/OPTH.S201747
30. Amos FJ, Rutstein R. Vertical deviation. In: Amos FJ, editor. Diagnosis and Management in Vision Care. Amsterdam, New-York, Oxford: Butterworths; 1987:515–583.
31. Ecalle J. Timé-3. Evaluation in reading: preliminary study for the development of a new word recognition test. ANAE. 2004;79:296–304.
32. Odedys2. Cogni-Sciences. Université de Grenoble; 2005. Available from http://www.cognisciences.com/.
33. Casillas Casillas E, Rosenfield M. Comparison of subjective heterophoria testing with a phoropter and trial frame. Optom Vis Sci. 2006;83(4):237–241. doi:10.1097/01.opx.0000214316.50270.24
34. Roll JP, Vedel JP, Ribot E. Alteration of proprioceptive messages induced by tendon vibration in man: a microneurographic study. Exp Brain Res. 1989;76(1):213–222. doi:10.1007/BF00253639
35. Ribot-Ciscar E, Rossi-Durand C, Roll JP. Muscle spindle activity following muscle tendon vibration in man. Neurosci Lett. 1998;258(3):147–150. doi:10.1016/S0304-3940(98)00732-0
36. Hahn N, Foxe JJ, Molholm S. Impairments of multisensory integration and cross-sensory learning as pathways to dyslexia. Neurosci Biobehav Rev. 2014;47:384–392. doi:10.1016/j.neubiorev.2014.09.007
37. Latvala ML, Korhonen TT, Penttinen M, Laippala P. Ophthalmic findings in dyslexic schoolchildren. Br J Ophthalmol. 1994;78(5):339–343. doi:10.1136/bjo.78.5.339
38. Eden GF, Stein JF, Wood HM, Wood FB. Differences in eye movements and reading problems in dyslexic and normal children. Vision Res. 1994;34(10):1345–1358. doi:10.1016/0042-6989(94)90209-7
39. Quercia P, Quercia M, Feiss LJ, Allaert F. The distinctive vertical heterophoria of dyslexics. Clin Ophthalmol. 2015;9:1785–1797. doi:10.2147/OPTH.S88497
40. Weir CR, Knox PC, Dutton GN. Does extraocular muscle proprioception influence oculomotor control? Br J Ophthalmol. 2000;84(9):1071–1074. doi:10.1136/bjo.84.9.1071
41. Weir CR. Proprioception in extraocular muscles. J Neuroophthalmol. 2006;26(2):123–127. doi:10.1097/01.wno.0000223272.86565.74
42. Odoj B, Balslev D. Role of oculoproprioception in coding the locus of attention. J Cogn Neurosci. 2016;28(3):517–528. doi:10.1162/jocn_a_00910
43. Balslev D, Newman W, Knox PC. Extraocular muscle afferent signals modulate visual attention. Invest Ophthalmol Vis Sci. 2012;53(11):7004–7009. doi:10.1167/iovs.12-10249
44. Krause MB. Pay attention! Sluggish multisensory attentional shifting as a core deficit in developmental dyslexia. Dyslexia. 2015;21(4):285–303. doi:10.1002/dys.1505
45. Dionne-Dostie E, Paquette N, Lassonde M, Gallagher A. Multisensory integration and child neurodevelopment. Brain Sci. 2015;5(1):32–57. doi:10.3390/brainsci5010032
46. Odoj B, Balslev D. Visual sensitivity shifts with perceived eye position. J Cogn Neurosci. 2013;25(7):1180–1189. doi:10.1162/jocn_a_00382
47. Seghier ML, Price CJ. Interpreting and utilising intersubject variability in brain function. Trends Cogn Sci. 2018;22(6):517–530. doi:10.1016/j.tics.2018.03.003
48. Hommel B, Chapman CS, Cisek P, Neyedli HF, Song J-H, Welsh TN. No one knows what attention is. Atten Percept Psychophys. 2019;81(7):2288–2303. doi:10.3758/s13414-019-01846-w
 © 2020 The Author(s). This work is published and licensed by Dove Medical Press Limited. The
full terms of this license are available at https://www.dovepress.com/terms
and incorporate the Creative Commons Attribution
- Non Commercial (unported, 3.0) License.
By accessing the work you hereby accept the Terms. Non-commercial uses of the work are permitted
without any further permission from Dove Medical Press Limited, provided the work is properly
attributed. For permission for commercial use of this work, please see paragraphs 4.2 and 5 of our Terms.
© 2020 The Author(s). This work is published and licensed by Dove Medical Press Limited. The
full terms of this license are available at https://www.dovepress.com/terms
and incorporate the Creative Commons Attribution
- Non Commercial (unported, 3.0) License.
By accessing the work you hereby accept the Terms. Non-commercial uses of the work are permitted
without any further permission from Dove Medical Press Limited, provided the work is properly
attributed. For permission for commercial use of this work, please see paragraphs 4.2 and 5 of our Terms.