Back to Journals » Diabetes, Metabolic Syndrome and Obesity » Volume 13
Characteristics of Gastric Microbiota in GK Rats with Spontaneous Diabetes: A Comparative Study
Authors Kang X, Zhan L, Lu X, Song J, Zhong Y, Wang Y, Yang Y, Fan Z, Jiang X, Sun R ![]()
Received 25 January 2020
Accepted for publication 7 April 2020
Published 30 April 2020 Volume 2020:13 Pages 1435—1447
DOI https://doi.org/10.2147/DMSO.S242698
Checked for plagiarism Yes
Review by Single anonymous peer review
Peer reviewer comments 3
Editor who approved publication: Prof. Dr. Antonio Brunetti
Xin Kang,1,2 Libin Zhan,1,3 Xiaoguang Lu,2 Jianbo Song,2 Yilong Zhong,2 Yi Wang,1 Yilun Yang,4 Zhiwei Fan,2 Xiaozheng Jiang,2 Ruru Sun2
1Institute of Integrative Medicine, Dalian Medical University, Dalian, Liaoning, People’s Republic of China; 2Department of Emergency Medicine, Affiliated Zhongshan Hospital, Dalian University, Dalian, Liaoning, People’s Republic of China; 3Basic Medical College, Nanjing University of Chinese Medicine, Nanjing, Jiangsu, People’s Republic of China; 4Graduate School, Zunyi Medical University, Zunyi, Guizhou, Republic of China
Correspondence: Libin Zhan
Institute of Integrative Medicine, Dalian Medical University, Dalian, Liaoning, People’s Republic of China, Basic Medical College, Nanjing University of Chinese Medicine, Nanjing, Jiangsu, People’s Republic of China
Tel +86 25-85811569
Email [email protected]
Xiaoguang Lu
Department of Emergency Medicine, Affiliated Zhongshan Hospital, Dalian University, Dalian, Liaoning, People’s Republic of China
Email [email protected]
Background: The Goto-Kakizaki (GK) rat, developed from repeated inbreeding of glucose-intolerant Wistar rats, has been widely used to explore the development of spontaneous type-2 diabetes mellitus (T2DM). However, the gastric microbiota of GK and Wistar rats are still unclear. This study aimed to understand the gastric microbiota characteristics of GK rats by comparing it with non-diabetic Wistar rats.
Materials and Methods: Male Wistar rats and GK rats were housed in specific pathogen-free (SPF) environment for 12 weeks with free access to sterilized food and water. Body weight and random blood glucose (BG) levels were determined. At the end of the experiment, the gastric contents of the rats were collected for the identification of gastric microbiota using 16S rRNA gene sequencing.
Results: The richness of gastric microbiota in GK rats was similar to that of Wistar rats (P > 0.05). The results of Shannon, Simpson, beta diversity indices, and ANOSIM analysis showed that alpha and beta diversity of gastric microbiota in GK rats were significantly lower than that of Wistar rats (P < 0.01). Firmicutes (96.0%), Proteobacteria (1.9%) and Cyanobacteria (0.8%) were the dominant gastric microbiota in GK rats accounting for 72.9%, 14.7% and 10.9%, respectively. Linear discriminant analysis effect size (LEfSe) revealed that phylum Firmicutes and four genera (Anaerovibrio, Collinsella, Prevotellaceae_UCG_001, and Lactobacillus) were significantly abundant in the stomachs of GK rats. In contrast, seven genera (unidentified_Chloroplast, Porphyromonas, Neisseria, Rubrobacter, Veillonella, Lachnospiraceae_UCG_005, and unidentified_Erysipelotrichaceae) were significantly abundant in the stomachs of Wistar rats. Blood glucose was positively correlated with Anaerobibrio and Lactobacillus, and negatively correlated with four genera (Porphyromonas, Rubrobacter, Lachnospiraceae_UCG_005, and unidentified_Erysipelotrichaceae). In addition, chemoheterotrophy and fermentation were the most important functions of gastric microbiota.
Conclusion: The gastric microbiota of GK rats with spontaneous T2DM showed the typical characteristics of low diversity and significant enrichment of Firmicutes phylum and four genera (Anaerovibrio, Collinsella, Prevotellaceae_UCG_001, and Lactobacillus) compared with gastric microbiota of Wistar rats.
Keywords: gastric microbiota, type-2 diabetes mellitus, GK rat, wistar rat, 16S rRNA gene sequencing
Introduction
Type-2 diabetes mellitus (T2DM) is a chronic metabolic disease characterized by defects in both insulin secretion and utilization. The incidence of DM has risen vertiginously and, in 2019, as claimed by the International Diabetes Federation (IDF), reached the hallmark of 463 million individuals, IDF estimates that there will be 578 million adults with diabetes by 2030, and 700 million by 2045.1 The steadily increasing number of people living with T2DM has become a global economic and social burden.2,3
In recent years, with the progress of microbial sequencing technology, the relationship between metabolic diseases and human microbiota has been paid more and more attention, which provided a new way to elucidate the mechanism of T2DM and its complications. Due to high acidic conditions and other antimicrobial factors, the human stomach was once viewed as an inhospitable environment for microorganisms. This view was altered in 1983 with the discovery of Helicobacter pylori colonization.4 In 2006, Bik et al first found that the human gastric microbiota contained 128 species, including five dominant bacteria (Bacteroidetes, Firmicutes, Clostridium, Actinomycetes and Proteobacteria).5 The study indicated that the stomach is home to a distinct microbial ecosystem. The high number and immense diversity of microbes within the stomach could influence metabolism, tissue development, inflammation, and immunity, and gastric dysbiosis has been linked to various pathological conditions. The major stomach complications of T2DM are gastric paralysis, gastric acid deficiency, ulcers, and vitamin B12 deficiency. But their exact mechanisms remain unclear. Understanding the changes in gastric microbiota may provide an opportunity to reveal the pathogenesis of T2DM and gastric complications.
The Goto-Kakizaki (GK) rat is a spontaneous animal model for T2DM without obesity.6 The diabetic model was developed by repeated inbreeding of Wistar rats selected at the upper limit of the normal distribution for glucose tolerance by the Japanese scientists Goto and Kakizaki in 1975.7 It has been widely used to understand the development of T2DM and its complications.8–10 GK rats exhibit typical characteristics of hyperglycemia, beta-cell defects, and insulin resistance, as seen in T2DM patients.11 This study aimed to understand the gastric microbiota characteristics of GK rats by comparing it with non-diabetic Wistar rats. We hope this work could provide a reference for etiologic studies and treatment of T2DM and gastric complications in the future.
Materials and Methods
Animals and Treatments
All animal experiments were approved by the Ethics Committee of Dalian Medical University, Dalian, China. We used two kinds of rats: Wistar rats and GK rats (8-weeks-old rat, Slake Experimental Animals Co., Ltd, Shanghai, China). The use of experimental animals was in compliance with the Guide for the Care and Use of Laboratory Animals. All animals were housed individually in standard cages in an animal barrier system of specific pathogen-free (SPF) for strict microbial and parasite control and had free access to standard maintain rat chow (GB 14924.3–2010, Keao Xieli Feed Co., Ltd, Beijing, China) and sterilized water. The food was sterilized using gamma irradiation (Co-60) and ultraviolet disinfection. The animal room was maintained at 22–25°C and 50% humidity under a 12-h dark-light cycle. Body weight and random blood glucose (BG) of 8-weeks-old (initial) and 20-week-old rats (final) were detected using an electronic scale (Naliya, Qingdao, China) and Bayer Contour TS glucometer (Bayer, Hamburg, Germany). After 12 weeks, the experiment was completed. The rats were anesthetized by inhalation of isoflurane (RWD Life Technology Co., Ltd, Beijing, China), and the gastric contents were collected into individual sterile Eppendorf tubes and the frozen immediately at −80°C until DNA extraction. At the end of experiment, the rats were euthanized by intravenous injection of pentobarbital sodium (100mg/kg).
Detection and Bioinformatics Analysis of Gastric Microbiota
Total genomic DNA from sample was extracted using cetyltrimethylammonium bromide and sodium dodecyl sulfate. The extracted DNA concentration was determined using Nanodrop ND-1000 spectrophotometer (Thermo Fisher Scientific, Waltham, MA, USA). We then used polymerase chain reactions (PCR) to amplify V3 and V4 regions of the bacterial 16S ribosomal RNA gene using Phusion® High-Fidelity PCR Master Mix (New England Biolabs, Ipswich, MA, USA). Sequencing libraries were generated using a TruSeq® DNA PCR-Free Sample Preparation kit (Illumina, San Diego, CA, USA). Library quality was assessed on a Qubit@ 2.0 Fluorometer (Thermo Scientific, Waltham, MA, USA) and a bioanalyzer (2100: Agilent Technologies, Santa Clara, CA, USA). The library was sequenced on a HiSeq2500 platform for paired-end reads of 250 bp. For quality control, sequencing was performed using QIIME (V1.7.0; http://qiime.org/index.html).12 Sequencing analyses were undertaken using Uparse (v7.0.1001; http://drive5.com/uparse/).13 Sequences with ≥97% similarity were assigned to the same operational taxonomic unit (OTU). Chao1 index and Ace index were used to evaluate the richness of gastric microbiota, Shannon’s and Simpson’s indices were used to measure the alpha diversity of gastric microbiota between GK rats and Wistar rats. In addition, beta diversity parameters such as beta diversity index, Principal Coordinates Analysis (PCoA) and analysis of similarities (ANOSIM) were also measured. Dominant gastric microbiota differences between GK rats and Wistar rats were detected using linear discriminant analysis combined with effect size measurements (LEfSe), which is used for identifying the most characteristic species of different sample types.14 LEfSe results were visualized using taxonomy bar-chart. Spearman correlation analysis was used to visualize the association among gastric microbiotas (top-50) at the genus level, and the correlations of BG with gastric microbiota using a customized R package. Microbial functions were predicted using the FAPROTAX database.
Statistical Analyses
Data were expressed as mean ±SEM. Statistical analysis was performed using GraphPad Prism 6.0 (GraphPad Software, San Diego, IL, USA). Student’s t-test and Wilcoxon test were performed to examine statistical significance. The logarithmic LDA score of LEfSe analysis was set at 3.0. A P value of ≤0.05 was considered statistically significant.
Results
Body Weight and Blood Glucose Levels
As illustrated in Table 1, body weight in GK rats was lower than that of Wistar rats both 8-weeks-old and 20-weeks-old [8-weeks-old: 229.75 ±4.81 vs. 268.75 ±7.09 g, P = 0.0078; 20-weeks-old: 447.25 ±10.04 vs. 519.75 ±8.07 g, P < 0.0001]. On the other hand, blood glucose in GK rats was significantly higher than that of Wistar rats [8-weeks-old: 12.53 ±0.31 vs. 5.42 ±0.36 mmol/L, P < 0.0001; 20-weeks-old: 11.77 ±0.41 vs. 5.52 ±0.21 mmol/L, P < 0.0001].
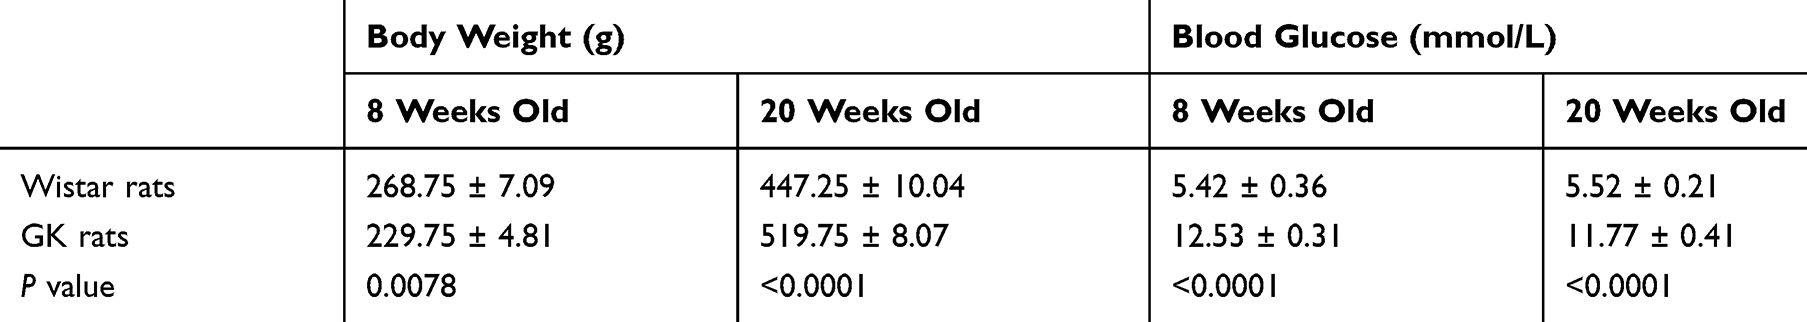 |
Table 1 Comparison of Body Weight and Blood Glucose (BG) Levels Between GK Rats and Wistar Rats. Values Represent Mean±SEM |
Overall Structural Comparison of Gastric Microbiota
Initially, a total of 740,715 raw paired-end reads at 20 weeks of age were acquired and finally, 504,758 high-quality reads were analyzed after quality control with splicing reads and filtering chimera. An average of 326 OTUs per sample was exhibited at an identity level of 97%. No significant difference prevailed between OTU numbers of gastric microbiota among GK rats and Wistar rats (333.8 ±57.08 vs. 317.5 ±23.37, P = 0.8010, Figure 1A). According to the Venn diagram in Figure 1B, there were 327 shared OTUs were perceived between the two strains of rats, with 170 OTUs unique to GK rats and 227 to Wistar rats. Rarefaction curves plateaued with current sequencing, indicating that most gastric microbiota were captured with the current sequencing depth (Figure 1C). The uniformity and relative abundance of gastric microbiota were demonstrated by the rank-abundance curve (Figure 1D). Good’s coverage index of gastric microbiota in Wistar and GK rats were more than 99% (Figure 1E). This result concluded that the library, we constructed, was large enough to represent the vast majority of gastric microbiota in rats.
 |
Figure 1 Evaluation of the sequences obtained from HiSeq2500 platform data showing the overall structural comparison of gastric microbiota between Wistar rats and GK rats. Notes: (A) The numbers of operational taxonomic unit (OTU) of gastric microbiota between the Wistar and GK rats (t-test); (B) Venn diagram of shared OTUs in the GK rats and Wistar rats; (C) rarefaction curve of V3–V4 16S data from the datasets of Wistar rats and GK rats; (D) rank-abundance analysis of gastric microbiota between the Wistar rats and GK rats. The distribution curves were ranked according to their abundance in the corresponding combined OTU sequence dataset; (E) good’s coverage estimation of gastric microbiota between the Wistar rats and GK rats (t-test). |
Chao1 and Ace indices were computed to explore the richness of gastric microbiota. The results failed to reveal any significant statistical difference in richness of gastric microbiota between Wistar rats and GK rats (Chao1: 517.7 ±116.7 vs. 478.8 ±15.31, P = 0.7617, Figure 2A; and Ace index: 409.1 ±77.77 vs. 417.1 ±28.53, P = 0.9279, Figure 2B). The alpha diversity of gastric microbiota was estimated using Shannon and Simpson indices. The alpha diversity of gastric microbiota in GK rats was significantly reduced as compared to the GK rats (Shannon index: 3.55 ±0.14 vs. 2.72 ±0.09, P = 0.0035, Figure 2C; Simpson index: 0.85 ±0.01 vs. 0.74 ±0.01, P < 0.0007, Figure 2D).
 |
Figure 2 Comparison of richness and alpha diversity of gastric microbiota between the GK rats and Wistar rats. Notes: (A) Chao1 index and (B) Ace index reflecting the richness of gastric microbiota; (C) Shannon index and (D) Simpson index showing the diversity of gastric microbiota.. These indices were analyzed using the t-test. |
Microbial Composition Analysis
The ten most predominant gastric microbial composition between GK rats and Wistar rats was then compared. At the phylum level, the dominant gastric phyla included Firmicutes, Proteobacteria, and Cyanobacteria, which accounted for 72.9%, 14.7%, and 10.9% in Wistar rats, whereas they accounted for 96.0%, 1.9%, and 0.8% in GK rats (Figure 3A). As portrayed in Figure 3B, the relative abundance of the phylumFirmicutes in GK rats was higher than that in Wistar rats (P < 0.0001); however, Proteobacteria in GK rats was significantly lower as compared to the Wistar rats (P = 0.0138). The relative abundances of the other phyla did not differ significantly between Wistar rats and GK rats (P > 0.05). At the genus level, Lactobacillus, unidentified_Chloroplast, and Clostridium_sensu_stricto_1 were the dominant gastric genera in Wistar rats, accounting for 60.5%, 10.9%, and 5.2%, respectively, but Lactobacillus (90.8%) and Romboutsia (1.3%) were the most prevalent gastric genera in GK rats (Figure 3C). Figure 3D exhibits the relative abundance of the genus Lactobacillus was higher in the GK rats than that in Wistar rats (P < 0.0001), but the relative abundance of the unidentified_Chloroplast in GK rats was significantly lower in comparison to the in Wistar rats (P = 0.0109); the other genera showed no significant difference between the two strains of rats (P > 0.05).
 |
Figure 3 Histogram illustrating the relative abundance of top-10 dominant gastric microbiota at the phylum and genus levels between the GK rats and Wistar rats. Notes: (A, B) The relative abundance of the top-10 phyla at the phylum level; (C, D) the relative abundance of the top-10 genera at the genus level. |
The differences in the microbial composition between the two strains of rats were compared with the aid of beta diversity. The beta diversity index of GK rats was found to be significantly lower than that of Wistar rats (P < 0.01, Figure 4A). Discrepancies based on OTUs with different relative abundances were analyzed by PCoA, and all sample’s OTUs were found to form two different clusters (Figure 4B)- a tight GK cluster (red dots) and a disperse Wistar rat cluster (green dots). ANOSIM result also revealed the significant difference in gastric microbiota between GK and Wistar rats (r = 0.5312, P = 0.028).
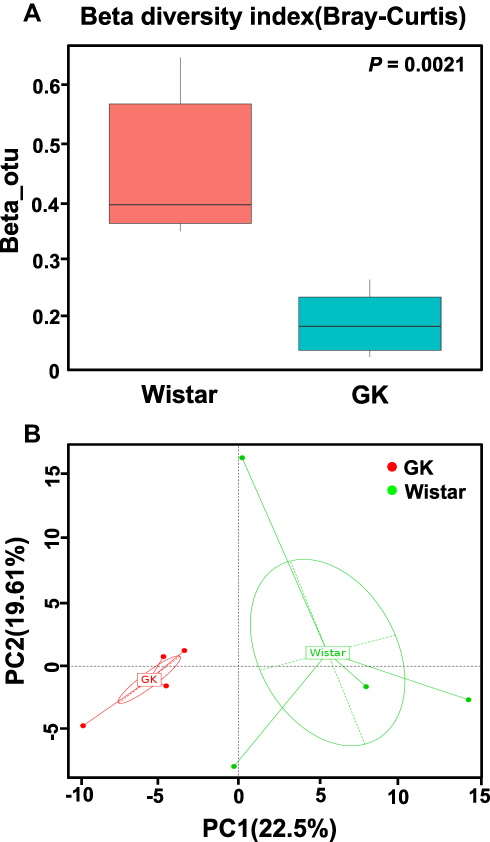 |
Figure 4 Beta diversity index and principal coordinates analysis (PCoA) of the gastric microbiota between the GK rats and Wistar rats. Notes: (A) Beta diversity index (Curtis–Bray) of gastric microbiota (Wilcoxon test); (B) PCoA of gastric microbiota (genus level) in the Wistar and GK rats based on the R-software packages: WGCNA, stats and ggplot2. Each dot represents an individual microbiota sample. The closer the samples are, the more similar the species composition is. |
Taxonomic Analysis
Significant taxonomic differences in gastric microbiota between GK rats and Wistar rats were analyzed using LEfSe (Figure 5). LEfSe results were visualized using taxonomy bar-chart. Three phyla (Proteobacteria, Cyanobacteria, and Acidobacteria) were enriched in Wistar rats, whereas phylum Firmicutes was enriched in GK rats. At the genus level, four genera (Anaerovibrio, Collinsella, Prevotellaceae UCG_001, and Lactobacillus) were significantly enriched in GK rats and seven genera (unidentified_Chloroplast, Porphyromonas, Neisseria, Rubrobacter, Veillonella, Lachnospiraceae_UCG_005, and unidentified_Erysipelotrichaceae) were enriched in Wistar rats. In these different genera, four genera (Anaerovibrio Veillonella, Lachnospiraceae, and unidentified_Erysipelotrichaceae) were classified as phylum Firmicutes, four genera (Collinsella, Lactobacillus, Rubrobacter and Collinsella) belonged to phylum ActinobacteriaPorphyromonas and Prevotellaceae_UCG_001 to phylum Bacteroidetes, and Neisseria to the phylum Proteobacteria.
 |
Figure 5 Linear discriminant analysis (LDA) plus effect size (LEfSe) at all levels of the GK rats and Wistar rats. Notes: The LDA score that was higher in the Wistar rats is shown in green, whereas one LDA score (Anaerovibrio) that was elevated in the GK rats is depicted in red. Only LDA scores ≥3 are listed. |
Correlation of Blood Glucose with Gastric Microbiota
As illustrated in Figure 6, blood glucose had a positive correlation with relative abundance of Anaerobibrio (r = 0.9940, P < 0.0001), Lactobacillus (r = 0.8927, P = 0.0028) and negative with Porphyromonas (r =–0.8312, P = 0.0105), Rubrobacter (r =–0.7329, P = 0.0386), Lachnospiraceae_UCG_005 (r =–0.8819, P = 0.0038), and unidentified_Erysipelotrichaceae (r =–0.9613, P = 0.0001). However, no significant correlation was documented between blood glucose and every other microbiota (Collinsella, Prevotellaceae_UCG_001, unidentified_Chloroplast, Neisseria, and Veillonella, all P > 0.05).
 |
Figure 6 Correlation of blood glucose (BG) with gastric microbiota. (A) Positive correlation between Anaerovibrio and BG; (B) positive correlation between Lactobacillus and BG; (C) negative correlation between Porphyromonas and BG; (D) negative correlation between Rubrobacter and BG; (E) negative correlation between Lachnospiraceae_UCG_005 and BG; (F) negative correlation between unidentified_Erysipelotrichaceaeand BG. There was no correlation between Collinsella(G), Prevotellaceae_UCG_001(H), unidentified_Chloroplast (I), Neisseria (J), Veillonella(K) and BG, respectively. |
Association Between Gastric Microbiota
The association between gastric microbiota was scrutinized using Spearman correlation analysis (Figure 7A and Table 2). Lactobacillus was negatively correlated with unidentified_Chloroplast, unidentified_Erysipelotrichaceae, Actinobacillus, Halomonas, Lachnoclostridium, Porphyromonas, and unidentified_Mitochondria, and positively correlated with Klebsiella. Unidentified_Chloroplast (the significantly enriched taxon in the stomachs of Wistar rats) exhibited a negative association with Lactobacillus and Klebsiella, and a positive association with unidentified_Erysipelotrichaceae, Actinobacillus, Halomonas, Lachnoclostridium, Gillisia, and unidentified_Mitochondria. Porphyromonas, Veillonella, Clostridium_sensu_stricto_1, Unidentified_Erysipelotrichaceae also exhibited positive or negative associations with other diverse microbiota. These results indicated that some microbiota may cooperate with other microbiota, while some microbiota may antagonize.
 |
Table 2 Association Between Gastric Microbiota |
 |
Figure 7 The network diagram and functional prediction of gastric microbiota of Wistar rats and GK rats. Notes: (A) Correlation network analysis of gastric microbiota (Spearman correlation analysis), the red connecting lines indicate a significant positive correlation between the microbiota, whereas the blue ones denote a significant negative correlation; (B) the relative abundance of different functions of gastric microbiota between the Wistar rats and GK rats. |
Metabolic Function Analysis
In order to explore the function of gastric microbiota, the gene catalog was annotated using the FAPROTAX database. As shown in Figure 7B, the primary functions of gastric microbiota included chemoheterotrophy and fermentation. The relative abundance of chemoheterotrophy and fermentation was higher in case of GK rats as compared to Wistar rats.
Discussion
Rodents are often used as model animals to replicate human diseases owing to their similarity in genome and physiology. GK is a classic rat model for Type 2 Diabetes Mellitus (T2DM), which is produced by selective inbreeding of the Wistar strain of rats. Research, conducted in recent times, has highlighted the association between T2DM and the alteration of gut microbiota structure.15,16 The present study aimed to compare the characteristics of the gastric microbiota of GK rats with spontaneous diabetes with that of Wistar rats. In this study, we elicited six findings. (i) The richness of gastric microbiota in GK rats did not differ significantly from that of Wistar rats. (ii) The alpha and beta diversities of gastric microbiota in GK rats were significantly lower than those in Wistar rats. (iii) Firmicutes (72.9%), Proteobacteria (14.7%), and Cyanobacteria (10.9%) were the predominant gastric microbiota in Wistar rats and they accounted for 96.0%, 1.9%, and 0.8% in GK rats. (iv) Four genera (Anaerovibrio, Collinsella, Prevotellaceae_UCG_001, and Lactobacillus) were significantly enriched in GK rats and seven genera (unidentified_Chloroplast, Porphyromonas, Neisseria, Rubrobacter, Veillonella, Lachnospiraceae_UCG_005, and unidentified_Erysipelotrichaceae) were abundant in Wistar rats. (iv) Blood glucose exhibited a positive correlation with Anaerovibrio and Lactobacillus, whereas, negative correlation with four genera (Porphyromonas, Rubrobacter, Lachnospiraceae_UCG_005, and unidentified_Erysipelotrichaceae). (v) Gastric microbiota showed positive or negative correlations with other microbiota. And (vi) chemoheterotrophy and fermentation were the most important functions of gastric microbiota.
Microbiome diversity is emerging as a critical determinant of host health. Loss of diversity has been associated with a variety of gastrointestinal and systemic diseases in humans and other mammals.17,18 The present study witnessed the alpha and beta diversities of gastric microbiota in GK rats (a spontaneous T2DM rat model) were lower than those of Wistar rats. Reduction in gut microbiota diversity in diabetic mice was reported by Zhang Q, which is consistent with our study.19 Therefore, these findings hypothesized that the decreased diversity of gastric microbiota may be a cardinal feature of the gastric microbiota of spontaneous T2DM. The study also elucidated that increasing a large amount of dietary fiber could reduce hemoglobin content and restore the diversity of healthy intestinal microbiota, thereby improving insulin secretion and insulin sensitivity in T2DM patients.20 So, restoration of the diversity of gastric microbiota may be considered to be a potential therapeutic approach for curing T2DM and gastric complications in the near future.
A significant difference in the ratio of dominant gastric microbiota of GK rats with spontaneous T2DM with that of the Wistar rats without diabetes was evident for our findings. The proportion of phylum Firmicutes in the stomach of GK rats was as high as 96%, while that of Wistar rats was only 72.9%. In accordance with our study, research conducted by Delgado also confirmed Firmicutes to be the most abundant phylum in the stomach of healthy people.21 The enrichment of gastric microbiota in the two strains of rats at the genus level was compared to elucidate further, which genus was responsible for the increase in phylum Firmicutes. We found that the proportion of genus Lactobacillus was 62% in Wistar rats, and it drastically increased to 90.8% in GK rats. Genus Lactobacillus is an important member of the phylum Firmicutes. It can be presumed that the increased proportion of the genus Lactobacillus may contribute primarily to the increase of Firmicutes in the stomach of GK rats with spontaneous diabetes. The Lactobacillus is often considered as a probiotic beneficial for human health.22 An increase in the abundance of four Lactobacillus species in T2DM patients was reported by Karlsson et al.23 Furthermore, they found a positive correlation between Lactobacillus species with blood glucose and glycated hemoglobin (HbA1c). Consistent with these results, the present study also found a strong positive correlation between Lactobacillus and blood glucose. However, the specific role of the increase of Lactobacillus in spontaneous T2DM still remains unclear. In-depth research in the future should try to decipher the differences in the species and strains of the genus Lactobacillus. The same species or strain may play different roles under different survival conditions.
LEfSe analysis showed that genus Anaerovibrio, Collinsella, Prevotellaceae_UCG_001 were also significantly enriched in the stomach of GK rats. Anaerovibrio, which exists as curved or spiral rods, could be chemoorganotroph and decomposes a limited number of sugars.24,25 It is a well-known rumen lipolytic bacterium. GK rat is an animal model with spontaneous T2DM without obesity. Anaerovirio may indulge in the fat degradation of GK rats and which may be one of the important reasons for the formation of this special animal model. Strong positive correlation between Anaerovibrio and blood glucose was also established by correlation analysis. The genus Collinsella belongs to the family Coriobacteriaceae and the phylum Actinobacteria. The Collinsella as a dominant taxon of the family Coriobacteriaceae is considered as pathobionts. Gomez–Arango et al reported a positive correlation between Collinsella with circulating levels of insulin, and a low intake of dietary fiber may enable overgrowth of Collinsella and alter the overall fermentation pattern in microbiota.26 Prevotellaceae_UCG_001 belonged to phylum Bacteroidetes was enriched in the stomach of GK rats. However, there is little study on its role. In contrast, seven genera (unidentified_Chloroplast, Porphyromonas, Neisseria, Rubrobacter, Veillonella, Lachnospiraceae_UCG_005, and unidentified_Erysipelotrichaceae) were found to be enriched in the stomach of Wistar rats. Interestingly, correlation analysis of gastric microbiota showed that blood glucose level was negatively associated with four genera (Porphyromonas, Rubrobacter, Lachnospiraceae_UCG_005, and unidentified_Erysipelotrichaceae). Henceforth, the close correlation observed between gastric microbiota and blood glucose levels postulated the fact that this gastric microbiota may be associated with the pathogenesis of spontaneous T2DM. However, extensive research is essential for further validation.
In summary, the gastric microbiota of GK rats with spontaneous T2DM showed the typical characteristics of low diversity and significant enrichment of Firmicutes phylum and four genera (Anaerovibrio, Collinsella, Prevotellaceae_UCG_001, and Lactobacillus) as compared to Wistar rats. In addition, different gastric microbiota have complex relationships with each other. This work will aid in magnifying the understanding of gastric microbiota of diabetes and even shade light to identify a target for clarifying the pathophysiological mechanism or treating T2DM and gastric complications.
Acknowledgments
This work was supported by the National Natural Science Foundation of China (81230084, 817301111 and 81673801).
Disclosure
The authors report no conflicts of interest in this work.
References
1. Saeedi P, Petersohn I, Salpea P, et al. Global and regional diabetes prevalence estimates for 2019 and projections for 2030 and 2045: results from the International Diabetes Federation Diabetes Atlas, 9th edition. Diabetes Res Clin Pract. 2019;157:107843. doi:10.1016/j.diabres.2019.107843
2. Li XY, Shen L, Ji HF. Astragalus alters gut-microbiota composition in type 2 diabetes mice: clues to its pharmacology. Diabetes Metab Syndr Obes. 2019;17:771–778. doi:10.2147/DMSO.S203239
3. Bommer C, Sagalova V, Heesemann E, et al. Global economic burden of diabetes in adults: projections from 2015 to 2030. Diabetes Care. 2018;41(5):963–970. doi:10.2337/dc17-1962
4. Moodley Y, Linz B, Bond RP, et al. Age of the association between Helicobacter pylori and man. PLoS Pathog. 2012;8(5):e1002693. doi:10.1371/journal.ppat.1002693
5. Bik EM, Eckburg PB, Gill SR, et al. Molecular analysis of the bacterial microbiota in the human stomach. Proc Natl Acad Sci USA. 2006;103(3):732–737. doi:10.1073/pnas.0506655103
6. Goto Y. GK rat as a model of nonobese, noninsulin-dependent diabetes. Selective breeding over 35 generations. Front Diabetes Res Less Anim Diabetes. 1988;301–303.
7. Goto Y, Kakizaki M, Masaki N. Spontaneous diabetes produced by selective breeding of normal wistar rats. Proc Jpn Acad. 1975;51(1):80–85. doi:10.2183/pjab1945.51.80
8. Kraemer FB, Ginsberg HN. Gerald M. Reaven, MD: demonstration of the central role of insulin resistance in type 2 diabetes and cardiovascular disease. Diabetes Care. 2014;37(5):1178–1181. doi:10.2337/dc13-2668
9. Zhang W, Meng Y, Fu S, et al. Transcriptome changes of skeletal muscle RNA-seq speculates the mechanism of postprandial hyperglycemia in diabetic Goto-Kakizaki rats during the early stage of T2D. Genes (Basel). 2019;10(6):406. doi:10.3390/genes10060406
10. Kuwabara WMT, Panveloski-Costa AC, Yokota CNF, et al. Comparison of Goto-Kakizaki rats and high fat diet-induced obese rats: are they reliable models to study type 2 diabetes mellitus? PLoS One. 2017;12(12):e0189622. doi:10.1371/journal.pone.0189622
11. Portha B, Lacraz G, Kergoat M, et al. The GK rat beta-cell: a prototype for the diseased human beta-cell in type 2 diabetes? Mol Cell Endocrinol. 2009;297(1–2):73–85. doi:10.1016/j.mce.2008.06.013
12. Bokulich NA, Subramanian S, Faith JJ, et al. Quality-filtering vastly improves diversity estimates from illumina amplicon sequencing. Nat Methods. 2013;10(1):57–59. doi:10.1038/nmeth.2276
13. Edgar RC. UPARSE: highly accurate OTU sequences from microbial amplicon reads. Nat Methods. 2013;10(10):996–998. doi:10.1038/nmeth.2604
14. Segata N, Izard J, Waldron L, et al. Metagenomic biomarker discovery and explanation. Genome Biol. 2011;12(6):R60. doi:10.1186/gb-2011-12-6-r60
15. Gurung M, Li Z, You H, et al. Role of gut microbiota in type 2 diabetes pathophysiology. EBioMedicine. 2020;51:102590. doi:10.1016/j.ebiom.2019.11.051
16. Tong X, Xu J, Lian F, et al. Structural alteration of gut microbiota during the amelioration of human type 2 diabetes with hyperlipidemia by metformin and a traditional chinese herbal formula: a multicenter, randomized, open label clinical trial. mBio. 2018;9(3):e02392–17. doi:10.1128/mBio.02392-17
17. Fallucca F, Fontana L, Fallucca S, Pianesi M. Gut microbiota and Ma-Pi 2 macrobiotic diet in the treatment of type 2 diabetes. World J Diabetes. 2015;6(3):403–411. doi:10.4239/wjd.v6.i3.403
18. Nuli R, Cai J, Kadeer A, Zhang Y, Mohemaiti P. Integrative analysis toward different glucose tolerance-related gut microbiota and diet. Front Endocrinol (Lausanne). 2019;10:295. doi:10.3389/fendo.2019.00295
19. Zhang Q, Yu H, Xiao X, Hu L, Xin F, Yu X. Inulin-type fructan improves diabetic phenotype and gut microbiota profiles in rats. PeerJ. 2018;6:e4446. doi:10.7717/peerj.4446
20. Liping Z, Feng Z, Xiaoying D, et al. Gut bacteria selectively promoted by dietary fibers alleviate type 2 diabetes. Science. 2018;6380:1151–1156.
21. Delgado S, Cabrera-Rubio R, Mira A, Suárez A, Mayo B. Microbiological survey of the human gastric ecosystem using culturing and pyrosequencing methods. Microb Ecol. 2013;65(3):763–772. doi:10.1007/s00248-013-0192-5
22. Goldstein EJ, Tyrrell KL, Citron DM. Lactobacillus species: taxonomic complexity and controversial susceptibilities. Clin Infect Dis. 2015;60(suppl_2):S98–S107. doi:10.1093/cid/civ072
23. Karlsson FH, Tremaroli V, Nookaew I, et al. Gut metagenome in European women with normal, impaired and diabetic glucose control. Nature. 2013;498(7452):99–103. doi:10.1038/nature12198
24. Verkley AJ, Ververgaert PH, Prins RA, van Golde LM. Lipid-phase transitions of the strictly anaerobic bacteria Veillonella parvula and Anaerovibrio lipolytica. J Bacteriol. 1975;124(3):1522–1528. doi:10.1128/JB.124.3.1522-1528.1975
25. Hirao T, Sato M, Shirahata A, Kamio Y. Covalent linkage of polyamines to peptidoglycan in Anaerovibrio lipolytica. J Bacteriol. 2000;182(4):1154–1157. doi:10.1128/JB.182.4.1154-1157.2000
26. Gomez-Arango LF, Barrett HL, Wilkinson SA, et al. Low dietary fiber intake increases Collinsella abundance in the gut microbiota of overweight and obese pregnant women. Gut Microbes. 2018;9(3):189–201. doi:10.1080/19490976.2017.1406584
 © 2020 The Author(s). This work is published and licensed by Dove Medical Press Limited. The
full terms of this license are available at https://www.dovepress.com/terms
and incorporate the Creative Commons Attribution
- Non Commercial (unported, 3.0) License.
By accessing the work you hereby accept the Terms. Non-commercial uses of the work are permitted
without any further permission from Dove Medical Press Limited, provided the work is properly
attributed. For permission for commercial use of this work, please see paragraphs 4.2 and 5 of our Terms.
© 2020 The Author(s). This work is published and licensed by Dove Medical Press Limited. The
full terms of this license are available at https://www.dovepress.com/terms
and incorporate the Creative Commons Attribution
- Non Commercial (unported, 3.0) License.
By accessing the work you hereby accept the Terms. Non-commercial uses of the work are permitted
without any further permission from Dove Medical Press Limited, provided the work is properly
attributed. For permission for commercial use of this work, please see paragraphs 4.2 and 5 of our Terms.