Back to Journals » Clinical Ophthalmology » Volume 15
Changes of Neuroretinal Rim and Retinal Nerve Fiber Layer Thickness Assessed by Optical Coherence Tomography After Filtration Surgery in Glaucomatous Eyes
Authors Koenig SF, Hirneiss CW
Received 22 December 2020
Accepted for publication 15 March 2021
Published 3 June 2021 Volume 2021:15 Pages 2335—2344
DOI https://doi.org/10.2147/OPTH.S298045
Checked for plagiarism Yes
Review by Single anonymous peer review
Peer reviewer comments 2
Editor who approved publication: Dr Scott Fraser
Susanna Friederike Koenig,1 Christoph Wolfgang Hirneiss2
1Moorfields Eye Hospital NHS Foundation Trust, London, EC1V 2PD, UK; 2Ludwig-Maximilians University, Eye Clinic, Campus Innenstadt, Munich, D-80336, Germany
Correspondence: Susanna Friederike Koenig
Moorfields Eye Hospital NHS Foundation Trust, 162 City Road, London, EC1V 2PD Email [email protected]
Purpose: Lowering the intraocular pressure (IOP) in patients with primary open-angle glaucoma (POAG) with filtration surgery can induce morphological changes to the bulbus and structures of the retina. In this study, we have evaluated changes of Bruch’s membrane-based parameters and retinal nerve fiber layer (RNFL) derived by spectral-domain optical coherence tomography (SD-OCT) in eyes that have undergone glaucoma filtration surgery.
Patients and Methods: SD-OCT imaging of the optic nerve head (ONH) and of the RNFL was performed in 54 eyes of 54 patients with medically uncontrolled POAG before and after IOP-lowering surgery (trabeculectomy or deep sclerectomy). The ONH parameter minimum rim width (MRW) and the size of the Bruch’s membrane opening (BMO-Area) were derived from 24 radial B-scans centered on the ONH.
Results: The average preoperative IOP was 23.1 ± 7.5 mmHg. One month postoperatively, the average IOP decreased to 12.1 ± 4.6 mmHg (p < 0.01), which caused a significant increase in the thickness of neuroretinal rim. There was no significant change in the automatically detected BMO-Area (p = 0.32). The pressure-related increase in MRW correlated well with the postoperative IOP and cup-to-disc ratio (CDR). In regression analysis, the alteration in thickness of the neuroretinal rim could be well predicted in a model including CDR, change of IOP and mean deviation (MD) (R2 = 0.414, p < 0.001). RNFL showed a significant increase as well.
Conclusion: IOP-lowering surgery in patients with medically uncontrolled POAG causes an increased thickness of the SD-OCT derived ONH parameters. The changes of the RNFL after surgery showed no significant correlations with IOP changes. In contrast to this, highly significant correlations of MRW values with the IOP could be observed. The BMO-Area remained completely stable A preferred use of RNFL for follow-up should be discussed.
Keywords: glaucoma, optic nerve head, ONH, OCT, retinal nerve fiber layer, RNFL, Bruch’s membrane opening, BMO
Introduction
Spectral-domain optical coherence tomography (SD-OCT) is a common non-invasive tool used in glaucoma diagnostics to objectively distinguish between healthy and diseased individuals by detecting and assessing changes in neuroretinal tissue at different locations of the optic nerve head (ONH). This covers Bruch’s membrane opening (BMO) parameters including minimum rim width (BMO-MRW) and minimum rim area (BMO-MRA) as well as peripapillary retinal nerve fiber layer (RNFL) thickness which is measured typically 3.5 mm from the center of the ONH. Retinal structures between the internal limiting membrane (ILM) and the Bruch’s membrane opening can be analyzed. Early detection of glaucomatous damage is particularly important; however, it is also essential to be able to monitor the eyes for subsequent change. Strong markers for glaucomatous progression are changes in visual field as well as disc appearance, traditionally based on photographs of the ONH albeit without quantification of change.1 Nevertheless, many glaucoma patients show alterations to the RNFL or the optic disc itself in the absence of worsening of the visual field (VF).2 Additionally, structure-function analysis has shown strong correlations between SD-OCT derived parameters and visual field loss.3,4 Different studies have indicated satisfactory agreement between changes in optic disc photographs and progressive RNFL loss.5,6
Over the last years, the assessment and interpretation of SD-OCT derived parameters have gained more and more importance in patients’ individual follow-up in monitoring and managing the progression of glaucomatous damage. In addition to this, these parameters showed more diagnostic impact than those obtained by confocal scanning laser tomography (CSLT).7–10 RNFL thickness has been shown to be superior to BMO-based parameters, respectively.11 Studies indicate it to be relatively low variable over long-term follow-up and therefore more reliable in differentiating between progression and noise.12,13 Alterations in its reflectance may be beneficial in assessing glaucomatous progression.14 The relationship between RNFL and VF is complex and relates to the severity of the disease. Gardiner et al could demonstrate that sensitivity loss in visual field defects could be reasonably well correlated with localized RNFL thinning.15 However, it could also be shown that not only BMO-based parameters but also RNFL thickness did not show relevant intraday variability in SD-OCT, whereas these parameters appear to be sensitive to experimentally induced changes of the intraocular pressure (IOP).16,17 Structural alterations in reversal of disc cupping are common after significant pressure changes following IOP-lowering surgery.18 Furthermore, significant improvement of the visual field is known after filtration surgery, which may also be dependent on the severity of the disease.19
SD-OCT-based changes in RNFL thickness have been assessed after surgical IOP-lowering by means of trabeculectomy. No significant alteration in peripapillary RNFL before or after the surgery was observed.18 Gietzelt et al have shown a major IOP dependency on the BMO-based parameters (BMO-MRW and BMO-MRA), whereas VF function did not show any influence postoperatively (post-drainage device surgery, trabeculectomy). RNFL seemed rather stable in long-term follow-up.20,21
The purpose of this study is to evaluate morphological changes of the optic nerve and the retina in patients with medically uncontrolled primary open-angle glaucoma (POAG) with IOP-lowering filtration surgery (trabeculectomy or deep sclerectomy with mitomycin C (MMC), respectively).
Patients and Methods
This study was approved by the local Ethics Committee of the Ludwig-Maximilians University of Munich. Since all data was merged immediately after assessment, no single patient can be identified, and data confidentiality was protected. No written consent was necessary, according to the local Ethics Committee of the Ludwig-Maximilians University of Munich. Study procedures comply with the standards of the declaration of Helsinki (DRKS00022556).
Fifty-four eyes of 54 patients (61.1% female) with medically uncontrolled POAG were included in this retrospective longitudinal study. These eyes received IOP-lowering filtration surgery (trabeculectomy or deep sclerectomy with MMC, respectively) at the Department of Ophthalmology of Munich, Ludwig-Maximilians University in 2017, carried out by one single surgeon.
Inclusion criteria were medically uncontrolled POAG and the presence of preoperative SD-OCT examination of the ONH (1 day before surgery) as well as one follow-up ONH SD-OCT in the first month after surgery (28 ± 2 days) on the operated eye. There was no selection of patients based on the MD of the VF. Patients with mild, moderate and severe glaucoma were included.22 Exclusion criteria were unsatisfactory image quality of SD-OCT and acquired segmentation errors that could not be corrected manually. Additional parameters were gathered and included from recorded examinations and the given medical history of the patient: best-corrected visual acuity (BCVA), intraocular pressure (IOP) at examinations assessed by means of Goldmann applanation tonometry, clinically assessed cup-to-disc-ratio (CDR), topical and systemic IOP-lowering medication and the mean deviation (MD) of the visual field (VF). Glaucoma was diagnosed according to the 4th Edition of Guidelines of the European Glaucoma Society (EGS)23 2014.
Imaging of the Optic Nerve Head and Retinal Nerve Fiber Layer
Morphometric analysis of the optic disc was performed by using a Spectralis SD-OCT device (Heidelberg Engineering GmbH, Heidelberg, Germany) according to standard operating procedures. The quality of the images was assessed manually. A light source of 870 nm was used according to the standard imaging procedure. The ONH and peripapillary RNFL were imaged using prototype software (HEYEX, Heidelberg Engineering). The scanning pattern, containing 24 radially equidistant B-scans, each of them with an aerial distance of 7.5 degrees of arc, was first centered on the ONH. The foveal pit was automatically detected, followed by two BMO points in each of two radial B-scans that were perpendicular to each other. With the help of these points, the BMO-Fovea axis was detected autonomously, which served as a reference for the radial B-scans. Circular peripapillary scans were obtained with a circle of 12°, 14° and 16° and diameter of 3.5 mm, 4.1 mm and 4.7 mm to measure RNFL. They were then allocated to the superior, inferior, nasal and temporal area of the ONH or RNFL accordingly. The centration of the scans was manually controlled by the examiners; errors in detection of the Bruch’s membrane and the ILM were corrected.
Eyes with poor quality scans (B-scans, where the internal limiting membrane could not be segmented and/or image quality score < 20) were excluded. OCT-based parameters were calculated using the standard operating software tool provided by Heidelberg Engineering, including data export.
In this study, the 3.5 mm diameter peripapillary RNFL was used for further analysis.
Trabeculectomy Surgery for Glaucoma
Trabeculectomy with application of mitomycin C (MMC) (28/54) was performed by one single experienced surgeon according to the standard operating procedures of the department. A fornix-based approach was performed. After creation of a fornix-based conjunctival flap in an upper quadrant, the surface of the sclera was carefully cauterized by using a monopolar device. Mitomycin C was applied to the sclera for three minutes and subsequently rinsed out using a balanced salt solution. An almost 5 mm limbus-based rectangular flap was created through a dissection of the sclera, followed by a 1×1 mm descemetectomy and peripheral iridotomy. Then, the scleral flap was repositioned and sutured tightly using 10–0 nylon sutures. No releaseable sutures were used. In case of persistent hypertension postoperatively, a laser suturolysis could then be performed, which was not the case in our study.
Deep Sclerectomy for Glaucoma
Deep sclerectomy with the application of MMC (26/54) was performed by one single experienced surgeon according to the standard operating procedures of the department. Similar to the trabeculectomy, a fornix-based approach in an upper quadrant was performed. After creating a fornix-based conjunctival flap, the scleral surface was carefully cauterized. Mitomycin C was applied to the sclera for three minutes and then rinsed out using a balanced sodium-chloride solution. A limbus-based superficial scleral flap of one-third thickness was fashioned. A second deep scleral flap was then created with dissection into the clear cornea in order to expose the Schlemm canal. The deep flap was then excised, and the superficial scleral flap was put back into position and sutured tightly using 10–0 nylon sutures. Laser goniopuncture was not performed in any of the patients included in this study.
In both surgery techniques, the number of sutures was the surgeon’s own personal decision. Operations were performed under local or general anesthesia according to the patient’s requirements and/or the surgeon’s recommendations, as well as the patient’s preference. Eyes with technical variations in surgical procedures in accordance with the surgeon’s clinical decision were also included in our analysis.
Visual Field Testing and Analysis
Each patient underwent visual field testing before surgery. Standard operating procedures included perimetric assessment via Humphrey Field Analyzer II (HFA) (Zeiss AG, Jena, Germany) with a SITA 24–2 testing white-on-white standard pattern. Data were analyzed using PeriData 3.1 (PeriData Software GmbH, Huerth, Germany). Refraction-matching lens correction was carried out and visual field testing was performed on each eye separately.
Data Analysis
The OCT software automatically detected the internal limiting membrane (ILM) and the 48 BMO points of the 24 radial B-scans. Segmentation was manually checked and corrected if necessary. BMO-based parameters were computed as already described. The shortest distance from each BMO-point to the ILM in each B-scan was defined as BMO-MRW (48 values per eye). The overall global BMO-MRW was calculated or, more accurately, put into sectors consisting of four 40° BMO-MRW (superior-nasal, inferior-nasal, inferior-temporal and superior-temporal) as well as one 90° (temporal) and 110° (nasal) BMO-MRW sector. The corresponding global and sectoral peripapillary RNFL values were also calculated.
Statistical analyses were performed using SPSS Statistics (Version 25.0; IBM Corp, Armonk, New York, USA). Normal distribution of data was tested by means of Kolmogorov–Smirnov test. A t-Test was performed for paired samples comparing means on normal distribution; the Spearman rho (r2) was used to characterize correlations between changes in morphometric parameters and IOP levels. Statistical significance was set to p < 0.05. Data were also fitted to multiple linear regression analyses to assess the predictive value of clinical and structural parameters on the prediction of the change in thickness of the neuroretinal rim by IOP reduction.
Results
Fifty-four eyes of 54 patients (33 females, 21 males; mean age 64.4 years) with IOP-lowering surgery (trabeculectomy or deep sclerectomy with MMC, respectively) due to medically uncontrolled, mainly severe POAG (mean MD −12.7) were included into this retrospective longitudinal study. They were all subjected to an OCT examination of the ONH including BMO and RNFL, one day before and one month after surgery. Demographic and baseline as well as postoperative data are summarized in Table 1.
 |
Table 1 Patients’ Characteristics Including Cup-to-Disc Ratio (CDR), Intraocular Pressure (IOP), Visual Field Parameters Mean Deviation (MD) and Pattern Standard Deviation (PSD) |
The average preoperative IOP was 23.1 ± 7.5 mmHg with a mean number of IOP-lowering topical medications of 0.7 ± 1.3. Furthermore, 36 patients were taking systemic anti-glaucomatous medication as well. One month postoperatively, the IOP declined by an average of 52.4% to 12.1 ± 4.6 mmHg (p < 0.01) with a mean number of 0.5 ± 1.1 of topical IOP-lowering medications and no patient requiring systemic acetazolamide. The decrease in IOP caused a significant change in the thickness of the neuroretinal rim (paired t-test, p < 0.001). Alteration of the MRW is shown in Table 2, with the nasal-superior sector being altered the most. The relatively mean changes were an increase in an average 13.7 ± 32.7% (p < 0.0001) in the nasal-superior, 13.0 ± 18.8% (p < 0.0001) in the nasal, 7.8 ± 11.0% (p < 0.0001) in the nasal-inferior, as well as 11.8 ± 26.4% (p < 0.0001) in the temporal-inferior, 9.6 ± 18.1% (p < 0.0001) in the temporal and 11.6 ± 20.9% (p < 0.0001) in the temporal-superior sector. Pre- and postoperative measurements are displayed in Figure 1. Changes in RNFL according to six peripapillary sectors are shown in Table 3, with the temporal sector being changed the most. These accounted for an increase in thickness of an average of 4.7 ± 2.7% (p = 0.046) in the nasal-superior, 5.7 ± 0.3% (p = 0.001) in the nasal, 3.3 ± 3.7% (p = 0.029) in the nasal-inferior, 2.9 ± 1.7% (p = 0.099) in the temporal-inferior, 6.6 ± 5.5% (p = 0.001) in the temporal and 2.6 ± 10.3% (p = 0.211) in the temporal-superior sector, respectively. Figure 2 demonstrates these changes in each sector. The automatically detected area of the opening of the Bruch’s membrane showed no significant changes (p = 0.32). Pearson correlation led to the assumption that the increase in MRW indicated an overall significant correlation with the postoperative IOP as well as with the cup-to-disc ratio but a much less significant correlation with the change of IOP (Table 4). RNFL also showed higher values one month postoperatively. These changes were significant in almost all sectors (but the temporal-superior one) and did not appear to strongly correlate with IOP alteration (Table 5).
 |
Table 2 Mean Sectorial MRW Values ± Standard Deviation Before and After Glaucoma Surgery as Well as Mean Change and p-values (Paired t-Test) |
 |
Table 3 Mean RNFL Thickness Values ± Standard Deviation Before and After Glaucoma Surgery as Well as Mean Change and p-values (Paired t-Test) |
 |
Table 4 Pearson Correlation Coefficients Between Sectorial Changes of the MRW and Cup-to-Disc Ratio (CDR), Postoperative IOP and Reduction (Change) of IOP Due to Surgery |
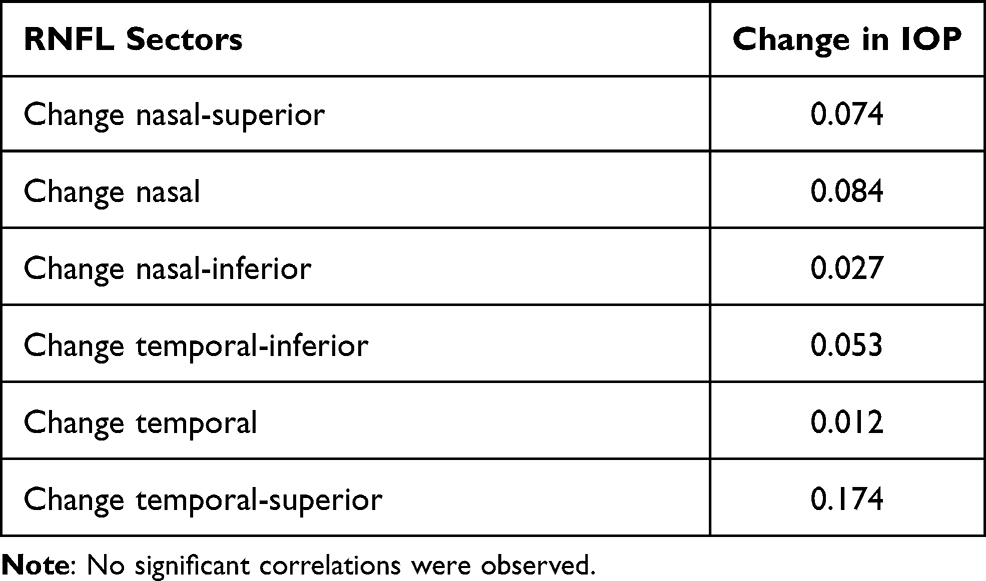 |
Table 5 Pearson Correlation Coefficients Between Sectorial Changes of the Retinal Nerve Fibre Layer (RNFL) and Reduction (Change) of IOP Due to Surgery |
 |
Figure 1 Scatter plots of mean MRW thickness values (µm; n = 54) before and after surgery in the nasal-superior (NS), nasal (N), nasal-inferior (NI), temporal-inferior (TI), temporal (T) and temporal-superior (TS) sector, respectively. |
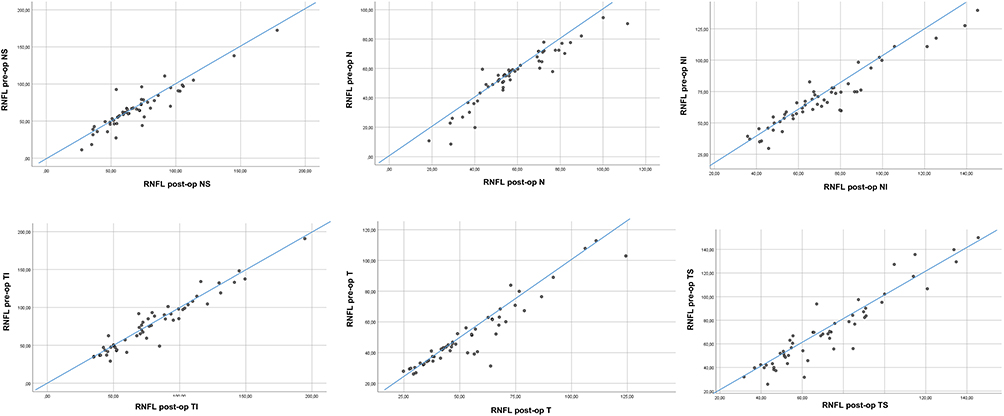 |
Figure 2 Scatter plots of mean RNFL thickness values (µm; n = 54) before and after surgery in the nasal-superior (NS), nasal (N), nasal-inferior (NI), temporal-inferior (TI), temporal (T) and temporal-superior (TS) sector, respectively. |
Regression analysis showed a good prediction of the increase in thickness of the neuroretinal rim (most notably temporal-superior MRW) in a model including CDR, change of IOP and MD (R2 = 0.414, p < 0.001).
Discussion
Detecting and assessing rates of progression are essential in glaucoma management as they help to identify those patients making rapid progress and determine continuative treatment. In addition to VF changes and disc photographs, the SD-OCT derived parameters BMO-MRA, BMO-MRW and RNFL have gained more and more importance regarding the management and follow-up of glaucoma during the last years. Structural alterations such as changes to the optic disc or the RNFL are known to frequently occur in the absence or even advance of deterioration in automated perimetry. This provides a chance to commence or increase treatment before restriction of VF.2
Although OCT has been widely adopted in glaucoma management, uncertainty remains as to which parameter serves best in the detection and management of its progression. Ideally, it should be highly reproducible and useful at all stages of the disease.
Our study results show a high IOP-dependency of the SD-OCT derived parameter BMO-MRW. One month after IOP-lowering surgery (trabeculectomy or deep sclerectomy with MMC, respectively), there was a highly significant increase in thickness of BMO-MRW in all the peripapillary sectors with a rise of standard deviation as well. This was accentuated more nasally than temporally. A strong correlation of the increase in BMO-MRW with the postoperatively lower IOP was determined in almost all sectors, whereas it correlated significantly overall with the CDR. The BMO-Area did not change at all but remained completely stable. The SD-OCT derived parameter RNFL also showed significant changes in thickness with increased standard deviation one month after surgery in all sectors except the temporal-superior one. However, alteration in thickness of RNFL did not correlate significantly with change in IOP.
In previous studies, structural reversal of disc cupping in ONH morphology following glaucoma surgery was shown by CSLT over a period of up to eight months. The reduction of IOP seemed to be the most influencing parameter.24 This phenomenon could also be observed using SD-OCT derived parameters.
BMO-Area is known to be larger in size in glaucoma patients than compared to healthy individuals.7,25 However, many studies did not take this particular parameter into account.26,27
In our study, BMO-Area did not show any change after glaucoma surgery, whereas other authors reported pressure-dependent alterations.20 Various studies which included this parameter in order to define glaucoma did not show the superiority of BMO-MRW over RNFL.11,28 On the contrary, one study group even evaluated RNFL to be significantly greater in diagnostic power than BMO-MRW.28
Different studies could demonstrate that the OCT-derived parameters BMO-MRW and BMO-Area show excellent reproducibility in healthy subjects and glaucoma patients, which is similar to those of RNFL measurements.29,30 BMO-MRW has been proposed as a highly reliable parameter for diagnostic accuracy in glaucoma, as well as having a strong correlation with conventional rim parameters.7,25 Other authors have also been able to show that BMO-MRW and BMO-MRA react strongly to surgically induced IOP-lowering.20,21 Sharma et al demonstrated changes in the neural tissues of the ONH based on BMO-derived indices. Experimentally induced elevation of IOP resulted in a significant reduction in BMO-MRW in glaucoma eyes in contrast to healthy and ocular hypertensive eyes.31 Our results indicate an increase in BMO-MRW that is accentuated more nasally than temporally, which may show that the nasal part has a better possibility of recovery and appears to be more robust. Furthermore, eyes with higher preoperative IOP in our study population showed a greater increase in BMO-MRW postoperatively. This fact might be challenging in follow-up of mild glaucoma, since these effects are difficult to observe in cases, where the neuroretinal rim does not show much glaucomatous change. In contrast to this, RNFL did not indicate similar changes, particularly the temporal-inferior sector remained very stable.
As shown in regression analysis, CDR, change of IOP and MD indicate a good prediction of change in BMO-MRW. This is most notable in the temporal-superior sector and may be an indicator for a potential recovery of morphological structures of the ONH based on OCT-parameters. A greater effect might even be shown in glaucomatous eyes with a smaller cupping.
The OCT-derived parameter RNFL is independent of disc size, whereas ONH size is important as eyes with larger ONHs have less nerve fiber crowding per square millimeter of the disc area.32,33 Active remodeling of connective tissue in glaucoma may also affect the structural profile of the ONH.11,34 A good reproducibility and agreement could be demonstrated in repeat RNFL assessments in healthy subjects as well as in glaucoma patients.35–37 Previous studies have revealed RNFL to be less influenced by IOP in the early stages of glaucomatous ONH changes and therefore more trustworthy in assessing the progression of the glaucomatous changes.11 This finding was also confirmed by Gietzelt et al who did not find alterations in RNFL thickness during long-term follow-up after IOP-lowering surgery by means of trabeculectomy.20 However, other studies have indicated reactions to this parameter to diurnal as well as experimentally induced IOP-spikes.16,17 Overall, reports on changes in RNFL thickness after IOP-lowering treatment have been equivocal. Aydin et al were able to show a postoperative increase in RNFL using a prototype OCT.38 Other studies confirmed this finding by using a scanning laser polarimetry.39 On the contrary, different studies indicated no significant RNFL alterations after surgery.18,40 Kim et al showed a significant reduction of average RNFL thickness in the early postoperative period for different glaucoma types.41 In primary angle closure glaucoma (PACG) RNFL damage patterns were found to be different in acute and chronic IOP elevated courses. In acute PACG, a swelling and thickening of the peripapillary RNFL right after an acute IOP elevation was observed, which resulted in thinning and atrophy over time. In chronic PACG, RNFL damage patterns were more diffuse.42
Nevertheless, our study results show significant changes in RNFL measurements one month after surgery. Peripapillary changes such as peripapillary atrophy or changes as a result of previous retinal surgery, as well as retinal laser treatments and alterations in morphology such as epiretinal membranes, must also be taken into consideration. Evaluation of rigidity of tissue and structures due to age and duration of glaucoma have to be taken into account when analyzing these structures. This may also have an impact on the improvement of already existing visual field defects. Moreover, the effect of IOP-lowering medication itself on ocular biomechanics has to be considered. Prostaglandins, for instance, are known to have an impact on corneal hysteresis and therefore might lead to changes in ocular biomechanics.43,44 Mansberger et al demonstrated the importance of a manual review of RNFL segmentation in order to correctly distinguish between glaucoma and changes due to age or thinner tissue overall.45 However, other aspects have to be taken into consideration as well. Assessment of RNFL can be difficult as flooring may impact the outcome. Additional information could be gained with a better resolution of current OCT platforms. Accounting for blood vessel location should also be kept in mind.46 Moreover, only a small span of RNFL is evaluated which causes problems with automated segmentation in patients with more advanced glaucoma due to increased reflectance. Furthermore, age-related changes in BMO-MRW in healthy subjects are already known. Differences between BMO-MRW and RNFL according to age and between each other have to be taken into account as well.47
Limitations of our study include a retrospective approach as there may be a selection-bias concerning inclusion and exclusion criteria, as well as a lack of long-term data and evaluation of changes over several months. This data is missing as many patients are taken care of by the referring ophthalmologist after the first month after surgery. Moreover, to be able to differentiate between the IOP-lowering effects of each surgery respectively, a larger sample size would be necessary.
Nevertheless, a prospective long-term follow-up and additional reviews of OCT and automated perimetry are needed to confirm changes over time.
Conclusion
In conclusion, our study results indicate a change in SD-OCT derived parameters of the ONH in medically uncontrolled POAG. All sectors of the BMO-MRW as well as the RNFL showed an increase in thickness after IOP-lowering surgery with the most striking changes in the superior-nasal and temporal sectors, respectively. In contrast to these alterations, the BMO-Area remained completely stable.
It can be summarized that BMO-MRW appears to be strongly IOP-dependent, which limits its use as a follow-up parameter in monitoring glaucoma, especially after surgery. The BMO-Area itself is very robust. The OCT-derived parameter RNFL changed significantly in almost all sectors after IOP-lowering surgery (except for the temporal-superior one) but did not show significant correlations with the change of IOP. Nevertheless, this finding strongly suggests the use of evaluation of RNFL thickness for follow-up in glaucoma patients, regardless as to whether surgical intervention is required or not. Further investigations of long-term changes in these parameters are desirable.
Acknowledgment
We are grateful to the technicians for their assistance and support.
Disclosure
The authors report no conflicts of interest in this work.
References
1. Jampel HD, Friedman D, Quigley H, et al. Agreement among glaucoma specialists in assessing progressive disc changes from photographs in open-angle glaucoma patients. Am J Ophthalmol. 2009;147(1):39–44.e1. doi:10.1016/j.ajo.2008.07.023
2. Keltner JL, Johnson CA, Anderson DR, et al. The association between glaucomatous visual fields and optic nerve head features in the ocular hypertension treatment Study. Ophthalmology. 2006;113(9):1603–1612. doi:10.1016/j.ophtha.2006.05.061
3. Garway-Heath DF, Holder GE, Fitzke FW, et al. Relationship between electrophysiological, psychophysical, and anatomical measurements in glaucoma. Invest Ophthalmol Vis Sci. 2002;43(7):2213–2220.
4. Muth DR, Hirneiss CW. Structure-Function relationship between bruch’s membrane opening-based optic nerve head parameters and visual field defects in glaucoma. Invest Ophthalmol Vis Sci. 2015;56(5):3320–3328. doi:10.1167/iovs.14-15845
5. Medeiros FA, Zangwill LM, Alencar LM, et al. Detection of glaucoma progression with stratus OCT retinal nerve fiber layer, optic nerve head, and macular thickness measurements. Invest Ophthalmol Vis Sci. 2009;50(12):5741–5748. doi:10.1167/iovs.09-3715
6. Wessel JM, Horn FK, Tornow RP, et al. Longitudinal analysis of progression in glaucoma using spectral-domain optical coherence tomography. Invest Ophthalmol Vis Sci. 2013;54(5):3613–3620. doi:10.1167/iovs.12-9786
7. Chauhan BC, O’Leary N, AlMobarak FA, et al. Enhanced detection of open-angle glaucoma with an anatomically accurate optical coherence tomography-derived neuroretinal rim parameter. Ophthalmology. 2013;120(3):535–543. doi:10.1016/j.ophtha.2012.09.055
8. Enders P, Adler W, Kiessling D, et al. Evaluation of two-dimensional Bruch’s membrane opening minimum rim area for glaucoma diagnostics in a large patient cohort. Acta Ophthalmol. 2019;97(1):60–67. doi:10.1111/aos.13698
9. Enders P, Schaub F, Adler W, et al. Bruch’s membrane opening-based optical coherence tomography of the optic nerve head: a useful diagnostic tool to detect glaucoma in macrodiscs. Eye (Lond). 2018;32(2):314–323. doi:10.1038/eye.2017.306
10. Gardiner SK, Ren R, Yang H, et al. A method to estimate the amount of neuroretinal rim tissue in glaucoma: comparison with current methods for measuring rim area. Am J Ophthalmol. 2014;157(3):
11. Gardiner SK, Boey PY, Yang H, et al. Structural measurements for monitoring change in glaucoma: comparing retinal nerve fiber layer thickness with minimum rim width and area. Invest Ophthalmol Vis Sci. 2015;56(11):6886–6891. doi:10.1167/iovs.15-16701
12. Leung CK. Diagnosing glaucoma progression with optical coherence tomography. Curr Opin Ophthalmol. 2014;25(2):104–111. doi:10.1097/ICU.0000000000000024
13. Townsend KA, Wollstein G, Schuman JS. Imaging of the retinal nerve fibre layer for glaucoma. Br J Ophthalmol. 2009;93(2):139–143. doi:10.1136/bjo.2008.145540
14. Gardiner SK, Demirel S, Reynaud J, et al. Changes in retinal nerve fiber layer reflectance intensity as a predictor of functional progression in glaucoma. Invest Ophthalmol Vis Sci. 2016;57(3):1221–1227. doi:10.1167/iovs.15-18788
15. Gardiner SK, Fortune B, Demirel S. Localized changes in retinal nerve fiber layer thickness as a predictor of localized functional change in glaucoma. Am J Ophthalmol. 2016;170:75–82. doi:10.1016/j.ajo.2016.07.020
16. Enders P, Bremen A, Schaub F, et al. Intraday repeatability of bruch’s membrane opening-based neuroretinal rim measurements. Invest Ophthalmol Vis Sci. 2017;58(12):5195–5200. doi:10.1167/iovs.17-22812
17. Jiang R, Xu L, Liu X, et al. Optic nerve head changes after short-term intraocular pressure elevation in acute primary angle-closure suspects. Ophthalmology. 2015;122(4):730–737. doi:10.1016/j.ophtha.2014.11.008
18. Waisbourd M, Ahmed OM, Molineaux J, et al. Reversible structural and functional changes after intraocular pressure reduction in patients with glaucoma. Graefes Arch Clin Exp Ophthalmol. 2016;254(6):1159–1166. doi:10.1007/s00417-016-3321-2
19. Yildirim E, Bilge AH, Ilker S. Improvement of visual field following trabeculectomy for open angle glaucoma. Eye (Lond). 1990;4(1):103–106. doi:10.1038/eye.1990.12
20. Gietzelt C, Lemke J, Schaub F, et al. Structural reversal of disc cupping after trabeculectomy alters bruch membrane opening-based parameters to assess neuroretinal rim. Am J Ophthalmol. 2018;194:143–152. doi:10.1016/j.ajo.2018.07.016
21. Gietzelt C, von Goscinski C, Lemke J, et al. Dynamics of structural reversal in Bruch’s membrane opening-based morphometrics after glaucoma drainage device surgery. Graefes Arch Clin Exp Ophthalmol. 2020;258(6):1227–1236. doi:10.1007/s00417-020-04621-y
22. Hodapp EAD. Clinical Decisions in Glaucoma. St. Louis: Mosby; 1993.
23. European Glaucoma Society EE. Terminology and Guidelines for Glaucoma.
24. Topouzis F, Peng F, Kotas-Neumann R, et al. Longitudinal changes in optic disc topography of adult patients after trabeculectomy. Ophthalmology. 1999;106(6):1147–1151. doi:10.1016/S0161-6420(99)90248-8
25. Vianna JR, Danthurebandara VM, Sharpe GP, et al. Importance of normal aging in estimating the rate of glaucomatous neuroretinal rim and retinal nerve fiber layer loss. Ophthalmology. 2015;122(12):2392–2398. doi:10.1016/j.ophtha.2015.08.020
26. Danthurebandara VM, Sharpe GP, Hutchison DM, et al. Enhanced structure-function relationship in glaucoma with an anatomically and geometrically accurate neuroretinal rim measurement. Invest Ophthalmol Vis Sci. 2014;56(1):98–105. doi:10.1167/iovs.14-15375
27. El Chehab H, Delbarre M, Marechal M, et al. [New neuroretinal rim analysis with spectral domain optical coherence tomography, Spectralis (Heidelberg Engineering, Germany). Preliminary study]. J Fr Ophtalmol. 2015;38(1):46–52. doi:10.1016/j.jfo.2014.10.004. [Indonesian]
28. Gmeiner JM, Schrems WA, Mardin CY, et al. Comparison of Bruch’s membrane opening minimum rim width and peripapillary retinal nerve fiber layer thickness in early glaucoma assessment. Invest Ophthalmol Vis Sci. 2016;57(9):575–584. doi:10.1167/iovs.15-18906
29. Reis ASC, Zangalli CES, Abe RY, et al. Intra- and interobserver reproducibility of Bruch’s membrane opening minimum rim width measurements with spectral domain optical coherence tomography. Acta Ophthalmol. 2017;95(7):e548–e55. doi:10.1111/aos.13464
30. Gupta L, Rahmatnejad K, Gogte P, et al. Reproducibility of minimum rim width and retinal nerve fibre layer thickness using the anatomic positioning system in glaucoma patients. Can J Ophthalmol. 2019;54(3):335–341. doi:10.1016/j.jcjo.2018.05.007
31. Sharma S, Tun TA, Baskaran M, et al. Effect of acute intraocular pressure elevation on the minimum rim width in normal, ocular hypertensive and glaucoma eyes. Br J Ophthalmol. 2018;102(1):131–135. doi:10.1136/bjophthalmol-2017-310232
32. Jonas JB, Budde WM, Panda-Jonas S. Ophthalmoscopic evaluation of the optic nerve head. Surv Ophthalmol. 1999;43:293–320.
33. Huang D, Chopra V, Lu AT, et al. Does optic nerve head size variation affect circumpapillary retinal nerve fiber layer thickness measurement by optical coherence tomography? Invest Ophthalmol Vis Sci. 2012;53(8):4990–4997. doi:10.1167/iovs.11-8214
34. Roberts MD, Grau V, Grimm J, et al. Remodeling of the connective tissue microarchitecture of the lamina cribrosa in early experimental glaucoma. Invest Ophthalmol Vis Sci. 2009;50(2):681–690. doi:10.1167/iovs.08-1792
35. Arthur SN, Smith SD, Wright MM, et al. Reproducibility and agreement in evaluating retinal nerve fibre layer thickness between stratus and spectralis OCT. Eye (Lond). 2011;25(2):192–200. doi:10.1038/eye.2010.178
36. Serbecic N, Beutelspacher SC, Aboul-Enein FC, et al. Reproducibility of high-resolution optical coherence tomography measurements of the nerve fibre layer with the new Heidelberg Spectralis optical coherence tomography. Br J Ophthalmol. 2011;95(6):804–810. doi:10.1136/bjo.2010.186221
37. Wu H, de Boer JF, Chen TC. Reproducibility of retinal nerve fiber layer thickness measurements using spectral domain optical coherence tomography. J Glaucoma. 2011;20(8):470–476. doi:10.1097/IJG.0b013e3181f3eb64
38. Aydin A, Wollstein G, Price LL, et al. Optical coherence tomography assessment of retinal nerve fiber layer thickness changes after glaucoma surgery. Ophthalmology. 2003;110(8):1506–1511. doi:10.1016/S0161-6420(03)00493-7
39. Yamada N, Tomita G, Yamamoto T, et al. Changes in the nerve fiber layer thickness following a reduction of intraocular pressure after trabeculectomy. J Glaucoma. 2000;9(5):371–375. doi:10.1097/00061198-200010000-00005
40. Chang PT, Sekhon N, Budenz DL, et al. Effect of lowering intraocular pressure on optical coherence tomography measurement of peripapillary retinal nerve fiber layer thickness. Ophthalmology. 2007;114(12):2252–2258. doi:10.1016/j.ophtha.2007.02.012
41. Kim WJ, Kim KN, Sung JY, et al. Relationship between preoperative high intraocular pressure and retinal nerve fibre layer thinning after glaucoma surgery. Sci Rep. 2019;9(1):13901. doi:10.1038/s41598-019-50406-7
42. Liu X, Li M, Zhong Y, et al. The damage patterns of retinal nerve fiber layer in acute and chronic intraocular pressure elevation in primary angle closure glaucoma. Eye Sci. 2011;26(3):154–160. doi:10.3969/j.issn.1000-4432.2011.03.006
43. Wu N, Chen Y, Yang Y, et al. The changes of corneal biomechanical properties with long-term treatment of prostaglandin analogue measured by Corvis ST. BMC Ophthalmol. 2020;20(1):422. doi:10.1186/s12886-020-01693-6
44. Wu N, Chen Y, Yu X, et al. Changes in corneal biomechanical properties after long-term topical prostaglandin therapy. PLoS One. 2016;11(5):e0155527. doi:10.1371/journal.pone.0155527
45. Mansberger SL, Menda SA, Fortune BA, et al. Automated segmentation errors when using optical coherence tomography to measure retinal nerve fiber layer thickness in glaucoma. Am J Ophthalmol. 2017;174:1–8. doi:10.1016/j.ajo.2016.10.020
46. La Bruna S, Tsamis E, Zemborain ZZ, et al. A Topographic Comparison of OCT Minimum Rim Width (BMO-MRW) and Circumpapillary Retinal Nerve Fiber Layer (cRNFL) thickness measures in eyes with or suspected glaucoma. J Glaucoma. 2020;29(8):671–680. doi:10.1097/IJG.0000000000001571
47. Chauhan BC, Danthurebandara VM, Sharpe GP, et al. Bruch’s membrane opening minimum rim width and retinal nerve fiber layer thickness in a normal white population: a multicenter Study. Ophthalmology. 2015;122(9):1786–1794. doi:10.1016/j.ophtha.2015.06.001
 © 2021 The Author(s). This work is published and licensed by Dove Medical Press Limited. The
full terms of this license are available at https://www.dovepress.com/terms
and incorporate the Creative Commons Attribution
- Non Commercial (unported, 3.0) License.
By accessing the work you hereby accept the Terms. Non-commercial uses of the work are permitted
without any further permission from Dove Medical Press Limited, provided the work is properly
attributed. For permission for commercial use of this work, please see paragraphs 4.2 and 5 of our Terms.
© 2021 The Author(s). This work is published and licensed by Dove Medical Press Limited. The
full terms of this license are available at https://www.dovepress.com/terms
and incorporate the Creative Commons Attribution
- Non Commercial (unported, 3.0) License.
By accessing the work you hereby accept the Terms. Non-commercial uses of the work are permitted
without any further permission from Dove Medical Press Limited, provided the work is properly
attributed. For permission for commercial use of this work, please see paragraphs 4.2 and 5 of our Terms.