Back to Journals » International Journal of Nanomedicine » Volume 11
Cationic PEGylated liposomes incorporating an antimicrobial peptide tilapia hepcidin 2–3: an adjuvant of epirubicin to overcome multidrug resistance in cervical cancer cells
Authors Juang V, Lee HP, Lin AMY, Lo YL ![]()
Received 19 July 2016
Accepted for publication 10 October 2016
Published 15 November 2016 Volume 2016:11 Pages 6047—6064
DOI https://doi.org/10.2147/IJN.S117618
Checked for plagiarism Yes
Review by Single anonymous peer review
Peer reviewer comments 3
Editor who approved publication: Professor Lei Yang
Vivian Juang,1 Hsin-Pin Lee,2 Anya Maan-Yuh Lin,1,3 Yu-Li Lo1
1Department and Institute of Pharmacology, National Yang-Ming University, 2Department of Biological Sciences and Technology, National University of Tainan, 3Department of Medical Research, Taipei Veterans General Hospital, Taipei, Taiwan, Republic of China
Abstract: Antimicrobial peptides (AMPs) have been recently evaluated as a new generation of adjuvants in cancer chemotherapy. In this study, we designed PEGylated liposomes encapsulating epirubicin as an antineoplastic agent and tilapia hepcidin 2–3, an AMP, as a multidrug resistance (MDR) transporter suppressor and an apoptosis/autophagy modulator in human cervical cancer HeLa cells. Cotreatment of HeLa cells with PEGylated liposomal formulation of epirubicin and hepcidin 2–3 significantly increased the cytotoxicity of epirubicin. The liposomal formulations of epirubicin and/or hepcidin 2–3 were found to noticeably escalate the intracellular H2O2 and O2- levels of cancer cells. Furthermore, these treatments considerably reduced the mRNA expressions of MDR protein 1, MDR-associated protein (MRP) 1, and MRP2. The addition of hepcidin 2–3 in liposomes was shown to markedly enhance the intracellular epirubicin uptake and mainly localized into the nucleus. Moreover, this formulation was also found to trigger apoptosis and autophagy in HeLa cells, as validated by significant increases in the expressions of cleaved poly ADP ribose polymerase, caspase-3, caspase-9, and light chain 3 (LC3)-II, as well as a decrease in mitochondrial membrane potential. The apoptosis induction was also confirmed by the rise in sub-G1 phase of cell cycle assay and apoptosis percentage of annexin V/propidium iodide assay. We found that liposomal epirubicin and hepcidin 2–3 augmented the accumulation of GFP-LC3 puncta as amplified by chloroquine, implying the involvement of autophagy. Interestingly, the partial inhibition of necroptosis and the epithelial–mesenchymal transition by this combination was also verified. Altogether, our results provide evidence that coincubation with PEGylated liposomes of hepcidin 2–3 and epirubicin caused programmed cell death in cervical cancer cells through modulation of multiple signaling pathways, including MDR transporters, apoptosis, autophagy, and/or necroptosis. Thus, this formulation may provide a new platform for the combined treatment of traditional chemotherapy and hepcidin 2–3 as a new adjuvant for effective MDR reversal.
Keywords: multidrug resistance, liposomes, antimicrobial peptide, epirubicin, apoptosis, autophagy
Introduction
Antimicrobial peptides (AMPs) are evolutionarily conserved from prokaryotes to humans and frequently play crucial roles as natural defensive weapons in the innate immune system. AMPs also exhibit anticancer activity by inducing cytolytic action on tumor cells.1,2 Hepcidin, an AMP, was originally isolated from Oreochromis mossambicus.3 There are three hepcidin isoforms, namely hepcidin 1–5, hepcidin 2–2, and hepcidin 2–3.3 Tilapia hepcidin 2–3 possesses 20 amino acids and displays the structure of α-helix. This AMP bears three positive charges and 45% of hydrophobic residues with an isoelectric point of 8.7.3 Recent evidence has demonstrated that hepcidin 2–3 has antiviral, immunomodulatory, antibacterial, and anticancer activities.3–5 This AMP inhibited cell growth and migration, as well as downregulated mRNA expression of c-Jun (a prooncogene) in human fibrosarcoma HT1080 cells.5 Generally, cationic AMPs such as hepcidin 2–3 may interact with anionic and hydrophobic membranes of cancer cells through electrostatic or hydrophobic binding.6 After membrane attachment, such AMPs may form pores via insertion into lipid bilayers or cause membrane perturbation to disrupt intracellular pathways. The possible membrane lysis of cancer cells leads to the disorder of homeostasis and results in cancer cell death.7 Moreover, tilapia hepcidin 2–3 was also developed as a booster in transgenic fish to increase resistance against infection of various bacterial species.4 Interestingly, our previous investigation has also verified that tilapia hepcidin 1–5 and epirubicin caused cell death in human squamous carcinoma and testicular embryonic carcinoma cells through the suppression of drug efflux pumps and the simultaneous activation of mitochondrial apoptosis pathway.8 Nevertheless, the possibility of hepcidin 2–3 as an adjuvant to potentiate the activity of anticancer drugs has not been addressed in the aforementioned reports.
In addition, recent studies have supported that serum hepcidin levels were markedly reduced in liver failure patients, correlating with disease severity and autophagy dysregulation.9 Furthermore, hepcidin-knockout mice have been found to produce iron overload-associated liver diseases, accompanied by hepatic inflammation, hepatocellular apoptosis, and autophagy.10 When mice with obstructive jaundice were pretreated with hepcidin, there was a significant decrease in liver damage, i.e., the upregulation of light chain 3 (LC3)-II and a reduction of cleaved caspase-3.11 This suggested that the escalated autophagy and the diminished apoptosis may explain the protective activities of hepcidin in liver injury.11 However, the role of hepcidin in modulating autophagy and/or apoptosis has not been previously reported in cancer cells.
The development of multidrug resistance (MDR) to traditional chemotherapy usually causes failure in treating various malignant tumors.12,13 Antineoplastic agents need to achieve the intracellular targets to accomplish the specific cytotoxic mechanism(s). Membrane transporter proteins of adenosine triphosphate-binding cassette (ABC) such as permeability glycoprotein (P-glycoprotein [P-gp] and MDR protein 1 [MDR1]) and MRPs may pump these drugs out of the cells and thus reduce the efficacy of chemotherapeutic agents including epirubicin.14 P-gp and MRP1 function by transporting many drugs or toxins out of cells and render these cancer cells multidrug resistant.15 This is frequently referred to as pump-related MDR.16,17
Other ways of causing MDR are typically referred to as nonpump MDR, such as antiapoptotic survival. There are numerous pathways of cell death, including apoptosis and autophagy. Autophagy usually demonstrates the phenomenon of the sequestration of cytoplasmic components within a double membrane structure called the autophagosome and the following delivery to lysosomes for degradation.18 Microtubule-associated protein LC3 plays a key role for the formation of autophagosomes.19 During autophagy, LC3-II is a well-known autophagosome marker in mammalian cells.19 Nevertheless, apoptosis refers to a process of programmed cell death with the characteristics of cell shrinkage, chromatin condensation, and DNA fragmentation.20 The conventional anticancer drugs may also activate survival mechanisms of cancer cells via antiapoptotic proteins, such as Bcl-2.16,17 Furthermore, another mechanism for the failure of suppressing MDR is that many tumors have developed apoptotic escape for survival, eg, necroptosis activation to resist cell death caused by intracellular chemotherapy.19,21,22 “Necropotosis”, a programmed necrosis, is usually characterized by the production of receptor-interacting protein kinase (RIP) 1 and RIP3.23 RIP1 transfers signals provoked by various stresses or chemotherapeutic agents to go through survival and death pathways.22,24 RIP1 was shown to induce TNF-α receptor 1 for subsequent NF-κB stimulation to initiate cell survival.24 These antiapoptotic-, antiautophagy-, and necropotosis-related cell survival mechanisms usually correspond to nonpump MDR. To circumvent chemoresistance, it is necessary to concurrently activate apoptosis or autophagy-mediated cancer cell death for effective anticancer drug treatment.25,26
Epirubicin, an anticancer drug of anthracycline, exhibits a potent apoptosis-triggering effect via the intrinsic mitochondrial signaling in various cancer types.8,13,27 It is also a substrate of P-gp, MRP1, and MRP2.28,29 Due to the facts that epirubicin may trigger oxidative stress and that the produced reactive oxygen species (ROS) are potential cell death modulators,30,31 evaluation of the role of autophagy, necroptosis, and/or apoptosis in cytotoxicity induced by cotreatment of epirubicin and hepcidin 2–3 in HeLa cells is critical. Recent studies have indicated the protective role of autophagy in tumor survival in epirubicin-treated cancer cells, which is associated with chemoresistance in human gastric and breast cancer cells.32,33 Thus, they suggested that autophagy suppression may improve therapeutic efficacy in resistant tumors, signifying a new potential treatment strategy.32 However, other studies have revealed that autophagy may coordinate with apoptosis for cancer cell death.26,34 The role of autophagy for survival or death in the combined treatment of epirubicin and hepcidin 2–3 needs to be clarified in this study.
Although AMPs demonstrate anticancer activity, the clinical application of these peptide-based drugs is hindered due to poor pharmacokinetics and potential systemic toxicity.35 Moreover, only limited in vivo studies showed that AMPs were capable of perturbing membranes to cause antitumor efficacy successfully.7,36 Obviously, to evade acquired resistance and decrease normal cell cytotoxicity, the development of a multifunctional delivery system enclosing epirubicin and hepcidin 2–3 with novel modes of action on MDR reversal is crucial. Accordingly, the combined treatment of hepcidin 2–3 and epirubicin in PEGylated liposomes may provide a new regimen for MDR modulation, which can bypass existing resistance mechanisms associated with epirubicin treatment.
Materials and methods
Cell culture
HeLa cells were obtained from the Food Industry Research and Development Institute (Hsinchu, Taiwan). These cells were incubated in Dulbecco’s Modified Eagle’s Medium (Gibco BRL [Grand Island, NY, USA]) accompanied with 10% fetal bovine serum (Hyclone, Logan, UT, USA) as well as 1% streptomycin and penicillin (Hyclone) at 37°C. The culture was maintained under a humidified atmosphere of 5% CO2 and 95% air.
Chemicals and reagents
The amino acid sequence of hepcidin 2–3 is QSHLSLCRWCCNCCRSNKGC-NH2. Hepcidin 2–3 was modified into an amidated C-terminus and synthesized by Genesis Biotech (Taipei, Taiwan) at >98% purity. This AMP was provided by Dr JY Chen, Marine Research Station, Institute of Cellular and Organismic Biology, Academia Sinica. Epirubicin (Pharmorubicin) was obtained from Pfizer Inc. (New York, NY, USA). Polyethylene glycol 6,000 (PEG6000), DOTAP, and DOPE were purchased from Sigma-Aldrich (St Louis, MO, USA) and Avanti Polar Lipids, Inc. (Alabaster, AL, USA). All cell culture media and reagents were bought from Promega (Madison, WI, USA), Invitrogen (Carlsbad, CA, USA), Gibco BRL or Hyclone. All other chemical reagents were obtained from either Merck (Darmstadt, Germany) or Sigma-Aldrich.
Preparation of PEGylated cationic liposomal formulations
We have performed treatments of the following eight groups: control (CTR), empty liposome, epirubicin, liposomal epirubicin, hepcidin 2–3, liposomal hepcidin 2–3, epirubicin plus hepcidin 2–3, and liposomal epirubicin plus hepcidin 2–3. The method of preparation was modified from Li and Huang37 and our previous study.29 Small PEGylated cationic unilamellar liposomes consisting of DOTAP and DOPE were formed by thin film hydration. Concisely, DOTAP and DOPE (1:1, w/w; total lipid 1 mg/mL) were heated to 60°C. These lipids were mixed with PEG6000 (PEG and DOPE =1:1, mol/mol), incubated at 60°C water bath for 2 h, and then followed by sonication at 25°C for 10 min. The mixture was subsequently extruded through 400 nm membrane filter, 200 nm membrane filter, and 100 nm membrane filter. Consequently, epirubicin (10 μg/mL) and hepcidin 2–3 (20 μg/mL) were encapsulated into the PEGylated liposomes by ultrasonication at 25°C for 30 min.
Characterization of PEGylated liposomes: encapsulation efficiency (EE%), size distribution, zeta potential, and transmission electron microscopic (TEM) image
The epirubicin- and/or hepcidin 2–3-incorporated PEGylated liposomes were separated from free hepcidin 2–3 or epirubicin by filtration and centrifugation at 15,000 rpm for 20 min (4°C) through an Amicon Ultra-4 Centrifuge Filter (10,000 MWCO, Millipore Corp., Billerica, MA, USA). Hepcidin 2–3 was monitored by Epoch spectrophotometer (BioTek, Wakefield, MA, USA). Epirubicin was examined by HPLC.38 The HPLC system includes a Primaide 1110 pump (Hitachi, Tokyo, Japan), an autosampler (Primaide 1210), a Luna® 5 μm C18 100 Å LC column (250×4.6 mm; Phenomenex, Torrance, CA, USA), and a L2420 UV–VIS detector (Hitachi). The mobile phase consists of methanol and water (75:25, v/v). The flow rate was set at 1.2 mL/min at the detection wavelength of 254 nm. Each experiment was performed in quadruplicate. EE% was then calculated by the following equation:
|
|
where We is the weight of added epirubicin (or hepcidin 2–3) and Wf is the weight of epirubicin (or hepcidin 2–3) in the filtrate.
In addition, the size distribution and zeta potential of liposomes were measured using a Zetasizer Nano-ZS 90 dynamic light scattering system (Malvern Instruments Ltd., Malvern, Worcestershire, UK) at 25°C. Data were analyzed from four individual measurements. For the stability study, the size distribution, zeta potential, and EE% of liposomes were also detected under storage at 4°C for 14 days.
The image of PEGylated liposomal epirubicin and hepcidin 2–3 was observed using a TEM. One drop of the sample solution was mounted onto a carbon-coated copper grid (300 meshes). The remained solution was removed. One drop of phosphotungstic acid solution (1%) was then dripped onto the grid. After removing the negatively stained solution, the grid was air-dried and then examined under JEM 2000EX II TEM with field emission (JEOL, Ltd., Tokyo, Japan) at 100 kV. Three independent samples were observed for this liposomal formulation.
Cell viability assay
After overnight seeding, 6×10³ HeLa cells were attached in 96-well plates and treated with the corresponding eight groups as mentioned earlier for 24 h. The cells were incubated with 0.2 mg/mL 3-(4,5-dimethylthiazol-2-yl)–2,5-diphenyltetrazolium bromide (MTT; Sigma-Aldrich) and maintained for another 4 h. The final product of formazan was dissolved in DMSO, and the optical density value was measured using a Wallac 1420 Victor2 microplate reader (Perkin Elmer, Turku, Finland) at the wavelength of 540 nm. Relative cell viability (%) was calculated by dividing the number of cells treated with each group by the number of cell CTR. Data are shown as mean ± standard deviation (SD) from three separate measurements.
Determination of intracellular hydrogen peroxide and superoxide production
Cell permeable probes of 2′,7′-dichlorofluorescein diacetate (DCFH-DA) and dihydroethidium (DHE) can be changed into fluorescent dichlorofluorescein (DCF) and ethidium bromide (EtBr) products when they are encountered with H2O2 and O2− inside the cells, respectively. After an overnight seeding of HeLa cells in six-well plates at a density of 2×10⁵ cells/well, the cells were exposed to epirubicin (5 μg/mL) and/or hepcidin 2–3 (5 μg/mL) in the presence of eight different treatments for 24 h. The generated ROS were evaluated by incubating cells in the dark with DCFH-DA (20 μM) or DHE (5 μM) at 37°C for 30 min. We measured the fluorescence of DCF and EtBr products using a flow cytometer (Cell Lab Quanta SC MPL [Quanta SC]; Beckman Coulter, Fullerton, CA, USA) at an excitation wavelength of 488 nm and the emission band pass filters of 525 nm and 575 nm, individually. A commercial software of Quanta SC was used for data collection and calculation.29
Real-time quantitative PCR of MDR1, MRP1, MRP2, Bax, Bcl-2, and caspases
After HeLa cells were pretreated with eight groups for 24 h, RNA was extracted from cells using the Total RNA Extraction Miniprep System (Viogene, Taipei, Taiwan). The RNA contents were quantified using a NanoDrop ND-1000 spectrophotometer (NanoDrop, Wilmington, DE, USA). Complementary DNA (cDNA) was produced from cellular RNA (5 μg) using a High-Capacity RNA-to-cDNA Kit (Applied Biosystems; Foster City, CA, USA). Gene-specific real-time PCR primers were designed using the PRIMER EXPRESS software (Version 3.0; Applied Biosystems). The final primer sequences of MDR1, MRP1, MRP2, Bcl-2, Bax, caspase-3, caspase-8, and caspase-9 were demonstrated in our previous publication.13,29 Glyceraldehyde-3-phosphate dehydrogenase (GAPDH) was run as an internal CTR. Quantitative PCR was performed in a 10-μL volume that consists of diluted cDNA sample, primers (200 nM), and SYBR Green PCR Master mix (containing nucleotides, AmpliTaq Gold DNA polymerase, and optimized buffer components; Applied Biosystems) using the StepOne Real-Time PCR System (Applied Biosystems). The cycling program was tried, and the optimal condition was as follows: denaturation at 95°C for 10 min, 40 cycles of 95°C for 15 s, and 60°C for 1 min. Each individual experiment was performed in triplicate, and their value was normalized to the GAPDH level, respectively. Gene expression ratio was calculated as the mRNA expression levels of each gene after different treatments divided by the levels of cell CTR without treatment.
Monitor uptake of epirubicin to evaluate the function of MDR transporters
After overnight seeding, 2×10⁵ cells/well were treated with eight formulations with or without PEGylated liposomes for 24 h. The cells were harvested, and uptake of epirubicin in HeLa cells was then examined by intracellular epirubicin fluorescence using a flow cytometer.13 Data collection and assessment were performed using Quanta SC. Approximately 10,000 cells were examined in each sample. Each measurement was carried out in triplicate.
Intracellular localization of liposomal epirubicin and hepcidin 2–3
After treatment with liposomal epirubicin and hepcidin 2–3 for 3 h and 24 h, the cells were stained with 1.0 μg/μL DAPI at 37°C for 10 min and LysoTracker® Green DND-26 (1:5,000; Thermo Scientific Inc., Rockford, IL, USA) at 37°C for 30 min and then rinsed by PBS. The images were taken using a confocal laser-scanning microscope (Olympus FV10i; Olympus America Inc., Center Valley, PA, USA) with excitation at 405 nm, 480 nm, and 480 nm and emission at 450 nm, 540 nm, and 590 nm for DAPI, LysoTracker Green, and epirubicin, respectively.39,40
Assessment of mitochondrial membrane potential
After cell seeding (2×10⁵ cells/well) and pretreatment with 8 individual formulations at 37°C for 24 h, 10 μM 3,3′-dihexyloxacarbocyanine iodide (DiOC6) was added into the cells in the dark at 37°C for 30 min. These cells were then harvested and measured by flow cytometry. DiOC6 fluorescence was excited at 488 nm, and the emitted fluorescence intensity was evaluated in the range of a 525 nm (FL-1) band pass filter.
Detection of cell cycle distribution
Cells in different cell cycle phases were determined by flow cytometry. After cell seeding (2×10⁵ cells/well) and pretreatment with eight different preparations at 37°C for 24 h, the cells were collected after centrifugation and gently fixed with 70% ice-cold ethanol overnight at −20°C. The cells were then resuspended in hypotonic buffer. We used propidium iodide (PI) (1 mg/mL) to stain the cells and incubated them for 30 min in the dark. Data acquisition was achieved using a flow cytometer (Quanta SC). The following observation was performed: G0/G1 phase for growing diploid cells (DNA content 2n), S phase for replicating cells, G2/M phase for diploid cells with replicated DNA (DNA content 4n), and the sub-G1 phase for apoptotic cells with hypodiploid DNA content (<2n). Three individual experiments were performed and analyzed.
Apoptosis detection assay
The annexin V FITC Apoptosis Detection Kit (Roche, Cambridge, MA, USA) was used to detect the percentage of cells in viable, necrotic, or apoptotic status. After overnight seeding of HeLa cells (2×10⁵ cells/well), the cells were treated with eight different formulations at 37°C for 24 h and then stained with annexin V–propidium iodide (PI) labeling solution for 15 min at 25°C in the dark. The collected cells were detected using a flow cytometer (Quanta SC). Data acquisition and computation were carried out using the commercial software (Quanta SC). Phosphatidylserine is exposed in early apoptotic cells with intact cell membranes and is bound to annexin V-FITC as shown in FITC+/PI− quadrant. When cells go through necrosis or late apoptosis, they are in FITC+/PI+ quadrant.
Caspase-3, caspase-8, and caspase-9 activity assay
After treatment of 2×10⁵ cells/well with eight various formulations for 24 h, the cells were centrifuged. The collected pellets were redispersed in medium and incubated with lysis buffer. A total of 50 μL of the cell suspension was mixed with an equal volume of Caspase-Glo 3/7, 8, and 9 assay reagents (Promega) at room temperature for 30 min, separately. The enclosed luminogenic substrates of Ac-DEVD-pNA, Ac-LETD-pNA, and Ac-LEHD-pNA reacted with the corresponding caspases and generated luminescence of aminoluciferin as measured using a luminometer (MiniLumat LB9506; Berthold Technologies, Bad Wildbad, Germany).
Western blot assay of various proteins
The cells were pretreated with eight different treatments for 24 h. After harvest, the cells were washed with PBS and lysed in radioimmunoprecipitation assay lysis buffer containing 20 mM Tris-HCl (pH 7.5), 150 mM NaCl, 1% (v/v) NP-40, 1 mM Na2EDTA, 1% sodium deoxycholate, 2.5 mM sodium pyrophosphate, 1 mM β-glycerophosphate, 1 mM Na3VO4, and 1 μg/mL leupeptin overnight. Lysates were then centrifuged at 4°C, 15,000 rpm for 30 min, and the protein concentrations of supernatant were measured using Pierce™ BCA Protein Assay Kit (Thermo Scientific Inc., Rockford, IL, USA). Protein samples (30 μg per lane) were run on 8%–13.5% SDS-polyacrylamide gel electrophoresis and then transferred onto a polyvinylidene difluoride membrane (Bio-Rad Laboratories Inc., Richmond, CA, USA) at 80 V for 120 min. Blots were probed with primary antibodies against LC3, RIP3, poly ADP ribose polymerase, caspase-3, and caspase-9 (1:1,000; Cell Signaling Technology Inc., Beverly, MA, USA), Slug (1:1,000; Abcam plc, Cambridge, UK), N-cadherin (1:1,000; BD Biosciences, San Jose, CA, USA), and RIP1 (1:1,000; R&D Systems, Minneapolis, MN, USA) overnight at 4°C. After primary antibody incubation, the membrane was washed and incubated with horseradish peroxidase-conjugated secondary IgG (1:3,000; GeneTex Inc., Irvine, CA, USA) for 1 h at room temperature and developed using the ECL immunoblotting detection system (Millipore Corporation, Billerica, MA, USA). After this detection, the bound primary and secondary antibodies were stripped by incubating the membrane in stripping buffer (62 mM Tris-base, 80 mM 2-mercaptoethanol, and 2% SDS) at 42°C for 15 min. The membrane was reprobed with β-actin (Chemicon, Temecula, CA, USA).39,41,42
Detection of autophagy induced by liposomal epirubicin and hepcidin 2–3 using GFP-LC3
Cells were transfected with a GFP-LC3 (in green) expression plasmid, which was kindly provided by Dr YH Ping, for 6 h using T-Pro P-Fect Transfection Reagent (T-Pro Biotechnology, Taipei, Taiwan). Following the treatment of liposomal hepcidin 2–3 and Lip-epirubicin (in red) with or without 30 μM of chloroquine for 24 h, cells were observed for the fluorescence of GFP-LC3 using a confocal laser-scanning microscope (Olympus FV10i; Olympus America Inc., Center Valley, PA, USA). The cells were also stained with DAPI (blue) in the nucleus for comparison. LC3 punctate spots were detected with excitation at 488 nm and emission at 522 nm for GFP-LC3.40
Statistical analyses
Statistical analysis was carried out using Student’s t-test and displayed as mean ± SD. Differences were defined to be significant at P<0.05.
Results
Determination of EE%, particle size, and zeta potential of PEGylated liposomal hepcidin 2–3 and Lip-epirubicin
Characterization of hepcidin 2–3 and epirubicin in PEGylated liposomes was evaluated. A schematic graph showing the formation of PEGylated liposomes composed of hepcidin 2–3 and/or epirubicin is displayed in Figure 1A. EE% of hepcidin 2–3 and/or epirubicin in PEGylated liposomes was >88%, ranged from 88.28%±1.09% for liposomal epirubicin and hepcidin 2–3 to 89.92%±1.88% for liposomal epirubicin, as listed in Table 1. Furthermore, we have measured EE% of liposomal epirubicin and hepcidin 2–3 for 2 weeks to verify that the encapsulated epirubicin did not leak out too much. We found that the initial EE% was 88.28%±1.09% and EE% of this formulation was slightly reduced to 85.36%±2.64% in 2 weeks, indicating the good incorporation of epirubicin in this PEGylated liposomal formulation (Figure 1B). These PEGylated liposomal dispersions with or without hepcidin 2–3 and/or epirubicin were well-dispersed nanoparticles with sizes changed from 94.55±2.89 nm for liposomes (no incorporated drugs) to 103.56±3.29 nm for liposomal epirubicin and hepcidin 2–3 (Figure 1C and Table 1), with a similar polydispersity index of ~0.1 (Table 1). Since these liposomes were prepared with lipids of positive charges, it is reasonable that the mean zeta potential of liposomes was 23.26±2.31 mV (n=4; Table 1). When amphiphilic epirubicin was incorporated into the liposomes, the zeta potential of liposomal epirubicin was slightly raised because of the positive charge of this anticancer drug. When hepcidin 2–3 was added into liposomes, the zeta potential of these preparations further escalated to 32.08±2.59 mV, mainly resulting from the cationic charges of hepcidin 2–3 (Figure 1C and Table 1). The net positive zeta potential of these PEGylated liposomal formulations might enhance electrostatic charge attraction between these liposomes and anionic surface of tumor cells. In addition, the size distribution and zeta potential of PEGylated liposomal epirubicin and hepcidin 2–3 have been evaluated at 4°C for 14 days. We found that the size of this formulation showed a slight decrease of ~14% after 5-day storage, but its zeta potential displayed a mild increase from 32.08 mV to 41.60 mV. However, the particle size further reduced to 79.03% of its original size, but the zeta potential decreased back to 31.4 mV after 14-day storage, indicating a small particle size and a suitable zeta potential range. Our results, thus, supported an acceptable stability for PEGylated liposomal epirubicin and hepcidin 2–3 under storage at 4°C for 14 days (Figure 1D).
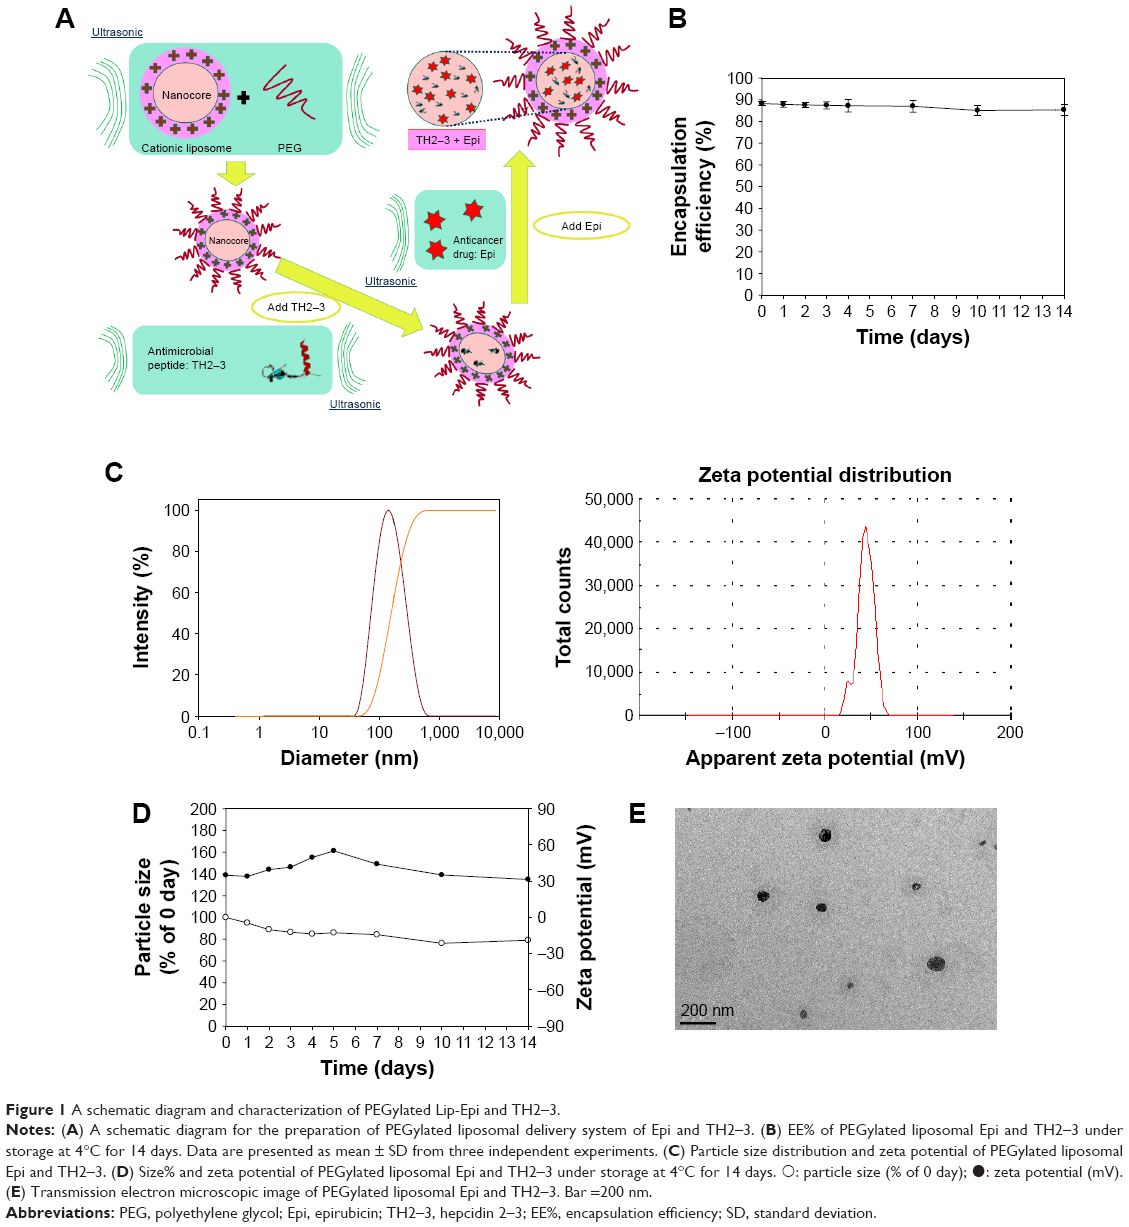 | Figure 1 A schematic diagram and characterization of PEGylated Lip-Epi and TH2–3. |
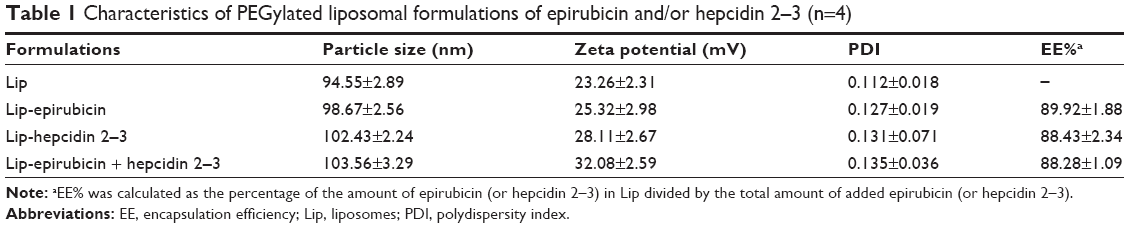 | Table 1 Characteristics of PEGylated liposomal formulations of epirubicin and/or hepcidin 2–3 (n=4) |
The morphology of PEGylated liposomal epirubicin and hepcidin 2–3 was observed by TEM. As shown in Figure 1E, this population of liposomes was close to spherical in shape and displayed a diameter of <100 nm.
PEGylated liposomal epirubicin and hepcidin 2–3 significantly increased epirubicin cytotoxicity
We have evaluated the cytotoxic effects of hepcidin 2–3 on different cell lines, including HeLa, human epidermoid carcinoma A431 cells, and human squamous carcinoma SCC15 cells using the MTT assay. As shown in Figure 2A and B, hepcidin 2–3 increased the viability of A431 cells (Figure 2A) but did not show significant cytotoxicity to SCC15 cells (Figure 2B). Nevertheless, after incubation with 10 μg/mL of hepcidin 2–3 for 24 h, the viability percentage of HeLa cells displayed a marginal change (Figure 2C; 95.57%±5.04%) compared to that of the cells of no treatment (P>0.05); while after treatment with 20 μg/mL of hepcidin 2–3 for 24 h, the viability percentage of HeLa cells was diminished to 88.83%±0.26% (Figure 2C; P<0.001); the further increase of hepcidin 2–3 to 50 μg/mL and 100 μg/mL did not additionally reduce HeLa cell viability. Because our aim was to use hepcidin 2–3 as a MDR modulator to intensify the cytotoxicity of epirubicin, we selected the concentration of hepcidin 2–3 with ~11% cytotoxicity as an adjuvant for the cotreatment with epirubicin. The combined treatment of hepcidin 2–3 (20 μg/mL) and epirubicin at different concentrations exhibited more inhibition on the viability of HeLa cells than that of epirubicin alone (Figure 2D). We chose the concentration of epirubicin alone with ~15% cytotoxicity (not too cytotoxic alone) but demonstrated ~32% cytotoxicity for the combined treatment with hepcidin 2–3 (significant difference from epirubicin alone: P<0.001; Figure 2D). Moreover, epirubicin and hepcidin 2–3 in PEGylated liposomes displayed a greater inhibition of HeLa cells (56.16%±4.61%) compared to free and liposomal epirubicin or hepcidin 2–3 (all P<0.05; Figure 2E).
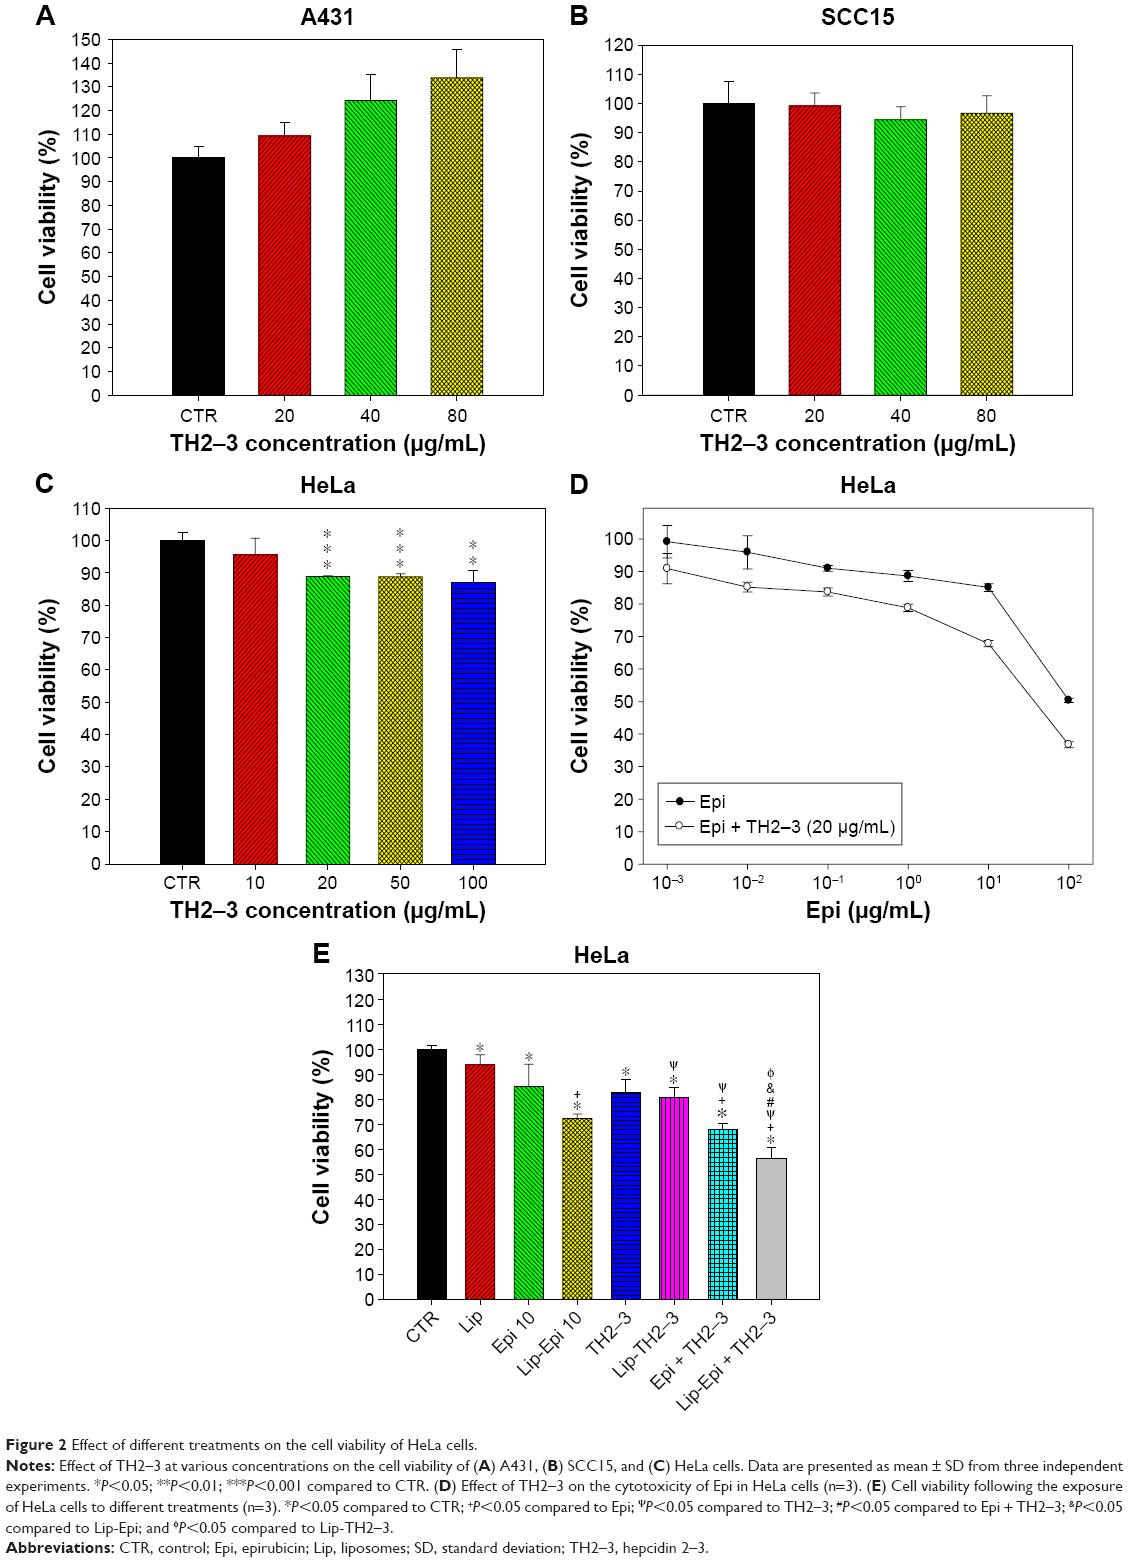 | Figure 2 Effect of different treatments on the cell viability of HeLa cells. |
PEGylated liposomal epirubicin and hepcidin 2–3 enhanced ROS generation in HeLa cells
Recent studies have indicated that the increase in ROS levels disturbs the intracellular redox balance, triggers endoplasmic reticulum stress, and ultimately induces apoptosis in various cancer cells.43,44 The H2O2 and O2− levels after treatment with epirubicin or liposomal epirubicin were significantly higher than those with hepcidin 2–3 or liposomal hepcidin 2–3 alone (Figure 3A and B). The relative intracellular H2O2 and O2− percentage, as indicated by the DCF and EtBr fluorescence in HeLa cells, was highest after incubation with liposomal epirubicin and hepcidin 2–3 among all the formulations (P<0.05) (Figure 3A and B).
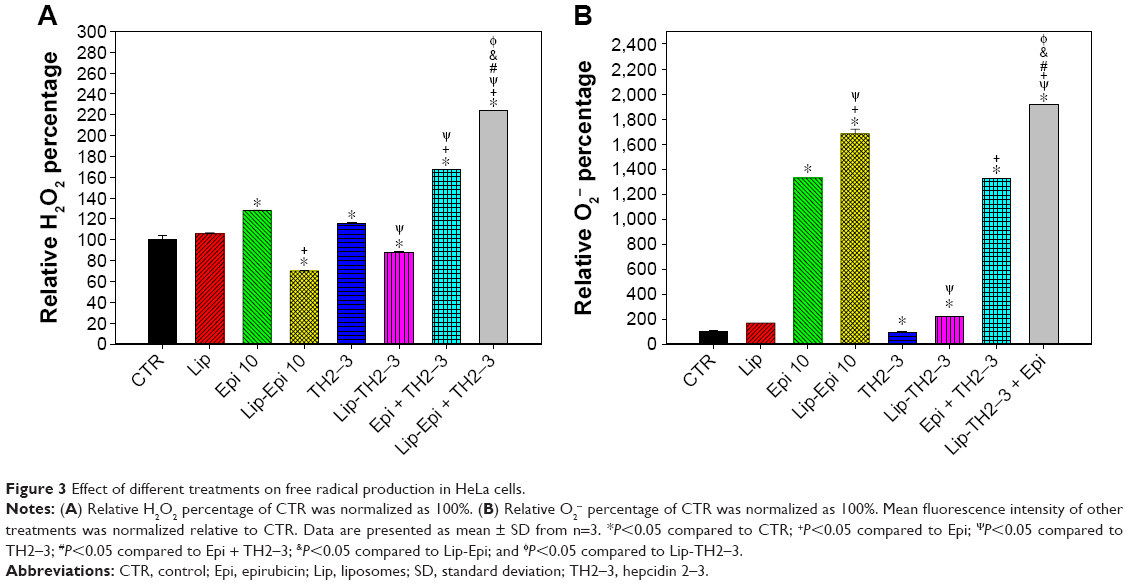 | Figure 3 Effect of different treatments on free radical production in HeLa cells. |
PEGylated liposomal epirubicin and hepcidin 2–3 declined the mRNA levels of MDR transporters and amplified the epirubicin accumulation in HeLa cells
The mRNA expression levels of MDR1, MRP1, and MRP2 were evaluated using real-time PCR. Incubation with epirubicin in free or in liposomal formulations increased the mRNA levels of MDR1, MRP1, and MRP2, individually. The role of epirubicin in provoking MDR-related pumps to transport epirubicin out of cells and aggravating drug resistance was thus verified. However, treatments with epirubicin and hepcidin 2–3 in free or in liposomal formulations exhibited decreases in transcription against MDR1, MRP1, and MRP2 compared to the group of free or liposomal epirubicin, separately (P<0.05, Figure 4A). In addition, our experimental data from the functional assay showed that hepcidin 2–3 enhanced the intracellular retention of epirubicin and liposomal epirubicin (P<0.05) after 24 h treatment (Figure 4B and C), further confirming the effect of free or liposomal epirubicin and hepcidin 2–3 to reverse epirubicin-associated pump resistance mediated by ABC transporters.
 | Figure 4 Effect of different treatments on the mRNA expressions and function of MDR transporters in HeLa cells. |
Intracellular localization of liposomal epirubicin and hepcidin 2–3 in HeLa cells
To verify whether liposomal epirubicin and hepcidin 2–3 could be efficiently internalized by HeLa cells, the cellular distribution of this formulation was evaluated via a confocal laser scanning microscope. After treatment with liposomal epirubicin (a fluorescent drug) and hepcidin 2–3 for 3 h and 24 h, the cells were stained with DAPI for nucleus and LysoTracker Green for lysosomal localization. Figure 4D displays that after 3-h incubation, liposomal epirubicin and hepcidin 2–3 were remarkably internalized and distributed intensively throughout the cytoplasm and lysosomes compared to the CTR cells. However, after 24-h incubation, the liposomal epirubicin and hepcidin 2–3 were localized predominantly in the nucleus of HeLa cells, which confirmed the final destination of anthracycline for cytotoxicity. Taken together, these findings indicated that this PEGylated liposomal formulation considerably enhanced cellular internalization of epirubicin and hepcidin 2–3 into the nucleus of cervical cancer cells.
PEGylated liposomal epirubicin and hepcidin 2–3 treatment reduced the mitochondrial membrane potential in HeLa cells
The mitochondrial transmembrane potential (ΔΨm) results from the asymmetric distribution of protons and ions on both sides of the mitochondrial membrane. Fluorescent probes such as DiOC6 can be used to measure the mitochondrial transmembrane potential change.45 Treatments of HeLa cells with epirubicin and/or hepcidin 2–3 for 24 h demonstrated significant declines in ΔΨm (Figure 5A). PEGylated liposomal epirubicin and hepcidin 2–3 further diminished ΔΨm. This value was distinctly lower than those after treatments with either hepcidin 2–3 or epirubicin alone in free or in liposomal formulations (Figure 5A; P<0.05).
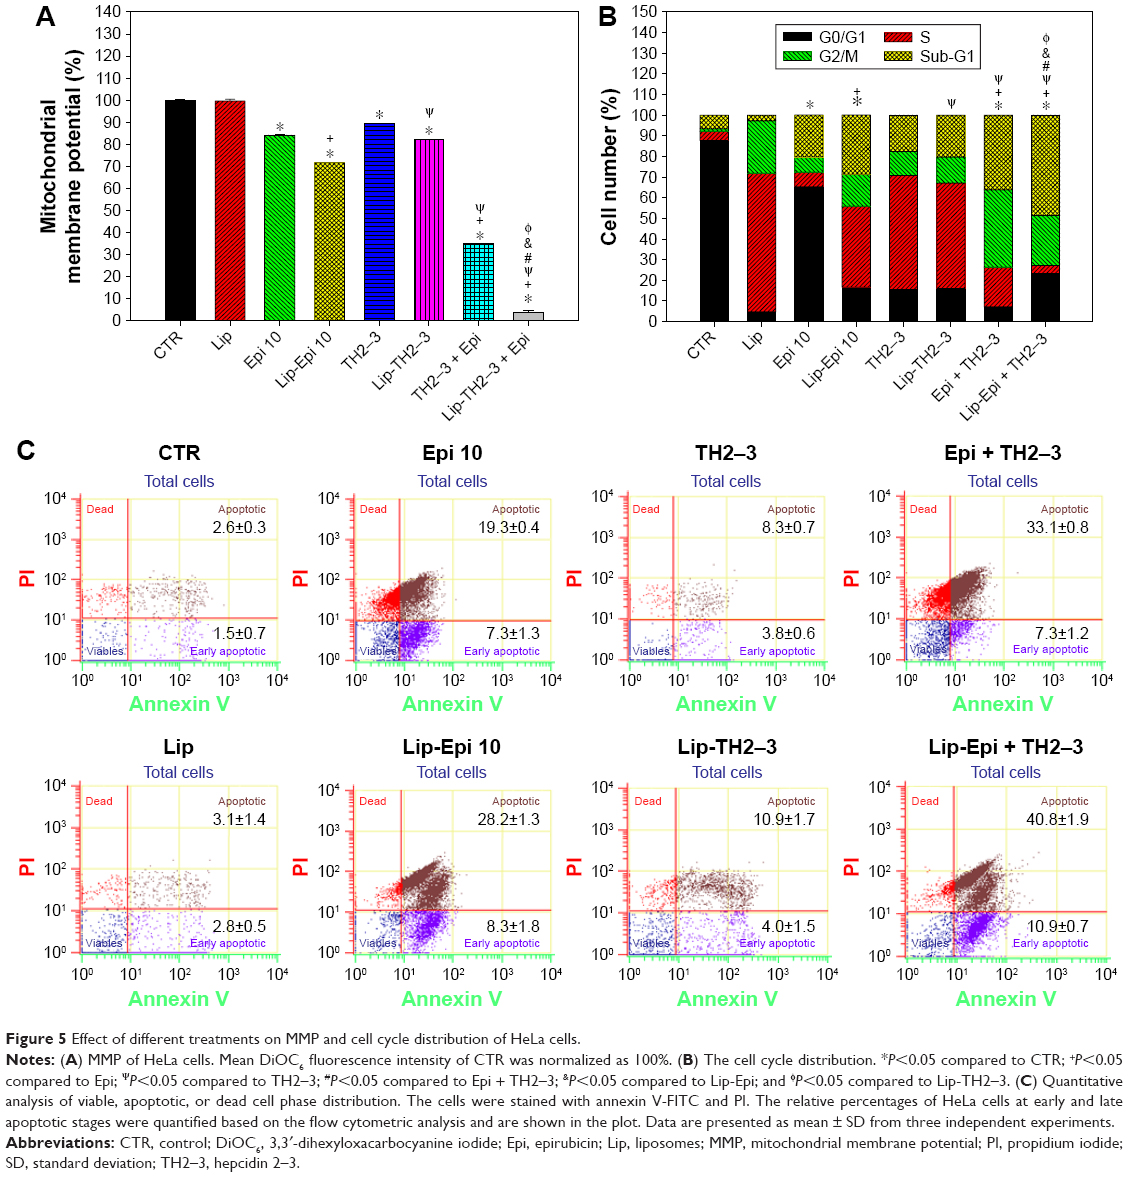 | Figure 5 Effect of different treatments on MMP and cell cycle distribution of HeLa cells. |
PEGylated liposomal epirubicin and hepcidin 2–3 treatment significantly affected cell cycle distribution and apoptosis percentages of HeLa cells
HeLa cells after different treatments exhibited a characteristic DNA pattern that represented sub-G1, G0/G1, S, and G2/M phases of the cell cycle. The percentages of apoptotic cells, as shown by sub-G1 phase, were significantly incremented after cells were incubated with the treatments containing epirubicin and hepcidin 2–3 in free or in liposomal formulations for 24 h (Figure 5B). The cells treated with liposomal epirubicin and hepcidin 2–3 displayed the highest percentage of sub-G1 phase (P<0.05) among all the formulations, specifying that the treatment of this PEGylated liposomal preparation triggered more HeLa cells to go through apoptosis.
Furthermore, during the process of apoptosis, phosphatidyl serine inside the membrane surface of the viable cells is exposed to the outer leaflet and is bound to annexin V and then labeled with FITC. These cells are classified as the early apoptotic stage found in FITC+/PI− quadrant and the late apoptotic stage found in FITC+/PI+ quadrant. Other states of cells were also monitored: living cells were found in FITC−/PI− quadrant and dead cells found in FITC−/PI+, as displayed in the scatter plot of double variable flow cytometry of Figure 5C. We found that free or liposomal epirubicin and/or hepcidin 2–3 treatments remarkably promoted early and/or late apoptosis populations with increased amounts of positive staining for membrane asymmetry and/or PI uptake compared to the CTR. The most prominent increase in both early and late apoptosis phases was observed in the combined treatment of liposomal epirubicin and hepcidin 2–3 (Figure 5C).
PEGylated liposomal epirubicin and hepcidin 2–3 modulated mRNA expressions of Bax, Bcl-2, caspases, and p53, as shown by real-time PCR
The mRNA expression levels of Bax, Bcl-2, caspase-3, caspase-8, caspase-9, and p53 were evaluated using real-time PCR. The incubation with epirubicin and hepcidin 2–3 significantly escalated the corresponding mRNA levels of p53, Bax, caspase-3, and caspase-9 (Figure 6A and B; P<0.05) and considerably increased the Bax-to-Bcl-2 ratio (Figure 6C; P<0.05). Epirubicin or hepcidin 2–3 in free or liposomal formulation had a marginal effect on caspase-8. PEGylated liposomal epirubicin and hepcidin 2–3 caused the greatest intensification of p53, Bax, caspase-3, and caspase-9 expressions than all the other treatments (Figure 6A and B; all with P<0.05). Interestingly, free or liposomal hepcidin 2–3 and their combined treatments with epirubicin inhibited Bcl-2 expression (Figure 6A; all P<0.05). Since cancer cells undertaking apoptosis or not depend on the dynamic equilibrium of the expressions of Bax and Bcl-2, the higher Bax/Bcl-2 ratio for free or liposomal epirubicin and hepcidin 2–3 indicates more cells undergoing apoptosis, as shown in Figure 6C. In addition, the significant changes in caspase-3 and caspase-9 activity levels after treatments of cells with free or liposomal epirubicin and/or hepcidin 2–3 (Figure 6D) displayed the similar trend with mRNA expressions of caspase-3 and caspase-9 (Figure 6B). The apoptotic pathway involved in the combined treatment of epirubicin and hepcidin 2–3 was thus suggested as the intrinsic mitochondrial pathway. Furthermore, we also observed that liposomal epirubicin and hepcidin 2–3 significantly induced chromatin condensation in HeLa cells using fluorescence microscopy (data not shown).
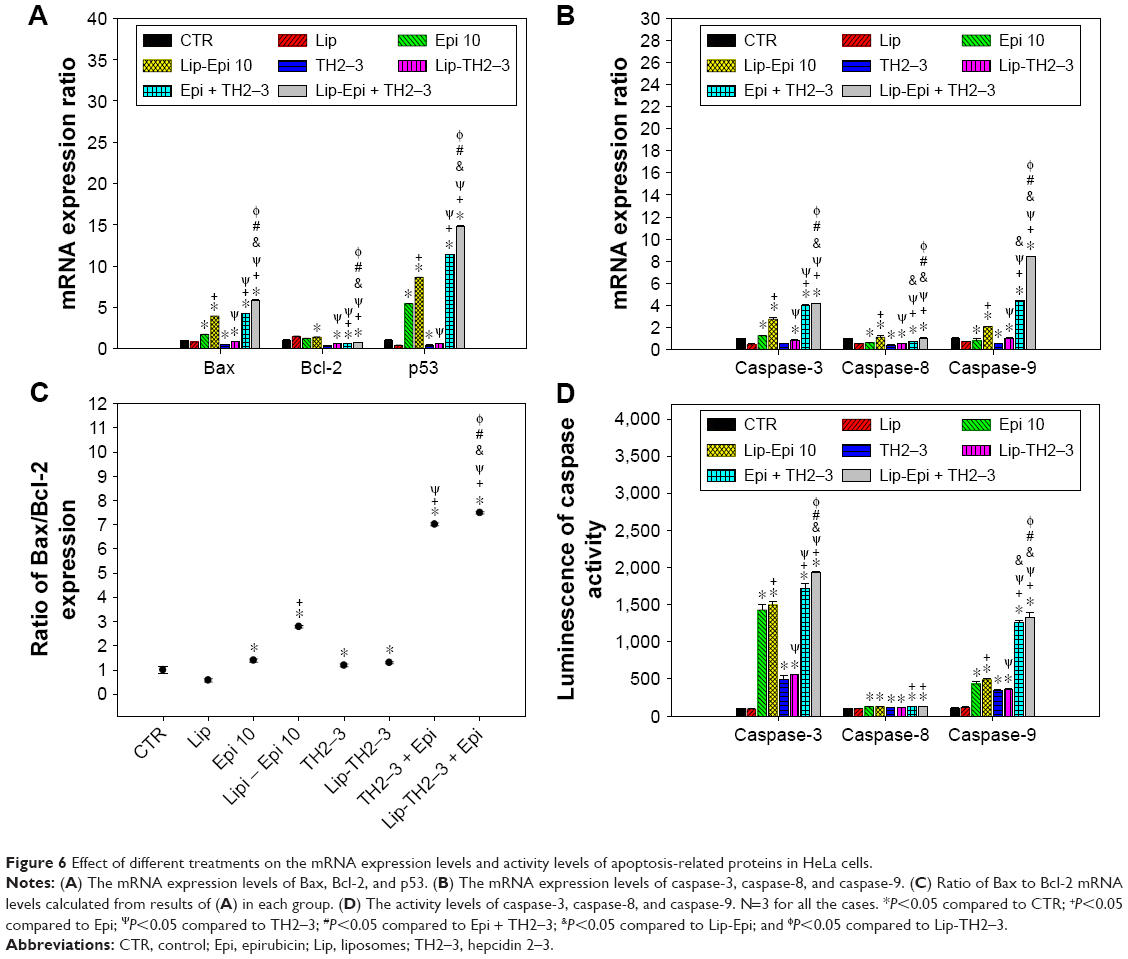 | Figure 6 Effect of different treatments on the mRNA expression levels and activity levels of apoptosis-related proteins in HeLa cells. |
Liposomal epirubicin and/or hepcidin 2–3 mildly triggered autophagy in HeLa cells
To confirm if other pathways of death were also involved in the cytotoxicity caused by the different treatments of epirubicin and/or hepcidin 2–3, we evaluated the expressions of characteristic autophagy-related proteins, including LC-3-I and LC-3-II by Western blot. As exhibited in Figure 7A, cells treated with liposomal epirubicin and hepcidin 2–3 have demonstrated a higher expression of LC-3-II than those of free hepcidin 2–3- or epirubicin-treated group, suggesting that autophagy was mildly triggered by this combination. Furthermore, when HeLa cells were observed using a confocal laser-scanning microscope, immunofluorescence staining of cells with GFP-LC3 also confirmed the occurrence of autophagy, as visualized by puncta staining in LC3-positive autophagic vesicles of HeLa cells treated with liposomal epirubicin and hepcidin 2–3 (Figure 7B). The puncta spots of HeLa cells were further intensified by the addition of autophagy inhibitor chloroquine in the treatment, indicating that liposomal epirubicin and hepcidin 2–3 might induce autophagy and autolysosome formations (Figure 7B).
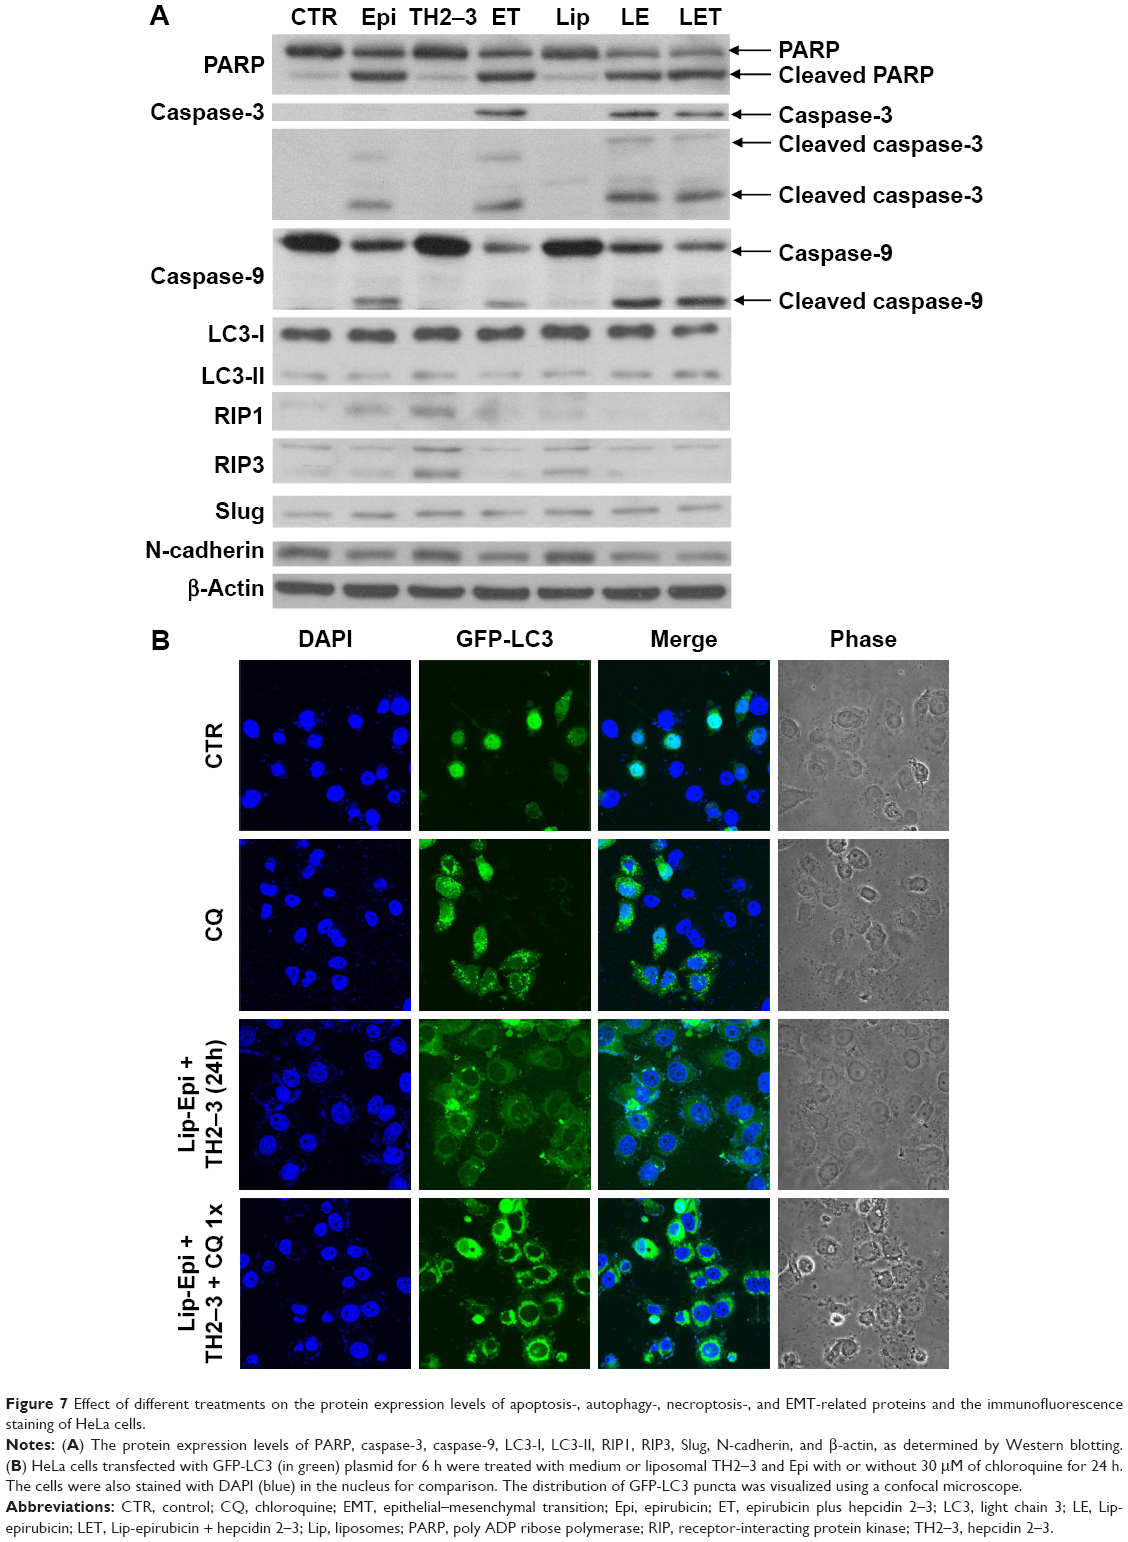 | Figure 7 Effect of different treatments on the protein expression levels of apoptosis-, autophagy-, necroptosis-, and EMT-related proteins and the immunofluorescence staining of HeLa cells. |
The combined treatment of hepcidin 2–3 and epirubicin in liposomal formulation provoked cell apoptosis (Figures 5 and 6) and activated autophagy (possibly for cancer death; Figure 7A and B), thus causing a decrease in the viability of HeLa cells to a higher level than that of free epirubicin (Figure 2E). It was manifested here that both apoptosis- and autophagy-mediated cell deaths were triggered to assist in reducing the acquired epirubicin resistance of HeLa cells.
Liposomal epirubicin and hepcidin 2–3 attenuated necropotosis in HeLa cells
Our findings indicated that treatment of HeLa cells with hepcidin 2–3 or epirubicin alone increased the expressions of RIP1 and RIP3 (possibly induced necropotosis for survival; Figure 7A). In contrast, the incubation with liposomal epirubicin and hepcidin 2–3 abolished the expressions of RIP1 and RIP, suggesting necropotosis inhibition after using this formulation for defeating the survival of HeLa cells (Figure 7A).
Liposomal epirubicin and hepcidin 2–3 suppressed epithelial–mesenchymal transition (EMT)
The modulation of the EMT by the single or combined treatment of epirubicin and hepcidin 2–3 was evaluated by Western blot, as shown in Figure 7A. We found that empty liposomes, hepcidin, or epirubicin alone slightly induced Slug and N-cadherin expressions. Interestingly, liposomal epirubicin and hepcidin 2–3 retreated the escalated protein expressions of Slug and N-cadherin (Figure 7A).
Discussion
AMPs exhibit selective activities on cancer cells by exhibiting excellent lytic action on malignant cells, allowing an optimal treatment in vivo with low therapeutic concentrations and mild side effects.1 For example, cotreatments of magainin analog, one AMP derivative and two anticancer drugs, cis-Platinum, and etoposide have shown synergistic antitumor effects, primarily due to the formation of voltage-dependent ion channels that change membrane potential and functionality.1,46
Hepcidin, composed of 20 amino acids, functions as an important regulator of intestinal iron absorption by binding to the iron exporter ferroportin, thus inhibiting iron absorption.47 In the process of inflammation, hepcidin can be secreted by the liver and retains mammalian iron balance.4 In addition, hepcidin 2–3 exhibited antimicrobial and antiviral activities.3,48 Transgenic hepcidin 2–3 zebrafish showed increased expressions of IL-10, IL-26, and toll-like receptor-4 when they were infected with Vibrio vulnificus.4 Hepcidin 2–3 was thus found to effectively decrease bacterial growth in transgenic zebrafish.4 Furthermore, hepcidin 2–3 demonstrated the antibacterial and immunomodulatory responses in mice infected with V. vulnificus.49 Hepcidin 2–3 thus enhanced the survival rate of mice against V. vulnificus, implying a good potential of this AMP to function as a vaccine adjuvant.49 Moreover, incubation with trichostatin A upregulated the expression of hepcidin in human hepatocellular carcinoma HepG2 cells, suggesting that suppression of histone deacetylation might increase hepcidin expression with a cancer interference potential.50 In addition, hepcidin 2–3 has been found to suppress the migration and proliferation of human fibrosarcoma cells via membrane disruption.5 The combined treatment of hepcidin 1–5 and epirubicin reduced cell growth in human squamous carcinoma and testicular carcinoma cells via ROS-mediated inhibition of MDR transporters and triggering of mitochondrial apoptosis pathway.8
Resistance to apoptotic signaling and overexpression of ABC transporters in cancer cells considerably reduced the effectiveness of cancer chemotherapy.51 Based on our current results, we suggest that PEGylated liposomal epirubicin and hepcidin 2–3 formulations might affect the levels of ROS and thus coordinately regulate transporter-, apoptosis- and/or autophagy-related mechanisms, thereby inducing MDR reversal. Increasing evidence has indicated that AMPs demonstrated selective cytotoxic activity and initiated apoptosis via intracellular ROS production (oxidative stress) and mitochondrial damage.1,52 Extrinsic factors such as antineoplastic agents and DNA-damaging agents also provoked the production of ROS in cancer cells.13,53 ROS may function as activators in cell death signaling.53 It has been reported that AMPs, such as arenicin-1, also triggered apoptosis via production of cytotoxic ROS.52 Furthermore, manumycin-A (Man-A), a natural antibiotic isolated from the microbial metabolite of Streptomyces parvulus,54 has been found to suppress Ras maturation and display a potent tumorcidal action. Furthermore, Man-A induced a ROS-mediated dephosphorylation of MEK and Akt and intensified caspase-associated apoptosis in B-cell lymphoma cell lines.54
However, the clinical application of AMPs including hepcidin 2–3 has traditional problems, such as poor pharmacokinetic profiles and possible hemolytic toxicity. The use of PEGylated liposomal formulation to incorporate epirubicin and hepcidin 2–3 may circumvent this obstacle. In this study, our liposomal preparations with particle size ~100 nm and net positive charge might increase their electrostatic interaction with an anionic surface of tumor cells (Figure 1C and Table 1). Cotreatment of HeLa cells with PEGylated liposomal formulation of epirubicin and hepcidin 2–3 gave rise to a significant increase in the cytotoxicity of epirubicin (Figure 2E). The liposomal formulations of epirubicin and/or hepcidin 2–3 were found to noticeably increase the intracellular H2O2 and O2− levels of cancer cells (Figure 3). Moreover, these treatments were demonstrated to considerably reduce mRNA expression levels of MDR1, MRP1, and MRP2 (Figure 4A). The addition of hepcidin 2–3 in liposomes was shown to markedly enhance the epirubicin uptake in cells and mainly localized into the nucleus (Figure 4B–D). In addition, this formulation was found to trigger apoptosis in HeLa cells, as validated by significant increases in the expressions of p53, Bax, caspase-3, and caspase-9 (Figures 6 and 7A), as well as a decrease in mitochondrial membrane potential (Figure 5A). The apoptosis induction was also confirmed by the rise in sub-G1 phase of cell cycle assay (Figure 5B) and the apoptosis percentage of annexin V/PI assay (Figure 5C). The involvement of apoptosis induction in this liposomal formulation-mediated cell death was thus verified.
Autophagy is another possible pathway of cell death, which is usually associated with an increased expression of LC3-II, a recognized autophagosome marker.19 In this study, we found that liposomal epirubicin and hepcidin 2–3 induced autophagy in HeLa cells, as signified by the increase in the expression of LC3-II and enhancement in the accumulation of GFP-LC3 puncta, which was further amplified by chloroquine (Figure 7A and B). These findings may imply the involvement of autophagy in HeLa cell death provoked by this formulation.
Moreover, other possible mechanism(s) for treatment failure of anticancer drugs are that many tumor cells have emerged apoptotic escape or other survival pathways such as necroptosis to become chemoresistant.51 The role of necropotosis for survival or death should be dependent on the microenvironment of cancer. Accumulating studies have supported RIP1 as a key moderator of cell survival signaling, while other reports have suggested a prodeath role of RIP1.22,24,55 Wang et al22 have found that RIP1 played a crucial role in survival through catalase-mediated ROS reduction and maintenance of inhibitor of apoptosis proteins, thus enhancing chemoresistance to cisplatin in human lung cancer A549 cells. The activation of necropotosis was verified by the induction of RIP1 and RIP3, which was abrogated by necropotosis inhibitor necrostatin-1.56 In this study, incubation of HeLa cells with hepcidin 2–3 or epirubicin alone upregulated the expressions of RIP1 and RIP3 (Figure 7A), indicating the possible triggering of necropotosis for survival. On the contrary, the combined treatment with liposomal epirubicin and hepcidin 2–3 abrogated the induction of RIP1 and RIP3 (Figure 7A), revealing the suppression of necropotosis after using this formulation in HeLa cells for inhibiting cancer cell survival.
Transition from epithelial phenotype to mesenchymal phenotype also plays an important role in the chemoresistance of cervical cancers to subsequently diminish paclitaxel sensitivity.57 Our finding showed that the mild increase in Slug and N-cadherin expressions after treatment with free or liposomal hepcidin or Lip-epirubicin alone indicated the triggering of EMT, which led to epirubicin resistance. Contrarily, liposomal epirubicin and hepcidin 2–3 abolished the incremental expressions of Slug and N-cadherin (Figure 7A), supporting that this formulation may annul the acquired mechanism of epirubicin resistance at least partially via reversal of EMT in cervical cancer cells.
In this study, we suggest that the major antineoplastic mechanism of liposomal hepcidin 2–3 and Lip-epirubicin for killing HeLa cells was activation of apoptosis (Figures 5 and 6). Nevertheless, we suspect that HeLa cancer cells struggled under a cell survival and death signaling network for evading the cytotoxicity of chemotherapy in the microenvironment of oxidative stress. Although enhancing survival and escaping apoptosis are characteristics of cancer cells, our findings indicate that liposomal epirubicin and hepcidin 2–3 escalated the production of ROS, including high levels of H2O2 and O2− (Figure 3) and thereby diminished the survival via necropotosis (Figure 7) and provoked death via apoptosis (major death pattern; Figures 5 and 6) and/or autophagy (minor death pattern; Figure 7). This interposition that favors the death and survival balance toward death may resensitize HeLa cells to anticancer drug epirubicin and modulator hepcidin 2–3 in the PEGylated liposomal formulation. The multiple signaling pathways for inhibiting MDR transporters and modulating apoptosis and/or autophagy by PEGylated liposomal hepcidin 2–3 and Lip-epirubicin in HeLa cells are shown in Figure 8.
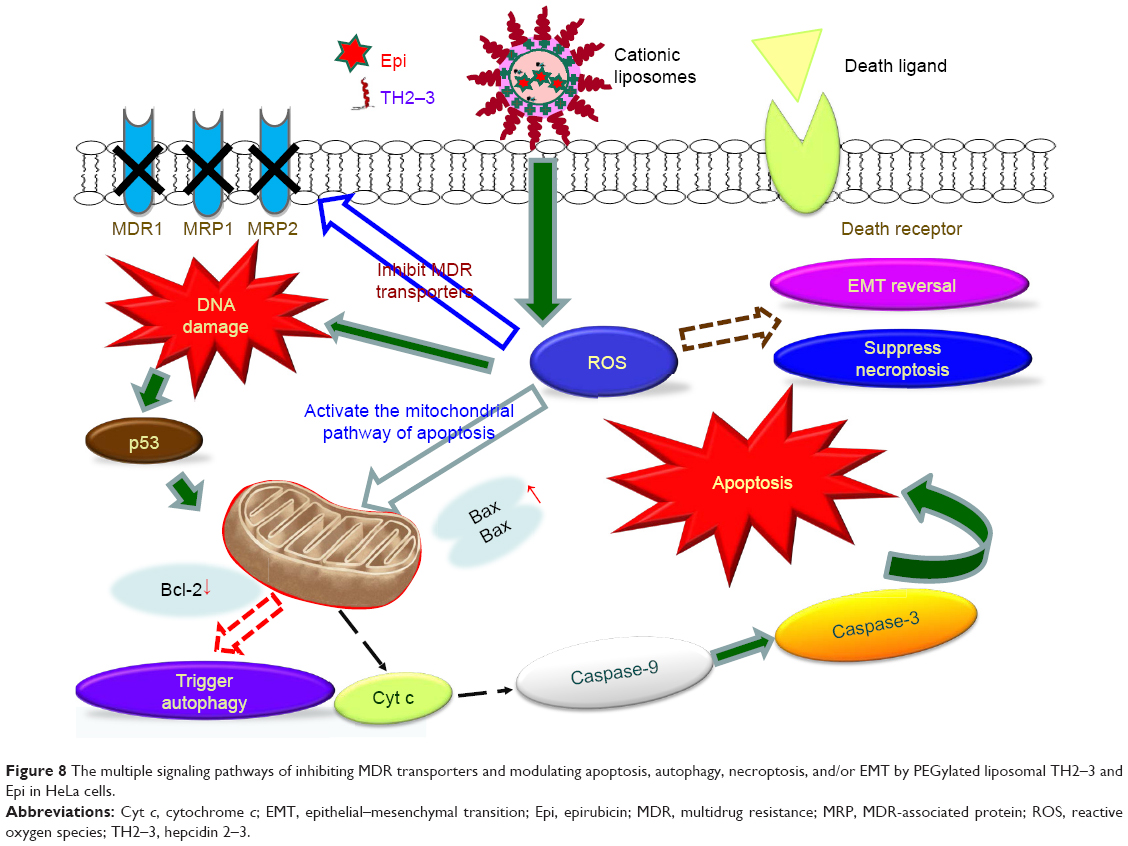 | Figure 8 The multiple signaling pathways of inhibiting MDR transporters and modulating apoptosis, autophagy, necroptosis, and/or EMT by PEGylated liposomal TH2–3 and Epi in HeLa cells. |
Conclusion
The complicated regulation of chemoresistance urges the need for a multifunctional delivery system of epirubicin and hepcidin 2–3 for which efflux pump proteins and complex apoptosis, autophagy, and/or necropotosis pathways are concurrently modulated to make significant improvement in chemotherapy efficacy. In summary, PEGylated liposomal hepcidin 2–3- and Lip-epirubicin-based combinatorial therapy effectively inhibited HeLa cancer cell growth, which was associated with decreased expressions and functions of MDR transporter, reversal of EMT, modulation of necropotosis and/or autophagy, and activation of mitochondrial apoptosis signaling.
Acknowledgments
This study was financially supported by grants from the Ministry of Science and Technology of Taiwan (MOST 104–2320-B-010–004-MY2), the National Science Council of Taiwan (NSC 102–2320-B-024–002), the Veterans General Hospitals and University System of Taiwan (VGHUST105-G7-8–3), the Ministry of Education, Aiming for the Top University Plan, and the National Yang-Ming University (103AC-D112). We thank Dr JY Chen of Marine Research Station, Institute of Cellular and Organismic Biology, Academia Sinica, for providing hepcidin 2–3 used in this study.
Disclosure
The authors report no conflicts of interest in this work.
References
Oyinloye BE, Adenowo AF, Kappo AP. Reactive oxygen species, apoptosis, antimicrobial peptides and human inflammatory diseases. Pharmaceuticals (Basel). 2015;8(2):151–175. | ||
Huang C, Jin H, Qian Y, et al. Hybrid melittin cytolytic peptide-driven ultrasmall lipid nanoparticles block melanoma growth in vivo. ACS Nano. 2013;7(7):5791–5800. | ||
Huang PH, Chen JY, Kuo CM. Three different hepcidins from tilapia, Oreochromis mossambicus: analysis of their expressions and biological functions. Mol Immunol. 2007;44(8):1922–1934. | ||
Hsieh JC, Pan CY, Chen JY. Tilapia hepcidin (TH)2–3 as a transgene in transgenic fish enhances resistance to Vibrio vulnificus infection and causes variations in immune-related genes after infection by different bacterial species. Fish Shellfish Immunol. 2010;29(3):430–439. | ||
Chen JY, Lin WJ, Lin TL. A fish antimicrobial peptide, tilapia hepcidin TH2-3, shows potent antitumor activity against human fibrosarcoma cells. Peptides. 2009;30(9):1636–1642. | ||
Chen C, Hu J, Zeng P, et al. Molecular mechanisms of anticancer action and cell selectivity of short alpha-helical peptides. Biomaterials. 2014;35(5):1552–1561. | ||
Pan CY, Lin CN, Chiou MT, Yu CY, Chen JY, Chien CH. The antimicrobial peptide pardaxin exerts potent anti-tumor activity against canine perianal gland adenoma. Oncotarget. 2015;6(4):2290–2301. | ||
Lo YL, Lee HP, Tu WC. The use of a liposomal formulation incorporating an antimicrobial peptide from tilapia as a new adjuvant to epirubicin in human squamous cell carcinoma and pluripotent testicular embryonic carcinoma cells. Int J Mol Sci. 2015;16(9):22711–22734. | ||
Maras JS, Maiwall R, Harsha HC, et al. Dysregulated iron homeostasis is strongly associated with multiorgan failure and early mortality in acute-on-chronic liver failure. Hepatology. 2015;61(4):1306–1320. | ||
Lunova M, Goehring C, Kuscuoglu D, et al. Hepcidin knockout mice fed with iron-rich diet develop chronic liver injury and liver fibrosis due to lysosomal iron overload. J Hepatol. 2014;61(3):633–641. | ||
Huang YH, Yang YL, Tiao MM, Kuo HC, Huang LT, Chuang JH. Hepcidin protects against lipopolysaccharide-induced liver injury in a mouse model of obstructive jaundice. Peptides. 2012;35(2):212–217. | ||
Baguley BC. Multiple drug resistance mechanisms in cancer. Mol Biotechnol. 2010;46(3):308–316. | ||
Lo YL, Wang W, Ho CT. 7,3′,4′-Trihydroxyisoflavone modulates multidrug resistance transporters and induces apoptosis via production of reactive oxygen species. Toxicology. 2012;302(2–3):221–232. | ||
Lage H. An overview of cancer multidrug resistance: a still unsolved problem. Cell Mol Life Sci. 2008;65(20):3145–3167. | ||
Yu X, Yang G, Shi Y, et al. Intracellular targeted co-delivery of shMDR1 and gefitinib with chitosan nanoparticles for overcoming multidrug resistance. Int J Nanomedicine. 2015;10:7045–7056. | ||
Wang X, Wang C, Qin YW, Yan SK, Gao YR. Simultaneous suppression of multidrug resistance and antiapoptotic cellular defense induces apoptosis in chemoresistant human acute myeloid leukemia cells. Leuk Res. 2007;31(7):989–994. | ||
Lo YL, Ho CT, Tsai FL. Inhibit multidrug resistance and induce apoptosis by using glycocholic acid and epirubicin. Eur J Pharm Sci. 2008;35(1–2):52–67. | ||
Zeng M, Zhou JN. Roles of autophagy and mTOR signaling in neuronal differentiation of mouse neuroblastoma cells. Cell Signal. 2008;20(4):659–665. | ||
Eum KH, Lee M. Targeting the autophagy pathway using ectopic expression of beclin 1 in combination with rapamycin in drug-resistant v-Ha-ras-transformed NIH 3T3 cells. Mol Cells. 2011;31(3):231–238. | ||
Lai WT, Cheng KL, Baruchello R, et al. Hemiasterlin derivative (R)(S)(S)-BF65 and Akt inhibitor MK-2206 synergistically inhibit SKOV3 ovarian cancer cell growth. Biochem Pharmacol. 2016;113:12–23. | ||
Wang B, Feng D, Han L, et al. Combination of apolipoprotein A1-modi liposome-doxorubicin with autophagy inhibitors overcame drug resistance in vitro. J Pharm Sci. 2014;103(12):3994–4004. | ||
Wang Q, Chen W, Bai L, et al. Receptor-interacting protein 1 increases chemoresistance by maintaining inhibitor of apoptosis protein levels and reducing reactive oxygen species through a microRNA-146a-mediated catalase pathway. J Biol Chem. 2014;289(9):5654–5663. | ||
Su Z, Yang Z, Xu Y, Chen Y, Yu Q. Apoptosis, autophagy, necroptosis, and cancer metastasis. Mol Cancer. 2015;14(2):48–61. | ||
Zhang L, Blackwell K, Workman LM, et al. RIP1 cleavage in the kinase domain regulates TRAIL-induced NF-kappaB activation and lymphoma survival. Mol Cell Biol. 2015;35(19):3324–3338. | ||
Sun Y, Liu JH, Jin L, et al. Over-expression of the beclin1 gene upregulates chemosensitivity to anti-cancer drugs by enhancing therapy-induced apoptosis in cervix squamous carcinoma CaSki cells. Cancer Lett. 2010;294(2):204–210. | ||
Lee TG, Jeong EH, Kim SY, Kim HR, Kim CH. The combination of irreversible EGFR TKIs and SAHA induces apoptosis and autophagy-mediated cell death to overcome acquired resistance in EGFR T790M-mutated lung cancer. Int J Cancer. 2015;136(11):2717–2729. | ||
Lee YK, Lin TH, Chang CF, et al. Galectin-3 silencing inhibits epirubicin-induced ATP binding cassette transporters and activates the mitochondrial apoptosis pathway via beta-catenin/GSK-3beta modulation in colorectal carcinoma. PLoS One. 2013;8(11):e82478. | ||
Men Y, Wang XX, Li RJ, et al. The efficacy of mitochondrial targeting antiresistant epirubicin liposomes in treating resistant leukemia in animals. Int J Nanomedicine. 2011;6:3125–3137. | ||
Lo YL, Liu Y. Reversing multidrug resistance in Caco-2 by silencing MDR1, MRP1, MRP2, and BCL-2/BCL-xL using liposomal antisense oligonucleotides. PLoS One. 2014;9(3):e90180. | ||
Xie JM, Li B, Yu HP, et al. TIGAR has a dual role in cancer cell survival through regulating apoptosis and autophagy. Cancer Res. 2014;74(18):5127–5138. | ||
Kim Y, Jeong IG, You D, et al. Sodium meta-arsenite induces reactive oxygen species-dependent apoptosis, necrosis, and autophagy in both androgen-sensitive and androgen-insensitive prostate cancer cells. Anticancer Drugs. 2014;25(1):53–62. | ||
Chittaranjan S, Bortnik S, Dragowska WH, et al. Autophagy inhibition augments the anticancer effects of epirubicin treatment in anthracycline-sensitive and -resistant triple-negative breast cancer. Clin Cancer Res. 2014;20(12):3159–3173. | ||
Ge J, Chen Z, Huang J, et al. Upregulation of autophagy-related gene-5 (ATG-5) is associated with chemoresistance in human gastric cancer. PLoS One. 2014;9(10):e110293. | ||
Enayat S, Seyma Ceyhan M, Taskoparan B, et al. CHNQ, a novel 2-chloro-1,4-naphthoquinone derivative of quercetin, induces oxidative stress and autophagy both in vitro and in vivo. Arch Biochem Biophys. 2016;596:84–98. | ||
Mangoni ML. Host-defense peptides: from biology to therapeutic strategies. Cell Mol Life Sci. 2011;68(13):2157–2159. | ||
Lin MC, Lin SB, Chen JC, Hui CF, Chen JY. Shrimp anti-lipopolysaccharide factor peptide enhances the antitumor activity of cisplatin in vitro and inhibits HeLa cells growth in nude mice. Peptides. 2010;31(6):1019–1025. | ||
Li SD, Huang L. Targeted delivery of antisense oligodeoxynucleotide and small interference RNA into lung cancer cells. Mol Pharm. 2006;3(5):579–588. | ||
Lo YL. Relationships between the hydrophilic-lipophilic balance values of pharmaceutical excipients and their multidrug resistance modulating effect in Caco-2 cells and rat intestines. J Control Release. 2003;90(1):37–48. | ||
Teng YC, Jeng CJ, Huang HJ, et al. Role of autophagy in arsenite-induced neurotoxicity: the involvement of alpha-synuclein. Toxicol Lett. 2015;233(3):239–245. | ||
Jo GH, Bogler O, Chwae YJ, et al. Radiation-induced autophagy contributes to cell death and induces apoptosis partly in malignant glioma cells. Cancer Res Treat. 2015;47(2):221–241. | ||
Tang MC, Wu MY, Hwang MH, et al. Chloroquine enhances gefitinib cytotoxicity in gefitinib-resistant nonsmall cell lung cancer cells. PLoS One. 2015;10(3):e0119135. | ||
Hung KC, Huang HJ, Lin MW, et al. Roles of autophagy in MPP+-induced neurotoxicity in vivo: the involvement of mitochondria and alpha-synuclein aggregation. PLoS One. 2014;9(3):e91074. | ||
Zheng K, Liao C, Li Y, et al. Gypenoside L, isolated from Gynostemma pentaphyllum, induces cytoplasmic vacuolation death in hepatocellular carcinoma cells through reactive-oxygen-species-mediated unfolded protein response. J Agric Food Chem. 2016;64(8):1702–1711. | ||
Lee G, Oh TI, Um KB, et al. Small-molecule inhibitors of USP7 induce apoptosis through oxidative and endoplasmic reticulum stress in cancer cells. Biochem Biophys Res Commun. 2016;470(1):181–186. | ||
Jin S, Zhang QY, Kang XM, Wang JX, Zhao WH. Daidzein induces MCF-7 breast cancer cell apoptosis via the mitochondrial pathway. Ann Oncol. 2010;21(2):263–268. | ||
Ohsaki Y, Gazdar AF, Chen HC, Johnson BE. Antitumor activity of magainin analogues against human lung cancer cell lines. Cancer Res. 1992;52(13):3534–3538. | ||
Lee PL, Beutler E. Regulation of hepcidin and iron-overload disease. Annu Rev Pathol. 2009;4(1):489–515. | ||
Wang YD, Kung CW, Chen JY. Antiviral activity by fish antimicrobial peptides of epinecidin-1 and hepcidin 1–5 against nervous necrosis virus in medaka. Peptides. 2010;31(6):1026–1033. | ||
Pan CY, Lee SC, Rajanbabu V, Lin CH, Chen JY. Insights into the antibacterial and immunomodulatory functions of tilapia hepcidin (TH)2–3 against Vibrio vulnificus infection in mice. Dev Comp Immunol. 2012;36(1):166–173. | ||
Kanamori Y, Murakami M, Matsui T, Funaba M. The regulation of hepcidin expression by serum treatment: requirements of the BMP response element and STAT- and AP-1-binding sites. Gene. 2014;551(2):119–126. | ||
Su Z, Yang Z, Xie L, DeWitt JP, Chen Y. Cancer therapy in the necroptosis era. Cell Death Differ. 2016;23(5):748–756. | ||
Hwang B, Hwang JS, Lee J, Lee DG. The antimicrobial peptide, psacotheasin induces reactive oxygen species and triggers apoptosis in Candida albicans. Biochem Biophys Res Commun. 2011;405(2):267–271. | ||
Trachootham D, Alexandre J, Huang P. Targeting cancer cells by ROS-mediated mechanisms: a radical therapeutic approach? Nat Rev Drug Discov. 2009;8(7):579–591. | ||
Carey GB, Roy SK, Daino H. The natural tumorcide manumycin-A targets protein phosphatase 1alpha and reduces hydrogen peroxide to induce lymphoma apoptosis. Exp Cell Res. 2015;332(1):136–145. | ||
Kharaziha P, Chioureas D, Baltatzis G, et al. Sorafenib-induced defective autophagy promotes cell death by necroptosis. Oncotarget. 2015;6(35):37066–37082. | ||
Deng Q, Yu X, Xiao L, et al. Neoalbaconol induces energy depletion and multiple cell death in cancer cells by targeting PDK1-PI3-K/Akt signaling pathway. Cell Death Dis. 2013;4:e804. | ||
Shen Y, Zhou J, Li Y, et al. miR-375 mediated acquired chemo-resistance in cervical cancer by facilitating EMT. PLoS One. 2014;9(10):e109299. |
 © 2016 The Author(s). This work is published and licensed by Dove Medical Press Limited. The
full terms of this license are available at https://www.dovepress.com/terms
and incorporate the Creative Commons Attribution
- Non Commercial (unported, 3.0) License.
By accessing the work you hereby accept the Terms. Non-commercial uses of the work are permitted
without any further permission from Dove Medical Press Limited, provided the work is properly
attributed. For permission for commercial use of this work, please see paragraphs 4.2 and 5 of our Terms.
© 2016 The Author(s). This work is published and licensed by Dove Medical Press Limited. The
full terms of this license are available at https://www.dovepress.com/terms
and incorporate the Creative Commons Attribution
- Non Commercial (unported, 3.0) License.
By accessing the work you hereby accept the Terms. Non-commercial uses of the work are permitted
without any further permission from Dove Medical Press Limited, provided the work is properly
attributed. For permission for commercial use of this work, please see paragraphs 4.2 and 5 of our Terms.