Back to Journals » Vascular Health and Risk Management » Volume 11
Cardiovascular risk assessment in type 2 diabetes mellitus: comparison of the World Health Organization/International Society of Hypertension risk prediction charts versus UK Prospective Diabetes Study risk engine
Authors Herath H, Weerarathna T, Umesha D
Received 8 June 2015
Accepted for publication 10 September 2015
Published 13 November 2015 Volume 2015:11 Pages 583—589
DOI https://doi.org/10.2147/VHRM.S90126
Checked for plagiarism Yes
Review by Single anonymous peer review
Peer reviewer comments 2
Editor who approved publication: Dr Daniel Duprez
Herath M Meththananda Herath, Thilak Priyantha Weerarathna, Dilini Umesha
Department of Medicine, Faculty of Medicine, University of Ruhuna, Galle, Sri Lanka
Introduction: Patients with type 2 diabetes mellitus (T2DM) are at higher risk of developing cardiovascular diseases, and assessment of their cardiac risk is important for preventive strategies.
Purpose: The Ministry of Health of Sri Lanka has recommended World Health Organization/International Society of Hypertension (WHO/ISH) charts for cardiac risk assessment in individuals with T2DM. However, the most suitable cardiac risk assessment tool for Sri Lankans with T2DM has not been studied. This study was designed to evaluate the performance of two cardiac risk assessments tools; WHO/ISH charts and UK Prospective Diabetes Study (UKPDS) risk engine.
Methods: Cardiac risk assessments were done in 2,432 patients with T2DM attending a diabetes clinic in Southern Sri Lanka using the two risk assessment tools. Validity of two assessment tools was further assessed by their ability to recognize individuals with raised low-density lipoprotein (LDL) and raised diastolic blood pressure in a cohort of newly diagnosed T2DM patients (n=332).
Results: WHO/ISH charts identified 78.4% of subjects as low cardiac risk whereas the UKPDS risk engine categorized 52.3% as low cardiac risk (P<0.001). In the risk categories of 10%–<20%, the UKPDS risk engine identified higher proportions of patients (28%) compared to WHO/ISH charts (7%). Approximately 6% of subjects were classified as low cardiac risk (<10%) by WHO/ISH when UKPDS recognized them as cardiac risk of >20%. Agreement between the two tools was poor (κ value =0.144, P<0.01). Approximately 82% of individuals categorized as low cardiac risk by WHO/ISH had higher LDL cholesterol than the therapeutic target of 100 mg/dL.
Conclusion: There is a significant discrepancy between the two assessment tools with WHO/ISH risk chart recognizing higher proportions of patients having low cardiac risk than the UKPDS risk engine. Risk assessment by both assessment tools demonstrated poor sensitivity in identifying those with treatable levels of LDL cholesterol and diastolic blood pressure.
Keywords: cardiovascular disease, type 2 diabetes, risk assessment, WHO/ISH risk prediction charts, UKPDS risk engine
Introduction
Cardiovascular disease (CVD) accounts for substantial morbidity and mortality in people with type 2 diabetes mellitus (T2DM).1 They have a considerably higher risk of having CVD compared with age- and sex-matched patients without T2DM.1,2 Due to the heterogeneous nature of the disease, prevalence and pattern of CVD risk factors vary among individuals with T2DM3 and therefore the risk of developing cardiovascular events such as coronary artery disease and stroke is also different.
Several primary prevention strategies are proven to be effective in reducing future cardiovascular events in patients with T2DM. In particular, lipid-lowering therapy with statin, blood pressure control with antihypertensives, and antiplatelet therapy with aspirin have been shown to be effective in patients with T2DM.4–6 Indications of these primary preventive strategies are decided based on the cardiac risk. For an example, aspirin therapy is recommended by the American Diabetes Association (ADA) for patients with T2DM with a 10-year cardiac risk of 10% or above.6 Although interventions focused on individual CVD risk factors have proven benefits in patients with T2DM, a previous study has shown that adopting total risk approach, in comparison to treatment decisions being based on the level of a single risk factor, could lead to reductions in expenditure.7
Over the past few decades, several risk assessment tools have been developed to estimate the total CVD risk in individuals with T2DM. The Framingham risk score is one of the most widely used risk assessment tools globally. It is based on the findings of the Framingham study conducted predominantly among the Caucasian population.8 The UK Prospective Diabetes Study (UKPDS) risk engine is another risk assessment tool, which was developed based on data from this study. Unlike other risk assessment tools, the UKPDS risk engine is diabetes-specific and it incorporates glycemia, systolic blood pressure (SBP), and lipid levels as risk factors, in addition to age, sex, ethnic group, smoking status, and time since diagnosis of diabetes.9
Based on the findings of epidemiological surveys on the prevalence and magnitude of CVD risk factors in the South Asian region, the World Health Organization/International Society of Hypertension (WHO/ISH) has developed a risk assessment tool suitable for use in individuals with diabetes in the region.9,10 These WHO/ISH charts use five parameters that can be measurable at low resource, primary care setting and include sex, age, SBP, smoking status, and serum total cholesterol (TC). Using the WHO/ISH charts, an individual’s risk of developing a vascular event during the next 10 years is predicted as a probability.9 However, the major modifiable CVD risk factors in diabetes such as low-density lipoprotein (LDL) cholesterol and diastolic blood pressure (DBP) for which therapeutic interventions have shown proven benefits have not been included in the WHO/ISH charts in order to reduce the cost of its application in the resource poor setting.
The Ministry of Health in Sri Lanka has recommended the use of WHO/ISH charts for screening of individuals in the primary care setting and professional organizations such as the Ceylon College of Physicians, have endorsed this approach. However, the validity of WHO/ISH risk assessment tool in identifying high risk individuals among Sri Lankans with T2DM has not been studied yet.
This study was designed to: 1) estimate the prevalence of CVD risk factors in patients with T2DM, 2) to compare CVD risk estimated by two different tools (WHO/ISH risk prediction charts and UKPDS risk engine), and 3) assess the validity of two risk prediction tools by their ability to detect individuals with raised LDL and DBP based on their cardiac risk.
Methods
Study design and sample
This cross sectional study was carried out in a regional diabetes center in Southern Sri Lanka. The sample for this study was selected from a cohort of patients with T2DM who underwent screening at this center during the period from January 2009 to December 2011.
In all study subjects (n=2,432), a pretested interviewer-administered questionnaire was used to obtain demographic and medical information such as age, sex, ethnicity, tobacco smoking, and family history of dyslipidemia. Height was measured to the nearest cm and body weight to the nearest 0.1 kg. Body mass index (BMI) was calculated as weight in kg divided by height in m2. All anthropometric measurements were performed by trained nurses adhering to the WHO guidelines, using calibrated equipment. Blood pressure was recorded using an electronic instrument (Omron Corporation, Tokyo, Japan), as the mean of two readings taken 5 minutes apart. Blood samples for plasma glucose and lipid profile were collected and plasma glucose was measured using the hexokinase enzymatic method (Cobas analyzer, Roche Diagnostics). Total serum cholesterol was measured using a cholesterol oxidase enzymatic method and direct magnesium/dextran sulfate method was used to measure high-density lipoprotein (HDL) cholesterol. Friedewald equation was used to calculate LDL cholesterol.
CVD risk factors
Based on the ADA guidelines 2014, dyslipidemia was defined as follows:6 LDL cholesterol levels above 100 mg/dL, triglyceride levels above 150 mg/dL, HDL cholesterol levels below 50 mg/dL in females and below 40 mg/dL in males. In addition, individuals on lipid lowering medications were also considered as having dyslipidemia. Hypertension was defined as SBP 140 mmHg or greater, DBP 90 mmHg or greater, or receiving antihypertensive medication. Obesity was defined as a BMI of 27 kg/m2 or greater.
CVD risk assessment
We used two risk prediction tools namely UKPDS risk engine and WHO/ISH risk prediction charts for South East Asian Region with diabetes mellitus (SEAR B) to assess the prevalence of CVD risk among patients with T2DM over 10 years. Each patient’s 10-year CVD risk was classified by both risk assessment tools into one of four risk levels: <10%, 10%–<20%, 20%–<30%, ≥30%. The proportion of patients with adverse LDL cholesterol and DBP levels who need therapeutic intervention in the three CVD risk categories of <30% but >20%, <20% but >10% and <10% were then estimated. The cutoff values recommended by the ADA to commence therapeutic interventions for adverse levels of LDL and DBP in subjects with diabetes were used. These include LDL ≥100 mg/dL and DBP >90 mmHg.
Validity of risk prediction tools
The validity of any risk score depends upon its ability to accurately predict the cardiac risk by identifying individuals with adverse cardiac risk factors. High LDL cholesterol and DBP are important modifiable CVD risk factors, and optimization of these two risk factors have shown to be associated with significantly better outcome. Even though risk prediction tools are designed to predict cardiac risk, the validity of the risk prediction can also be assessed by their ability to recognize high risk individuals with multiple risk factors. As high LDL cholesterol and DBP are not components of both risk prediction tools, ability to detect raised LDL and DBP is used in our study to assess the validity of risk predication tools. For this, we selected a cohort of newly diagnosed patients with T2DM (n=332), aged 20 years or more, free of CVD (stable and unstable angina, myocardial infarction, heart failure, coronary artery bypass graft, coronary angioplasty/stenting, and stroke) as ascertained from their clinical records. Sensitivity and specificity of each risk prediction tool to detect raised LDL and DBP needing therapeutic intervention was then assessed.
Ethical consideration
Ethical approval for this study was obtained from the Research and Ethics Committee, Faculty of Medicine, University of Ruhuna, Sri Lanka. Written informed consent was obtained from all the study participants.
Results
Baseline characteristics
There were 2,432 patients with T2DM in the sample. Of them, 64% (n=1,566) were males, and mean age of males was 48.3 years (standard deviation [SD] =10.6) and females was 53.6 years (SD =11.5; P=0.001). Males and females were not significantly different in BMI, waist circumference, SBP, DBP, TC, and LDL. Overall, both males and females had relatively high BMI with mean BMI of 24.4 kg/m2 (SD =4.1) and high LDL cholesterol with mean value of 130.3 mg/dL (Table 1).
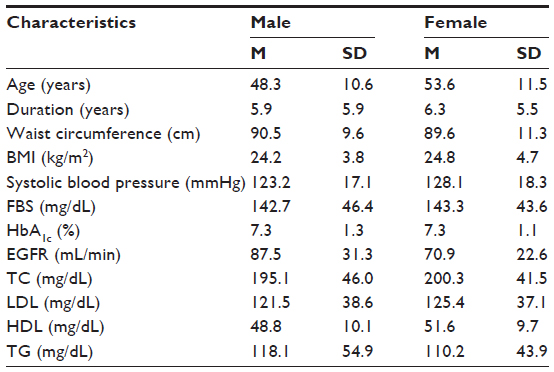 | Table 1 Baseline characteristics of study sample |
Of the study subjects, 69% had been on statins (atorvastatin 78%, rosuvastatin 20%, and simvastatin 2%) at the time of recruitment and 64% had been on antihypertensive therapy. The most commonly used antihypertensive medication was angiotensin II receptor blockers (52%) followed by angiotensin converting enzyme inhibitors (36%). In addition, 27% of the study subjects were on aspirin or clopidogrel as a primary preventive strategy.
Prevalence of major CVD risk factors among diabetes patients
Overall prevalence of dyslipidemia with at least one abnormal lipid parameter or statin therapy was seen in 89.3% subjects. Raised LDL cholesterol was the commonest lipid abnormality affecting 84% of subjects. Hypertriglyceridemia and low HDL were comparatively less common, accounting for 19.1% and 17.6% respectively. Hypertension was observed in 69.2% (1,685/2,432) subjects with isolated elevated DBP, accounting for 48.1% (1,171/2,432). Overall, 18.2% subjects were obese; prevalence of obesity in females was 22.2% in comparison to 15.8% in males.
CVD risk categories by two assessment tools
WHO/ISH prediction charts identified 78.4% (1910/2432) of subjects having CVD risk <10% which was significantly higher when compared to 52.3% (1274/2432) recognized by UKPDS risk engine (P<0.001) (Table 2). However, in the risk categories of 10%–<20%, and 20%–<30%, the UKPDS risk engine identified higher proportions of patients (28% and 6%, respectively) than the WHO/ISH charts (7% and 2%, respectively). An almost similar proportion of sample (1.9% by WHO/ISH risk charts and 2.1% by UKPDS risk engine) was categorized as highest cardiac risk of ≥30% by both tools (Table 2). The earlier findings revealed a significant discrepancy of performance between two assessment tools, with UKPDS risk engine recognizing more patients as having higher cardiac risk than WHO/ISH risk charts.
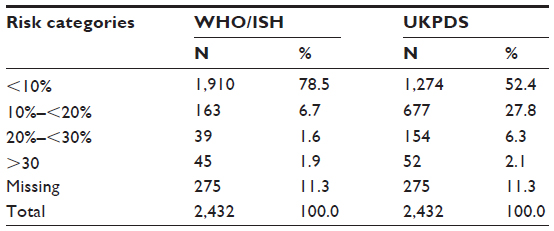 | Table 2 Number of patients with T2DM by categories of 10-year total cardiovascular disease risk using the WHO/ISH and UKPDS risk charts |
Table 3 shows the comparison of WHO/ISH and UKPDS risk charts in their ability to categorize patients with T2DM into different risk categories. Both tools recognized 56.6% (1,221/2,157) of the sample as having low cardiac risk of <10%. Interestingly, approximately 6% of subjects who were classified as low cardiac risk by WHO/ISH risk chart were recognized as having high cardiac risk of >20% by UKPDS risk chart. Furthermore, 26% (565/2,157) of patients were classified as having moderate cardiac risk (10%–<20%) by UKPDS risk chart when WHO/ISH categorized them as low cardiac risk (<10%). Agreement between the two tools was poor, especially with higher cardiac risk. Only 13% (7/52) of patients classified as very high cardiac risk (>30%) by UKPDS risk chart were recognized as having the same cardiac risk by WHO/ISH. Vice versa is also correct as only 20% (7/35) of the very high cardiac risk patients recognized by WHO/ISH were recognized as very high cardiac risk by UKPDS. Majority of patients (76.9%) who were originally categorized as very high risk (>30%) by UKPDS would have been classified as low or moderate cardiac risk (<20%) if WHO/ISH risk chart was used as the risk assessment tool.
 | Table 3 Comparison of WHO/ISH and UKPDS risk charts in their ability to categorize patients with T2DM into different risk categories |
In order to estimate the degree of agreement between the two risk assessment tools, the kappa value (κ value) was calculated (Table 4). κ value for agreement for identifying various risk categories by two assessment tools was 0.144 (P<0.01). These findings reveal a significant discrepancy between two assessment tools with UKPDS risk engine, recognizing more patients having higher cardiac risk.
 | Table 4 κ value for WHO/ISH and UKPDS risk charts |
Validity of risk assessment by two methods
The validity of risk prediction of the two risk prediction tools was assessed by their ability to recognize individuals with high LDL cholesterol and DBP in newly diagnosed diabetes patients (n=332).
As shown in Table 5, approximately 82% of individuals had LDL cholesterol more than the therapeutic target of 100 mg/dL in low CVD risk category (risk <10%) recognized by WHO/ISH. In the same risk category, 14% of individuals had LDL more than 160 mg/dL. Therefore, we can conclude that over 80% of the newly diagnosed diabetes patients would miss out on therapeutic intervention for raised LDL if the therapeutic decision is made solely on the cardiac risk by WHO/ISH alone. Approximately 82% of subjects with low cardiac risk recognized by UKPDS risk engine had raised LDL cholesterol. Thus, both the assessment tools have poor ability to recognize high risk individuals based on the LDL level.
 | Table 5 LDL levels in low cardiac risk subjects (<10%) according to WHO/ISH and UKPDS risk engine |
As shown in Table 6, approximately 65% of patients (29/44) with DBP over 90 mmHg were categorized as low cardiac risk (<10%) by WHO/ISH. In comparison, approximately 47% of patients with DBP over 90 mmHg were classified as low cardiac risk by UKPDS risk engine. Thus, the trend of categorizing patients with high DBP into low cardiac risk category was more frequent with WHO/ISH risk chart than UKPDS risk chart. However at-risk category of 10%–20% WHO/ISH risk chart identified more patients as having high DBP (71%) than UKPDS charts (21%).
 | Table 6 Diastolic blood pressure (DBP) in different risk categories according to UKPDS and WHO/ISH risk score |
The sensitivity and specificity of WHO/ISH and UKPDS risk charts at threshold level of cardiac risk ≥10% in detecting the levels of DBP needing therapeutic intervention were 34%, 98% and 52%, 79%, respectively. The sensitivity and specificity of WHO/ISH and UKPDS risk charts at the same risk threshold in recognizing LDL (>100) needing therapeutic intervention were 8%, 96% and 11%, 89%, respectively. The UKPDS risk engine had better sensitivity and almost equal specificity in recognizing adverse DBP and LDL levels.
Discussion
This study evaluated CVD risk in a cohort of patients with T2DM in Sri Lanka using two different risk assessment tools, the WHO/ISH and the UKPDS risk charts. WHO/ISH risk chart has been recommended for cardiac risk assessment for Sri Lankans with T2DM, and the UKPDS risk charts are used exclusively for diabetes patients worldwide.9 A previous study has shown that the different risk scores have variable accuracy in identifying at-risk individuals in different populations.11 This could be due to higher CVD risk in some ethnic groups such as Indians.12 This is the first study comparing two commonly used cardiac assessment tools in a cohort of patients with diabetes in Sri Lanka.
This study shows that WHO/ISH risk chart classified higher proportions (78.4%) of patients into low cardiac risk category (<10%) than the UKPDS risk engine (52.3%). However, at high risk threshold of ≥30%, both methods were comparable and identified similar proportion of patients (1.9% vs 2.1%). This trend of classifying more patients into low cardiac risk by WHO/ISH is consistent with other studies where WHO/ISH risk chart categorized a higher proportion into low cardiac risk than the other assessment tools used.13–15 Furthermore, there was evidence that WHO/ISH risk chart had very poor CVD risk prediction ability when applied to a cohort of Indian patients with myocardial infarction.16 Results of our study as well as the previous studies might indicate that the WHO/ISH chart underestimates the real cardiac risk.
However, what is unusual in this study is that WHO/ISH categorized comparatively more patients (78% of sample) into low cardiac risk. The cardiac risk observed in our study was more or less similar to the risk observed for the general population. A study done by Ndindjock et al showed that 89% individuals in the general community, of which 16% were diabetic, had low cardiac risk with WHO/ISH risk prediction chart.7 CVD risk classification using WHO/ISH risk chart in Malaysia revealed that 93% of the general population, of which 13.5% had diabetes, were in low risk category.17 There could be many reasons for the observed low cardiac risk in our cohort of diabetes patients. One reason could be the poor ability of WHO/ISH risk chart to recognize high risk individuals adequately, hence labeling them as low cardiac risk. But the most likely reason could be “treatment effect” as the antihypertensive and statin therapies alter the SBP and the TC, which are two components of the WHO/ISH risk chart.
There was a significant discrepancy between the two assessment tools in predicting cardiac risk comparing the predictive performance of the WHO/ISH chart and the UKPDS risk engine report’s conflicting results.13,14,18 There is evidence that the UKPDS risk engine overestimates the cardiac risk in Caucasians with T2DM.19 However, there is insufficient evidence to show the same phenomenon in people of South Asian origin. One previous study had shown that the UKPDS risk chart recognized a higher percentage of patients of Indian origin as high risk than the other ethnic groups.16 This might indicate that the UKPDS risk chart “behaves” differently among people of South Asian origin. As the UKPDS risk engine has not been validated for South Asians, there is still a possibility that risk prediction by UKPDS risk engine observed in our study may be far from the real cardiac risk.
As the risk levels recognized by two risk assessment tools in a large cohort of patients with long-standing T2DM were quite different, the sensitivity and specificity in detecting raised LDL and DBP in a cohort of newly diagnosed patients with T2DM were then measured. We selected the newly diagnosed patients with T2DM to evade the treatment effect. The ability of WHO/ISH risk assessment tool in detecting raised LDL and DBP was poor, and over 80% of the newly diagnosed diabetes patients would miss out on therapeutic intervention of LDL control if the treatment decision is on the basis of the cardiac risk assessed by WHO/ISH risk chart. This raises an important question of the validity of WHO/ISH risk stratification in the primary care setting recommended by the Ministry of Health of Sri Lanka. Performance of UKPDS risk engine was also not different to WHO/ISH risk chart in recognizing patients with raised LDL and DBP. Thus, both risk scores have a poor ability to recognize high risk individuals with raised LDL and DBP.
A similar finding was observed in a population-based study conducted in three developing countries using the WHO/ISH risk chart and it revealed that 30% of patients with treatable blood pressure were missed with risk calculation by the WHO/ISH risk charts.17 The cost effectiveness of the total risk approach at the low resource setting to estimate cardiac risk at population level should be appreciated, but the underestimation of those with treatable risk factors at an individual level is an important issue.
The observed poor sensitivity of risk stratification to detect raised LDL and DBP particularly with the WHO/ISH risk chart in the local setting could also be due to a variation of the CVD risk factor profiles in Sri Lankans with T2DM. It is possible that Sri Lankan patients with T2DM have higher LDL and DBP with normal SBP and TC levels, thus evading classification into high risk categories by assessment tools, which do not consider LDL and DBP levels in its calculation.
Conclusion
There was a significant discrepancy between the two assessment tools in predicting cardiac risk among patients with T2DM in our study. The UKPDS risk engine classified more patients into higher cardiac risk than the WHO/ISH risk chart. Total risk calculation with WHO/ISH and UKPDS risk models demonstrated poor sensitivity as a screening tool to identify individuals with treatable levels of LDL cholesterol and DBP at all risk cutoff levels. There is a need for not only a cost effective but more sensitive risk assessment tool to screen individuals with diabetes and high CVD risk in the Sri Lankan community.
Acknowledgments
The authors would like to thank the participants of this study, all the staff of the Diabetes Center, Galle, and consultants who kindly provided consent for their patients to be used. A special word of thanks is extended to KM Kumuduni de Silva and KSM Weerarathna for laboratory assistance, and Dr SP Mohotti, Dr CM De Silva, and Dr L Fonseka for their assistance in conducting this study.
Disclosure
The authors report no conflicts of interest in this work.
References
Coccheri S. Approaches to prevention of cardiovascular complications and events in diabetes mellitus. Drugs. 2007;67(7):997–1026. | |
Barr EL, Zimmet PZ, Welborn TA, et al. Risk of cardiovascular and all-cause mortality in individuals with diabetes mellitus, impaired fasting glucose, and impaired glucose tolerance: the Australian Diabetes, Obesity, and Lifestyle Study (AusDiab). Circulation. 2007;116(2):151–157. | |
Smith SC Jr. Multiple risk factors for cardiovascular disease and diabetes mellitus. Am J Med. 2007;120(3 Suppl 1):S3–S11. | |
Shepherd J, Cobbe SM, Ford I, et al. Prevention of coronary heart disease with pravastatin in men with hypercholesterolemia. West of Scotland Coronary Prevention Study Group. N Engl J Med. 1995; 333(20):1301–1307. | |
Heart Protection Study Collaborative Group. MRC/BHF Heart Protection Study of cholesterol lowering with simvastatin in 20,536 high-risk individuals: a randomised placebo-controlled trial. Lancet. 2002;360(9326):7–22. | |
American Diabetes Association. Standards of medical care in diabetes – 2014. Diabetes Care. 2014;37 Suppl 1:S14–S80. | |
Ndindjock R, Gedeon J, Mendis S, Paccaud F, Bovet P. Potential impact of single-risk-factor versus total risk management for the prevention of cardiovascular events in Seychelles. Bull World Health Organ. 2011;89(4):286–295. | |
Bitton A, Gaziano TA. The Framingham Heart Study’s impact on global risk assessment. Prog Cardiovasc Dis. 2010;53(1):68–78. | |
Stevens RJ, Kothari V, Adler AI, Stratton IM; United Kingdom Prospective Diabetes Study (UKPDS) Group. The UKPDS risk engine: a model for the risk of coronary heart disease in Type II diabetes (UKPDS 56). Clin Sci (Lond). 2001;101(6):671–679. | |
Mendis S, Lindholm LH, Anderson SG, et al. Total cardiovascular risk approach to improve efficiency of cardiovascular prevention in resource constrain settings. J Clin Epidemiol. 2011;64(12):1451–1462. | |
Dalton AR, Bottle A, Soljak M, Majeed A, Millett C. Ethnic group differences in cardiovascular risk assessment scores: national cross-sectional study. Ethn Health. 2014;19(4):367–384. | |
Bhatnagar D, Anand IS, Durrington PN, et al. Coronary risk factors in people from the Indian subcontinent living in west London and their siblings in India. Lancet. 1995;345(8947):405–409. | |
Selvarajah S, Kaur G, Haniff J, et al. Comparison of the Framingham Risk Score, SCORE and WHO/ISH cardiovascular risk prediction models in an Asian population. Int J Cardiol. 2014;176(1):211–218. | |
Modesti PA, Agostoni P, Agyemang C, et al. Cardiovascular risk assessment in low-resource settings: a consensus document of the European Society of Hypertension Working Group on Hypertension and Cardiovascular Risk in Low Resource Settings. J Hypertens. 2014;32(5):951–960. | |
Al-Lawati JA, Barakat MN, Al-Lawati NA, et al. Cardiovascular risk assessment in diabetes mellitus: comparison of the general Framingham risk profile versus the World Health Organization/International Society of Hypertension risk prediction charts in Arabs – clinical implications. Angiology. 2013;64(5):336–342. | |
Bansal M, Kasliwal RR, Trehan N. Comparative accuracy of different risk scores in assessing cardiovascular risk in Indians: a study in patients with first myocardial infarction. Indian Heart J. 2014;66(6):580–586. | |
Otgontuya D, Oum S, Buckley BS, Bonita R. Assessment of total cardiovascular risk using WHO/ISH risk prediction charts in three low and middle income countries in Asia. BMC Public Health. 2013;13:539. | |
Fujihara K, Suzuki H, Sato A, et al. Comparison of the Framingham risk score, UK Prospective Diabetes Study (UKPDS) Risk Engine, Japanese Atherosclerosis Longitudinal Study-Existing Cohorts Combine (JALS-ECC) and maximum carotid intima-media thickness for predicting coronary artery stenosis in patients with asymptomatic type 2 diabetes. J Atheroscler Thromb. 2014;21(8):799–815. | |
Simmons RK, Coleman RL, Price HC, et al. Performance of the UK Prospective Diabetes Study Risk Engine and the Framingham Risk Equations in Estimating Cardiovascular Disease in the EPIC-Norfolk Cohort. Diabetes Care. 2009;32(4):708–713. |
 © 2015 The Author(s). This work is published and licensed by Dove Medical Press Limited. The
full terms of this license are available at https://www.dovepress.com/terms
and incorporate the Creative Commons Attribution
- Non Commercial (unported, 3.0) License.
By accessing the work you hereby accept the Terms. Non-commercial uses of the work are permitted
without any further permission from Dove Medical Press Limited, provided the work is properly
attributed. For permission for commercial use of this work, please see paragraphs 4.2 and 5 of our Terms.
© 2015 The Author(s). This work is published and licensed by Dove Medical Press Limited. The
full terms of this license are available at https://www.dovepress.com/terms
and incorporate the Creative Commons Attribution
- Non Commercial (unported, 3.0) License.
By accessing the work you hereby accept the Terms. Non-commercial uses of the work are permitted
without any further permission from Dove Medical Press Limited, provided the work is properly
attributed. For permission for commercial use of this work, please see paragraphs 4.2 and 5 of our Terms.