Back to Journals » Clinical Ophthalmology » Volume 14
Can We Corroborate Peripapillary RNFL Analysis with Macular GCIPL Analysis? Our 2-Year Experience at a Single-Centre Tertiary Healthcare Hospital Using Two OCT Machines and a Review of Literature
Authors Abrol S, Gupta S, Naik M ![]() , Agarwal S
, Agarwal S
Received 13 June 2020
Accepted for publication 10 September 2020
Published 3 November 2020 Volume 2020:14 Pages 3763—3774
DOI https://doi.org/10.2147/OPTH.S266112
Checked for plagiarism Yes
Review by Single anonymous peer review
Peer reviewer comments 2
Editor who approved publication: Dr Scott Fraser
Sangeeta Abrol,1 Sukriti Gupta,1 Mayuresh Naik,2 Siddharth Agarwal3
1Department of Ophthalmology, V.M.M.C & Safdarjung Hospital, New Delhi 110029, India; 2Department of Ophthalmology, H.I.M.S.R & H.A.H. Centenary Hospital, New Delhi 110062, India; 3Department of Research, Mayo Clinic, Rochester, MN, USA
Correspondence: Mayuresh Naik
Department of Ophthalmology, H.I.M.S.R & H.A.H. Centenary Hospital, Room No. 3 of Eye OPD, 1st Floor of OPD Building, Near GK-2, Alaknanda, New Delhi 110062, India
Tel +91-8287344576
Email [email protected]
Purpose: To determine whether macular volume and macular GCA measurements in patients are comparable to their RNFL thickness parameters.
Materials and Methods: The cross-sectional, observational study was conducted on 1380 eyes with 460 each, into three groups. Group I: patients with healthy eyes. Group II: patients diagnosed as pre-perimetric glaucoma. Group III: patients with diagnosed perimetric glaucoma. After patients were selected on the basis of inclusion and exclusion criteria, baseline standard ophthalmic examination was done by the same operator under the same settings, including SD-OCT using both the Spectralis SD-OCT and the Cirrus SD-OCT as elaborated below.
Statistical Analysis: Data were checked for normality before statistical analysis using Shapiro–Wilk test. Normally distributed continuous variables were compared using ANOVA. For all statistical tests, a p < 0.05 was taken to indicate a significant difference. Receiver operating characteristic (ROC) curves were used to define the ability RNFL and GCC parameters to distinguish perimetric and preperimetric glaucomatous eyes from control eyes.
Results: There was a statistically significant difference in the average, superior, inferior RNFL thickness and average, superior, inferior GCIPL thickness between Group I and Group II (p< 0.001), between Group I and Group III (p< 0.001) and also between Group II and Group III (p< 0.001). The statistical significance was also reflected in their AUROCs.
Conclusion: Mean, superior, inferior GCIPL thickness along with macular volume analysis can substantiate RNFL analysis for diagnosis, serial monitoring and follow-up of glaucoma patients and suspects.
Keywords: RNFL, GCC, perimetric glaucoma, pre-perimetric glaucoma
Introduction
Globally, glaucoma is one of the most common causes of vision loss, second to age-related macular degeneration and diabetic retinopathy. In India, glaucoma accounts for 12% of blindness and 11.4% of low vision.1 The nerve fibre loss in glaucoma is an irreversible process. Primary open-angle glaucoma (POAG) is also largely asymptomatic in its early stages and this is the main reason why prevention and treatment of glaucoma-associated progressive-vision-loss has been a major hurdle. Structural changes precede the onset of functional deterioration implying that optic nerve head (ONH) and retinal nerve fibre layer (RNFL) changes would be a harbinger of imminent visual field loss.2,3 Hence, the diagnosis paradigms have shifted from sequential visual field testing to sequential ONH/RNFL evaluation in an effort to pick up the earliest detectable nerve loss possible.
Approximately 30% to 50% of the retinal ganglion cells (RGC) may be lost before detectable visual field deficits occur in glaucoma.4,5 Zeimer et al6 suggested that, since ganglion-cell-inner-plexiform layer (GCIPL) and RNFL constitute 30–35% of the total macular thickness, the macular thinning in glaucoma could be attributed to reduction in GCIPL thickness. Conversely, any loss of tissue in this region could be a sign of glaucomatous damage. Thus, it was speculated that by selectively measuring the thickness of the inner retinal layers, including the GCIPL, the diagnostic efficacy of the macular thickness measurement in glaucoma may increase.7,8
The aim of this study is to determine whether macular volume and macular GCIPL thickness in patients could be compared to their peripapillary RNFL thickness parameters and thereby facilitate diagnosis of glaucoma earlier than peripapillary RNFL analysis predictions using the Spectralis SD-OCT and the Cirrus SD-OCT.
Materials and Methods
Written and informed consent was taken from all patients. This study was approved by the Institutional Ethics Committee and Institutional Review Board (IEC.IRB/VMMC/SJH/10/2017-137) of V.M.M.C & Safdarjung Hospital, New Delhi. All procedures performed in our study involving human participants were in accordance with the 1964 Helsinki declaration and its later amendments.
This cross-sectional, observational study was conducted on patients visiting Speciality Glaucoma Clinic at Tertiary health-care hospital, i.e. V.M.M.C & Safdarjung Hospital, Department of Ophthalmology from 1st Jan 2018 to 31st Dec 2019.
Assuming level of significance 5%, power 90% and effect size as 0.3 using G power 3.1 software for sample size, a sample of 1380 eyes (460 eyes per group) including 10% non-response was taken.
One thousand three hundred and eighty eyes with 460 each, into three groups.
Group I: Patients with healthy eyes.
Group II: Patients diagnosed as pre-perimetric glaucoma.
Group III: Patients with diagnosed perimetric glaucoma.
Inclusion Criteria for All Groups
Age >40 yrs and <70 yrs.
Inclusion Criteria for Group I: Patients with Healthy Eyes
- IOP < 21mmHg.
- Gonioscopically open angles.
- Absence of any signs of glaucomatous damage to ONH or RNFL on slit-lamp biomicroscopy with 90-D lens.
- Visual field testing within normal limits by Anderson’s criteria on 3 tests done 2 weeks apart.
Inclusion Criteria for Group II: Patients Diagnosed as Pre-Perimetric Glaucoma
- IOP ≥ 21 mmHg.
- Gonioscopically open angles.
- Glaucomatous changes to ONH or RNFL on slit-lamp biomicroscopy with 90-D lens.
- Visual field testing within normal limits by Anderson’s criteria on 3 tests done 2 weeks apart.
Inclusion Criteria for Group III: Patients with Diagnosed Perimetric Glaucoma
- IOP ≥ 21 mmHg.
- Gonioscopically open angles.
- Glaucomatous changes to ONH or RNFL on slit-lamp biomicroscopy with 90-D lens.
- Visual field testing reveals glaucomatous defects by Anderson’s criteria on 3 tests done 2 weeks apart corresponding to the ONH and RNFL defects by slit-lamp biomicroscopy and OCT.
Exclusion Criteria
- Chronic ocular disease.
- Systemic corticosteroid use.
- Hypertensive or diabetic retinopathy.
- Best-corrected visual acuity (BCVA) equal or worse than 6/60.
- Presence of significant cataract, presence of media opacity.
- History of ocular surgery (other than uncomplicated cataract surgery).
- Any disease with macular involvement (age-related macular degeneration, epiretinal membrane, macular edema).
- Other optic nerve diseases except for glaucoma (ischemic optic neuropathy, optic neuritis).
- Angle-closure glaucoma or angle-closure glaucoma suspect.
Procedure and Data Collection
After patients were selected on the basis of inclusion and exclusion criteria, baseline standard ophthalmic examination was done by the same operator under the same settings, including:
- Best-corrected visual acuity assessment using Snellen’s chart.
- Slit-lamp evaluation along with slit-lamp biomicroscopy with 90-D lens.
- IOP measurement using Goldmann applanation tonometry.
- Gonioscopy with Zeiss 4-mirror gonioscope.
- Central corneal thickness (CCT) measurement using cirrhus OCT.
- Visual field test using Humphrey Visual Field perimetry HVF 24–2 using SITA-Fast algorithm.
- SD-OCT using both the Spectralis SD-OCT and the Cirrus SD-OCT as elaborated below.
SD-OCT Measurement Technique for Spectralis SD-OCT
RNFL Analysis
The subjects were scanned with SPECTRALIS™ SD-OCT (Heidelberg Engineering, Germany) (Figure 1). Three 200 × 200 cube optic disc scans were obtained by centering a circle of fixed diameter on the disc. The scan that had highest signal strength and least eye movement was selected. Scans where the signal strength was below 7 were discarded. The RNFL thicknesses in superior, inferior, nasal, temporal quadrants and the average thickness of RNFL were recorded.
 |
Figure 1 Representative screen-capture for GCL analysis on the Spectralis SD-OCT. |
GCIPL Analysis
Macular scan was done using a posterior pole high-speed volume scan to obtain the macular thickness and volume. The values were recorded by dividing the macular area into nine sub-fields. Central, inner and outer sub-field had diameters of 1mm, 3mm, 6mm, respectively. The GCL + IPL thickness in superior, inferior, nasal, temporal quadrant and average value were recorded and calculated manually.
SD-OCT Measurement Technique for Cirrus SD-OCT
RNFL Analysis
Scanned using Cirrus ™ SD-OCT (Carl Zeiss Meditec, Dublin, CA) (Figure 2). Optic disc 200 × 200 scan was used to acquire a cube of side 6 mm, while the patient was fixated so that the optic disc was near the center of the scan. The Cirrus machine is operator independent and hence auto-identifies the disc each time and facilitates easy reproducibility in calculations.
 |
Figure 2 Representative screen-capture for GCIPL analysis on the Cirrus SD-OCT. |
GC Analysis
Macular cube 200 × 200 protocol was used for GCIPL. GCIPL images are obtained as an elliptical annulus (area 14.13 mm2) centered over the macula.
Statistical Analysis
Continuous variables are presented as Mean ± SD and categorical variables are presented as absolute numbers and percentage. Data were checked for normality before statistical analysis using Shapiro–Wilk test. Normally distributed continuous variables were compared using ANOVA.
If the F value was significant and variance was homogeneous, Tukey multiple comparison test was used to assess the differences between the individual groups; otherwise, Tamhane’s T2 test was used.
For all statistical tests, a p < 0.05 was taken to indicate a significant difference.
Receiver operating characteristic (ROC) curves were used to define the ability RNFL and GCC parameters to distinguish perimetric and preperimetric glaucomatous eyes from control eyes. The Z-test was used to compare the AUCs.
Results
Age and Sex Wise Distribution of Groups
All three groups were comparable with respect to their age-sex distributions and the differences were not statistically significant (Table 1).
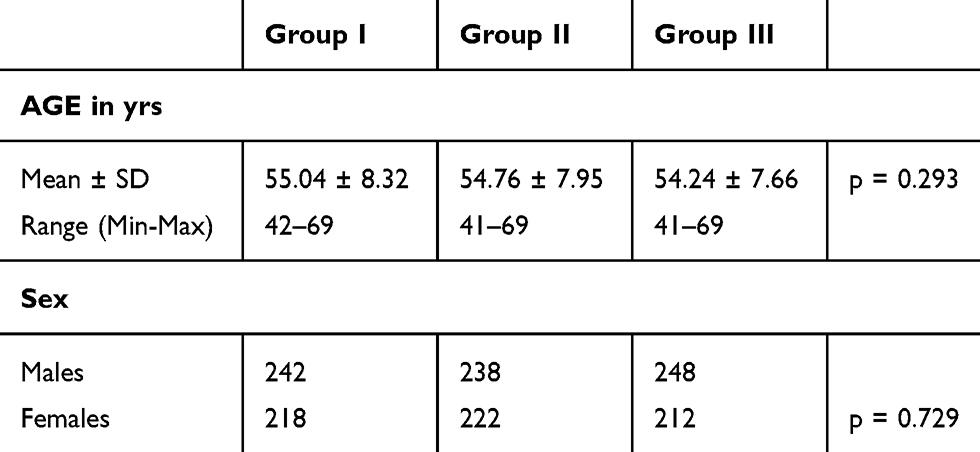 |
Table 1 Comparison of Demographic Factors Between Groups |
Comparision of RNFL Thickness Between Groups
There was a statistically significant difference in the average, superior and inferior RNFL thickness between Group I and Group II (p<0.001), between Group I and Group III (p<0.001) and also between Group II and Group III (p<0.001) by both OCT data (Table 2).
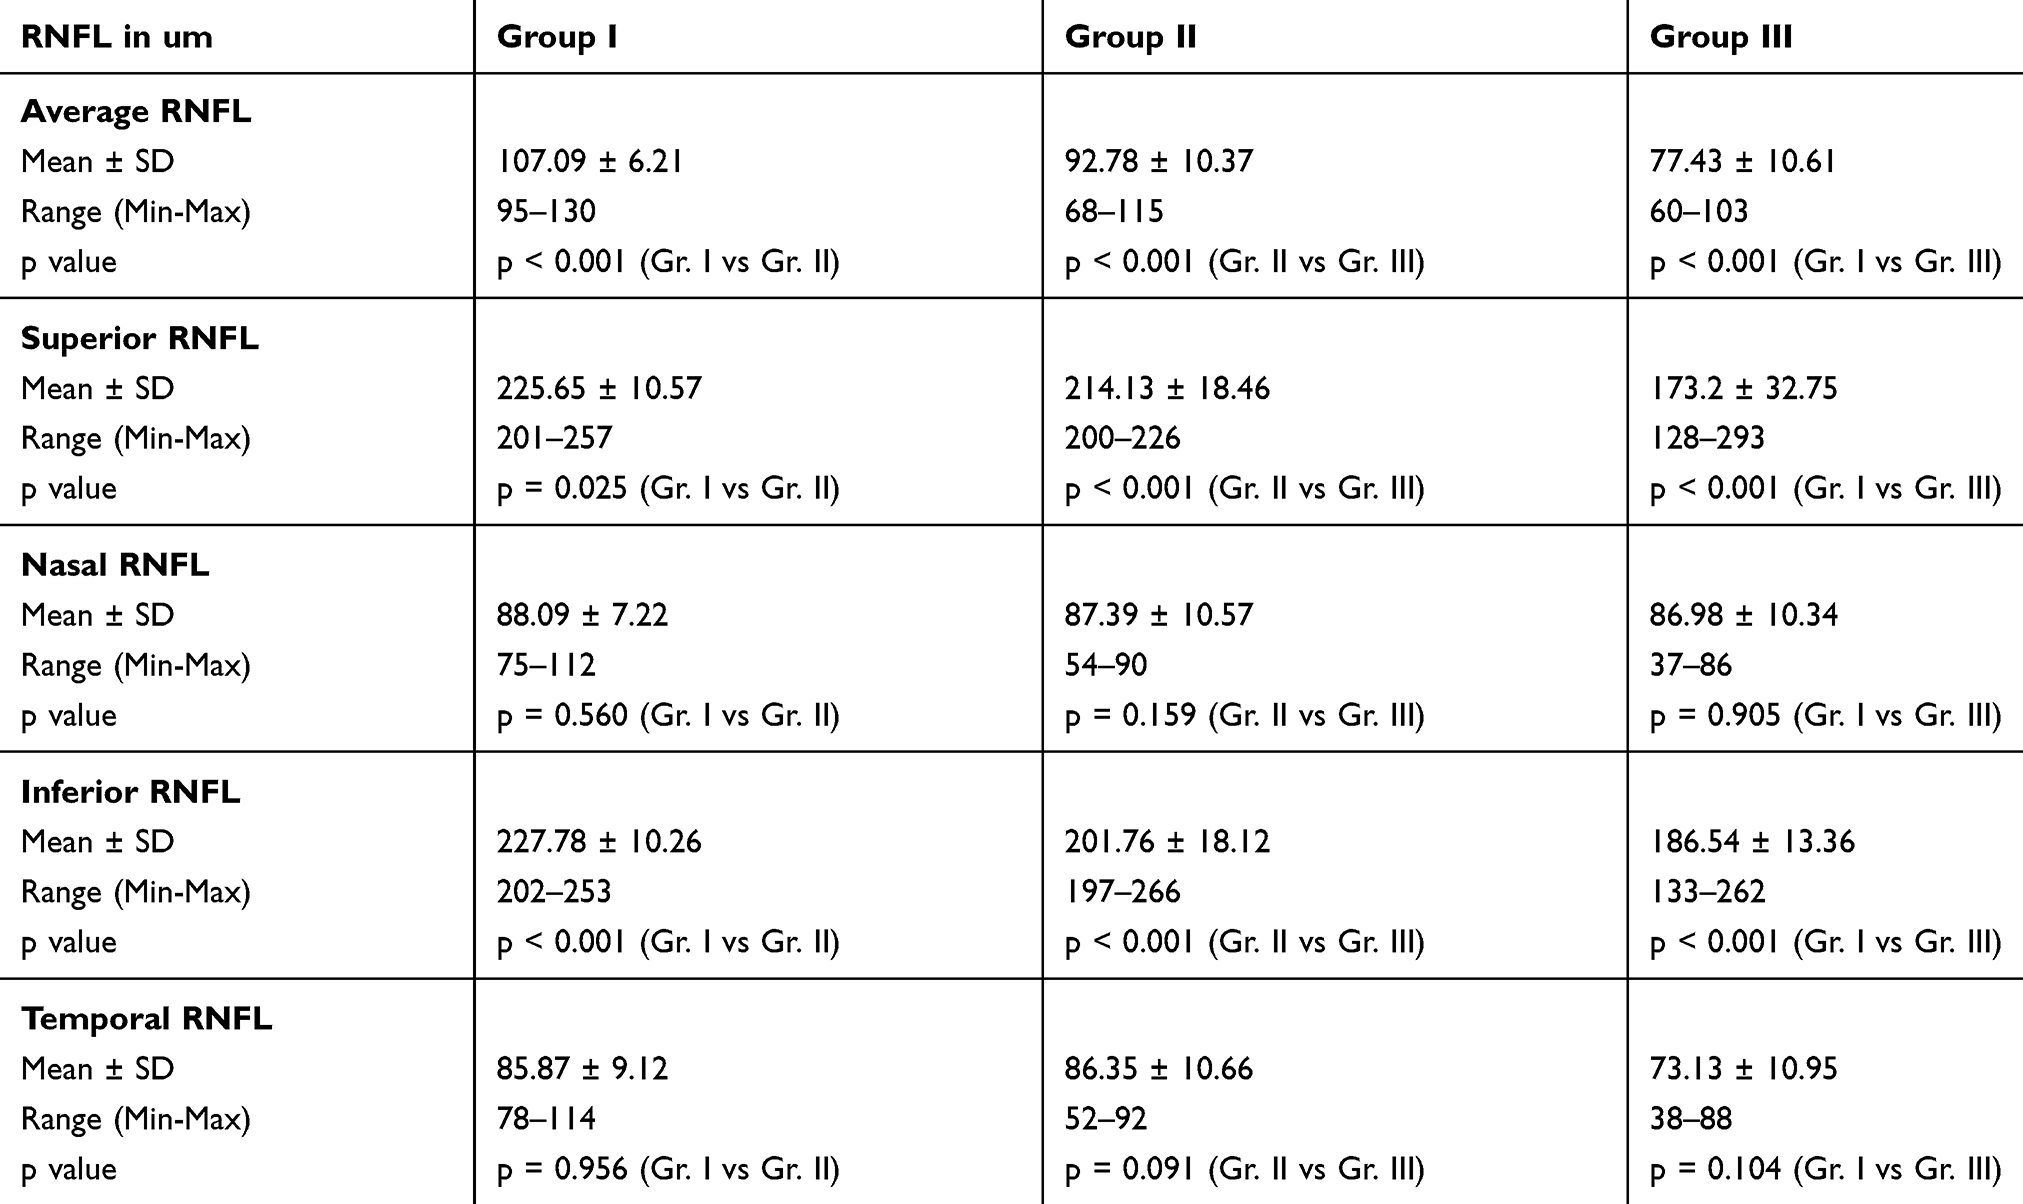 |
Table 2 Comparison of RNFL Thickness Parameters Between the Groups by Cirrus HD-OCT |
In the nasal and temporal quadrant, difference in RNFL thickness was not statistically significant between Group I and Group II (p=0.614 for nasal, p=0.527 for temporal); between Group I and Group III (p=0.189 for nasal, p=0.786 for temporal) and also between Group II and Group III (p=0.697 for nasal, p=0.193 for temporal) by both OCT data.
Comparision of GCIPL Thickness Between Groups
There was a statistically significant difference in the average, superior and inferior GCIPL thickness between Group I and Group II (p<0.001), between Group I and Group III (p<0.001) and also between Group II and Group III (p<0.001) by both OCT data (Table 3).
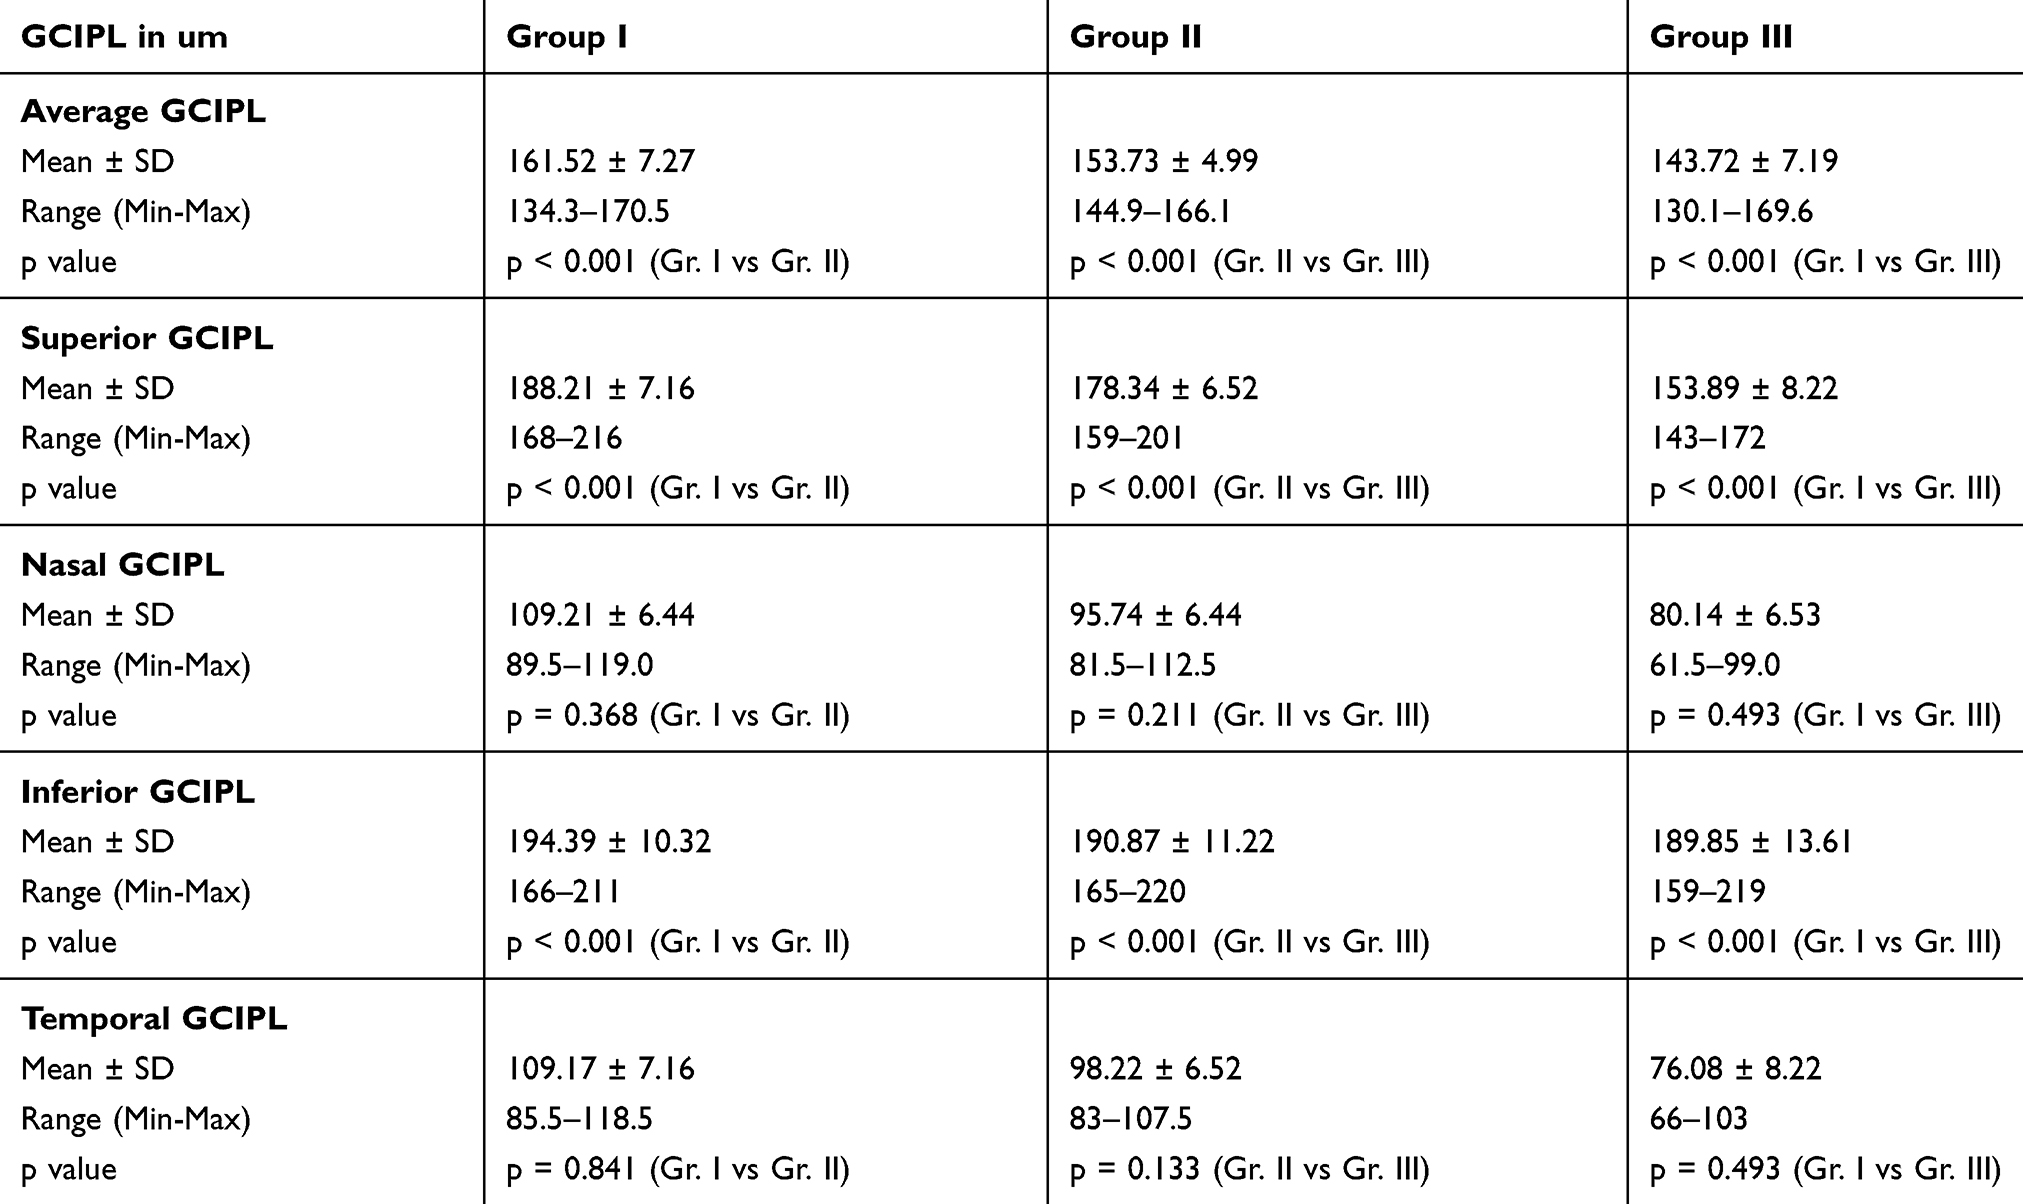 |
Table 3 Comparison of GCIPL Thickness Parameters Between the Groups by Cirrus HD-OCT |
In the nasal and temporal quadrant, difference in RNFL thickness was not statistically significant between Group I and Group II (p=0.506 for nasal, p=0.328 for temporal); between Group I and Group III (p=0.421 for nasal, p=0.076 for temporal) and also between Group II and Group III (p=0.989 for nasal, p=0.728 for temporal) by both OCT data.
Comparision of Macular Volume Between Groups
The macular volume showed a statistically significant difference in between the three groups (p<0.001) by both OCT data (Table 4).
 |
Table 4 Comparison of Macular Volume Between the Groups by Cirrus HD-OCT |
AUROC Comparisons of RNFL and GCIPL
Among the RNFL parameters, the average, superior and inferior RNFL thickness showed the best AUROCs to for all three Groups I, II, III (p < 0.001) (Figure 3A–I and Table 5).
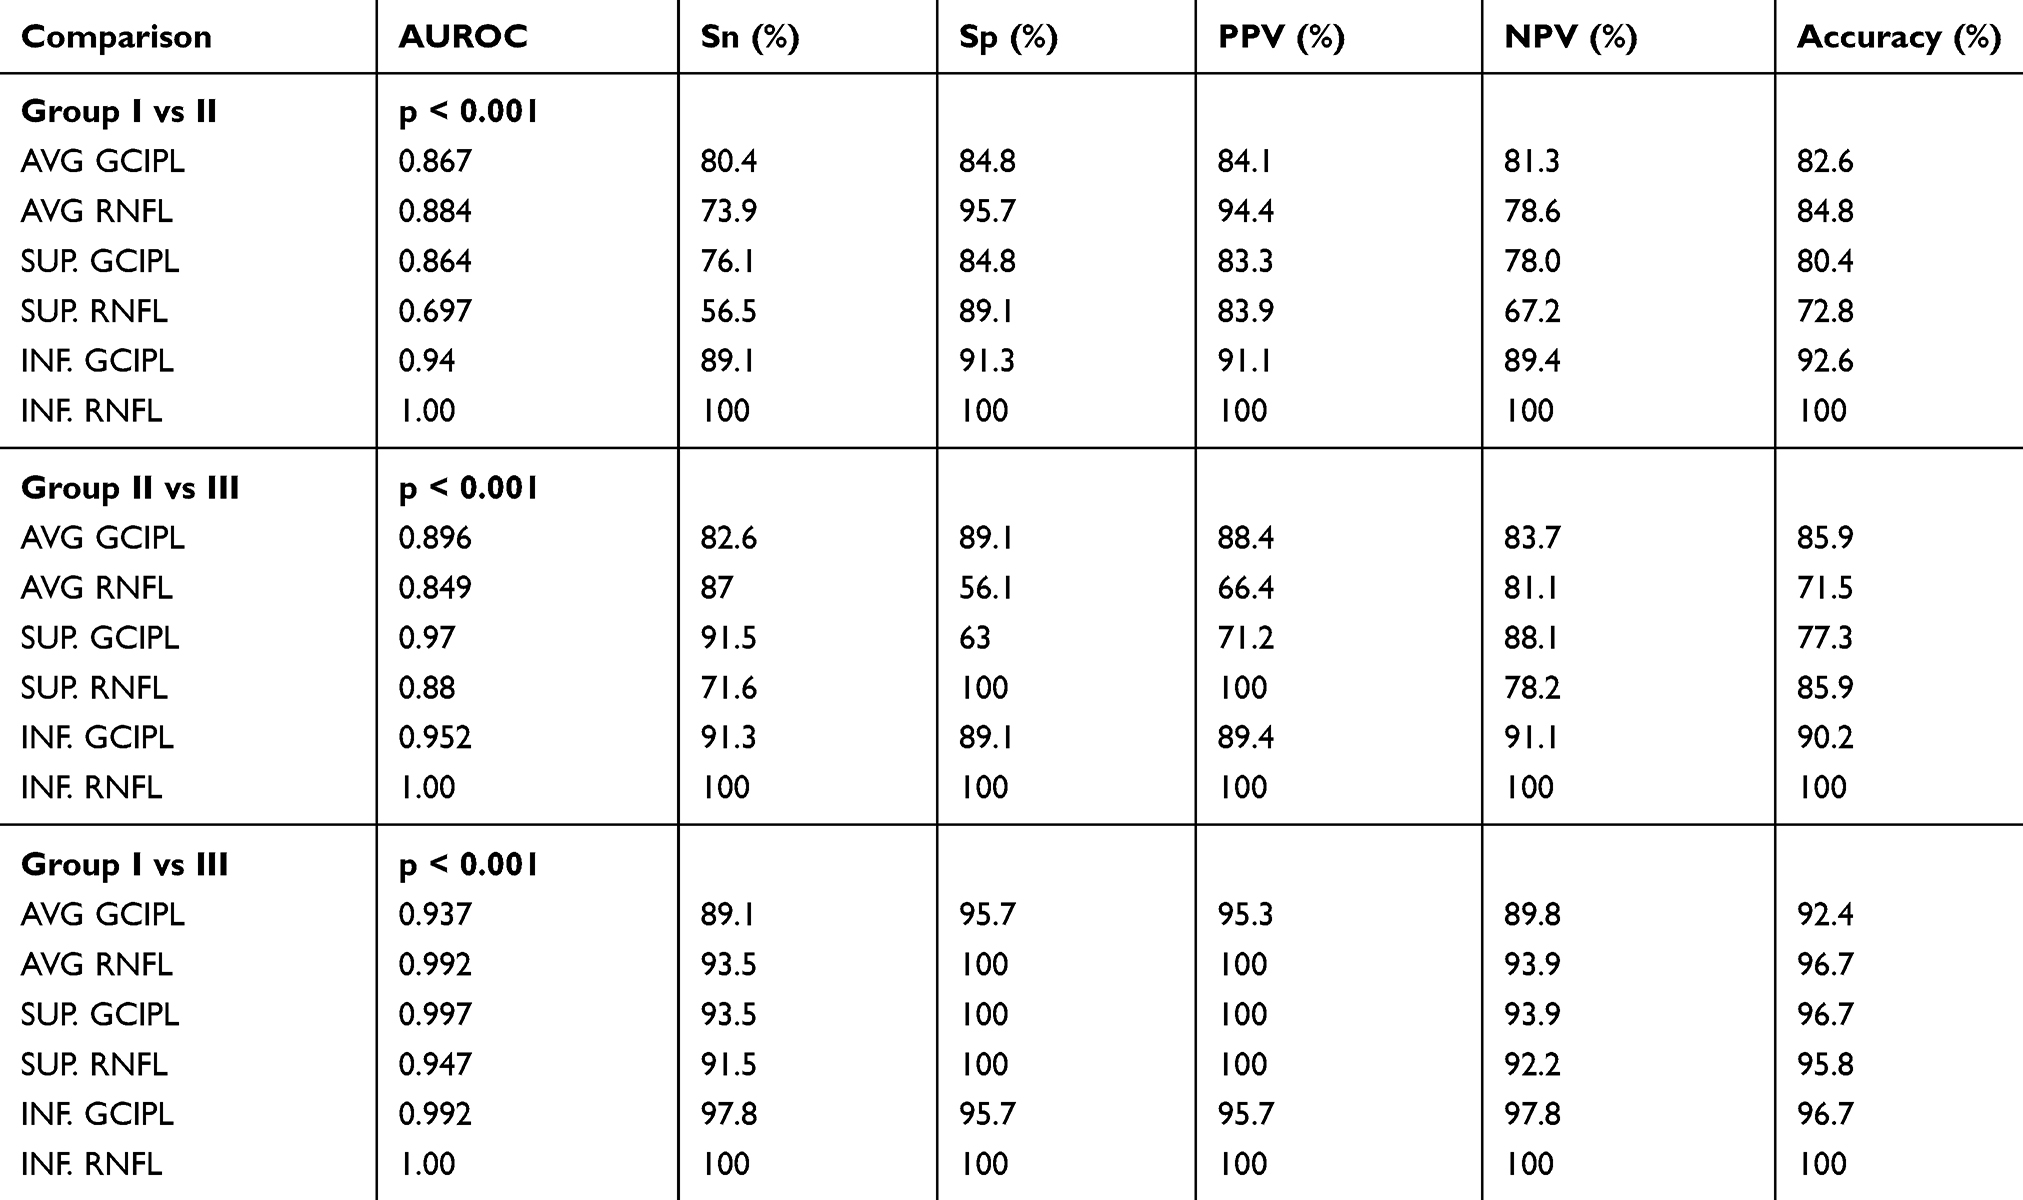 |
Table 5 Comparison of AUROCs Between the Groups |
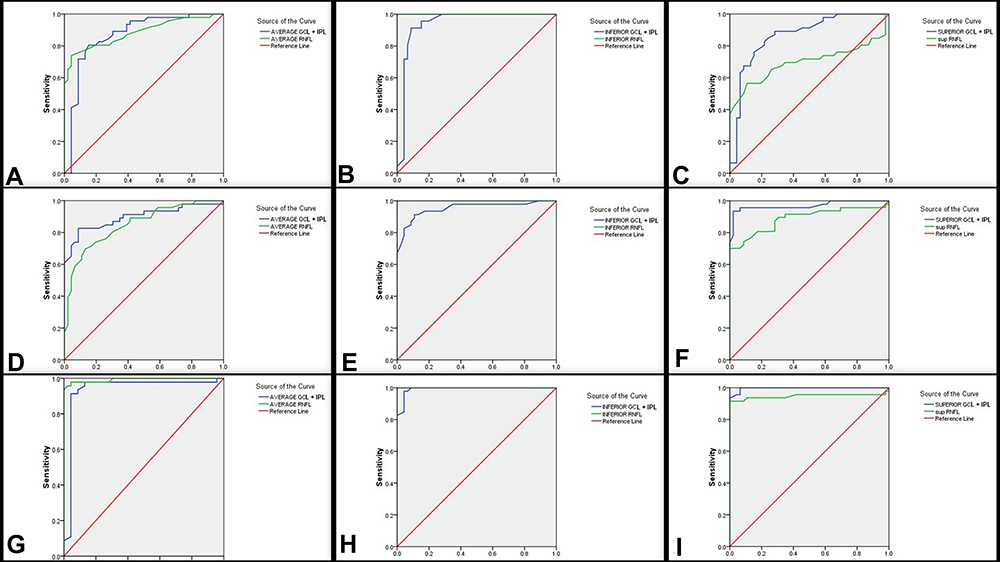 |
Figure 3 AUROCs for average, superior and inferior RNFL + GCIPL parameters between the groups. |
Among the GCIPL parameters also, the average, superior and inferior RNFL thickness showed the best AUROCs to for all three Groups I, II, III (p < 0.001).
Among these parameters also, the inferior RNFL thickness was the only parameter which had AUROCs of 1.00 and sensitivity, specificity, positive predictive value and negative predictive value of 100%. No other parameter, not even the inferior GCIPL, could achieve such high statistical significance.
Discussion
Structural changes precede the onset of functional deterioration implying that optic nerve head (ONH) and retinal nerve fibre layer (RNFL) changes would be a harbinger of imminent visual field loss.2,3 Standard automated perimetry is unable to detect defects if less than 40% of the ganglion cell axons are damaged.9,10 For this reason, glaucoma-detection-protocols have now stressed more emphasis on SD-OCT and its diagnostic accuracy in pre-perimetric glaucoma.
Retinal ganglion cells (RGCs), as the name suggests make up the ganglion cell layer (GCL) and the inner plexiform layer (IPL) of the inner retina whereas their axons that emerge constitute the retinal nerve fiber layer (RNFL). The macula is the only area in the eye in which the ganglion cell layer (GCL) is more than 1-cell-layer thick may include up to 7 layers of ganglion cell bodies.11 Therefore, macular ganglion cell layer is thicker as compared to circumpapillary area while RNFL thickness increases as the distance from the disc increases. This justifies that tests directed towards macular thickness would make more sense than directing attention towards peripapillary thickness for earliest possible detection of glaucoma.
Now, retinal ganglion cell body (i.e. GCL) is 15 μm or more in size whereas its axon (i.e. RNFL) is only 1–2 μm in diameter.12 And RNFL and GCIPL contribute about 30–35% of total retinal thickness in the macula region. Tan and colleagues13 suggested that glaucoma likely preferentially affects these layers, rather than all macular layers, because they contain the axons, cell bodies, and dendrites of ganglion cells. The ganglion cell complex (GCC) is defined as the three innermost retinal layers: the nerve fiber layer, the ganglion cell layer, and the inner plexiform layer.13 Thus, it may be more appropriate to measure thickness of these layers rather than total macular thickness to detect glaucomatous damages. Investigators have stated that GCC is at least as reliable as RNFL in the early detection of glaucoma14 and have found highly significant correlation between them.15–17
In the last decade, diagnostic algorithms have already shifted towards use of SD-OCT-based RNFL thickness measurements with the aim to improve the diagnostic yield of pre-perimetric glaucoma. However, recently research is being directed towards deciding whether GCC analysis is capable of superceding RNFL measurements as well. Chronologically, Kim et al18 in Feb 2013 and Firat et al19 in Mar 2013 studied ONH parameters, RNFL parameters and perimacular GCC parameters in patients with normal-tension glaucoma (NTG) and primary open-angle glaucoma (POAG). Average RNFL thickness was not statistically different between the groups whereas average GCC thickness differed significantly. In fact, the GCC loss in NTG was more localised. Hence they suggested that perimacular GCC parameters could be used in addition to peripapillary RNFL measurements for NTG management. Later in Dec 2013, Na et al20 carried a similar study in pre-perimetric glaucoma patients but found no statistical difference in area under receiver operating characteristic curves (AUROC) when comparing GCC, pRNFL and ONH parameters. In Jan 2014, Bhagat et al21 attempted to establish the role of GCC analysis in early diagnosis and monitoring of glaucoma using the Topcon model 2000 version 7.1 but had inconclusive evidence to elucidate whether GCC could document progression earlier than pRNFL. Even Oli et al22 in July 2015 and Fujimura et al23 in Nov 2015 conducted similar studies on Cirrus HD OCT concluded that OCT could only be used as a supplementary tool to RNFL analysis. In Dec 2015, Demir et al24 tried to elucidate a correlation between visual fields, pattern electroretinography (pERG) and FD-OCT parameters in patients with POAG and ocular hypertension (OHT). They concluded that the dysfunction due to GCC loss may be detected earlier using PERG analysis. Barua et al25 in May 2016 tried to compare ONH parameters and GCC parameters using FD-OCT and concluded that inferior GCC was the best parameter to diagnose early glaucoma. Later in Oct 2016, Cennamo et al26 compared patients with different degrees of glaucoma (pre-perimetric, mild, moderate, severe) using SD-OCT and field parameters and concluded that inferior and mean GCC thickness best discriminated between the groups. In May 2017, Kita et al27 shifted the focus of study in preperimetric glaucoma patients from macular GCC (mGCC) to circumpapillary GCC (cpGCC) using RS-3000 Advance SD-OCT (NIDEK, Aichi, Japan) as the investigating tool and AUROC as comparison variable. They concluded that mGCC was better than cpGCC with respect to diagnostic accuracy but could not comment on its comparison to pRNFL. Even though Giovannini et al28 had sparked interest in the role of macular volume in diagnosis of glaucoma in 2002, Khanal et al29 conducted a study in July 2016 and confirmed that average RNFL along with macular volume and inferior outer macular thickness were the best SD-OCT parameters for POAG and NTG. However, the latest study in this direction done by Kaushik et al30 in 2018 concluded that GCC analysis did not outperform RNFL analysis in the diagnosis of preperimetric glaucoma.
Despite extensive research done in this aspect in the past, most of these studies had certain inherent gross limitations (Table 6). Either the studies had small sample size or variable inequality between the size of study groups or did not include pre-perimetric glaucoma patients or had case definitions that confounded the results. And hence our primary intention for the study was to undertake a large sample, single-centre, tertiary-care-hospital associated study including pre-perimetric, perimetric and control patients to determine whether macular volume and macular GCIPL thickness could facilitate diagnosis of glaucoma earlier than RNFL analysis predictions using both the Spectralis and Cirrus SD-OCT machines to corroborate our results. The fact that mean, superior, inferior GCA analysis and mean, superior, inferior RNFL thickness was statistically significant in pre-perimetric and perimetric glaucoma patients proves that these measurements can substantiate each other for diagnosis, serial monitoring and follow-up of glaucoma patients and suspects. Also, unlike most studies that did not include macular volume in their results, we believe that macular volume along with macular GCA analysis increases the predictive yield of pre-perimetric glaucoma. The impact of our study lies in the simple fact that since GCIPL thickness is more than RNFL thickness, it is more sensitive to subtle changes that can be easily picked by SD-OCT. This can be likened to an example where loss of 10 pages of a 100-page notebook are much easily noticeable than loss of a single page from a 10-page notebook. The main advantage of macular GCIPL analysis over RNFL analysis lies in the fact macular GCIPL analysis can be of higher yield in those patients with peripapillary RNFL thinning like myopes, angioid streaks, serpiginous choroidopathy, post optic neuritis, etc. On the contrary, in patients with titled optic disc in high myopes, RNFL analysis may not be possible or so erroneous that we may have to depend on macular GCC analysis results only.
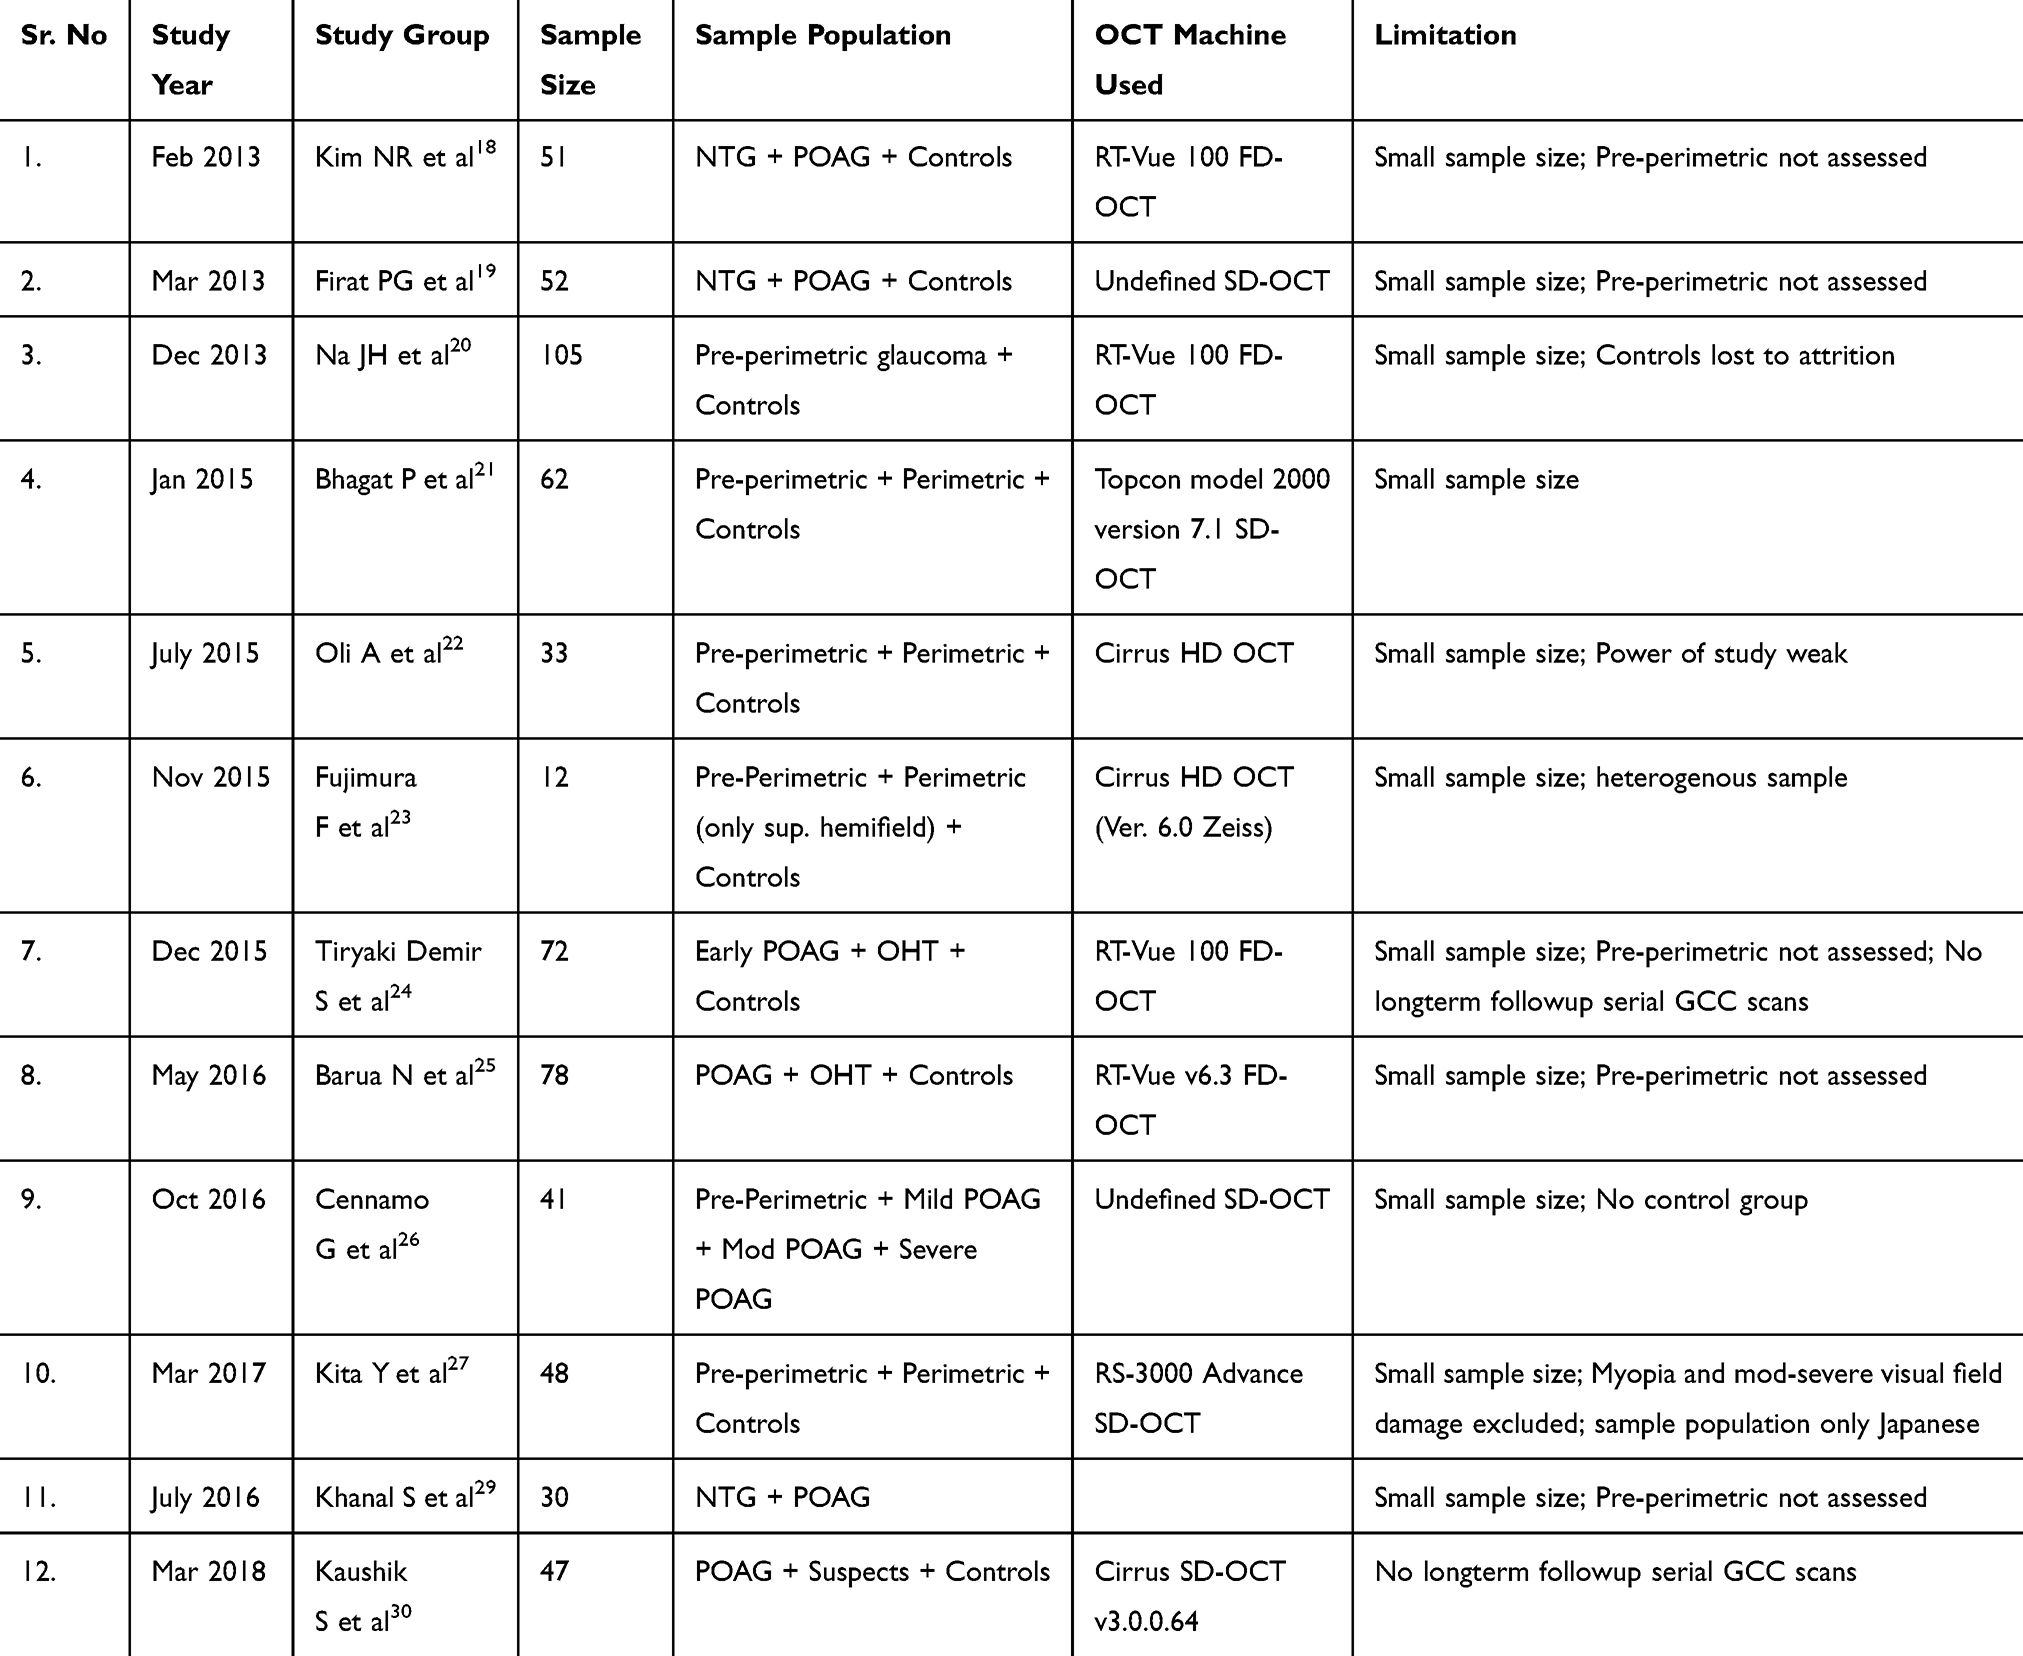 |
Table 6 Review of Literature for Studies Pertaining to Role of GCC in Pre-Perimetric and Perimetric Glaucoma |
One very important point of contention that needs to be highlighted here is the choice of machine and the resultant choice of investigative algorithm.
For peripapillary RNFL measurements, the Spectralis SD-OCT used a circular scan pattern (Spectralis software version 4.0), the scan circle being 12 degrees in diameter. Even though the exact diameter in mm is variable on the axial eye length, this circle is approximately 3.5mm in diameter for eyes with axial length 22–24mm. The Spectralis OCT software then computed the RNFL thickness of all the four quadrants and sectors. On the other hand, the Cirrus RNFL map represented a Optic Disc Cube 200 × 200 protocol (200 horizontal B-scans comprising 200 A-scan per B-scan within a cube measuring 6 × 6 × 2 mm centered at ONH center) such that a 3.4 mm diameter circle of RNFL data is extracted to create what is referred to as the TSNIT map (temporal, superior, nasal, inferior, temporal).
For macular GCA analysis, the measurement algorithms are vastly different, irreplaceable and unsubstitutable. The Spectralis SD-OCT measures macular thickness within an automatically rendered 7-mm2 area, centered 1mm temporal to the fovea to obtain perifoveal volumetric retinal scans. Segmentation of the retinal layers yields thickness measurements of each individual layer which can then be computed manually to obtain GCIPL or GCC data accordingly. On the contrary, in the Cirrus SD-OCT, the GCA algorithm processed the data recorded via the Macular Cube 512 × 128 scan protocol (128 horizontal B-scans comprising 512 A-scan per B-scan within a cube measuring 6 × 6 × 2 mm centered at the fovea) and then calculated the thickness of the macular GCIPL within a 14.13 mm2 elliptical annulus area (dimensions: a vertical inner and outer radius of 0.5 and 2.0 mm whereas a horizontal inner and outer radius of 0.6 and 2.4 mm, respectively) centered on the fovea. The size of the inner ring in the annulus was chosen to exclude the foveal area where the GCL is too thin to detect; the size and shape of the outer ring were selected because it conforms closely to the real anatomy of the normal RGC distribution in macular region. The algorithm identifies the outer boundary of the RNFL and the IPL so that the distance between the RNFL and the IPL outer boundary segmentations yields the combined thickness of the GCL and IPL (termed “GCIPL”).
Thus, it is obvious that the Spectralis SD-OCT enables us to calculate the macular RNFL, macular GCL, macular IPL thickness measurements individually which can then be used to compute the macular GCC as well as macular GCIPL data. However, the Cirrus SD-OCT is automated to compute observer-independent macular GCIPL data without yielding any information on macular RNFL measurements. Both machines have improved automated segmentation algorithms facilitating better demarcation of macular RNFL from macular GCIPL which was not only observer-independent but also faster, precise and accurate. However, there are certain inherent advantages of GCIPL data over GCC data in diagnosis and monitoring of pre-perimetric glaucoma. Firstly, the Cirrus SD-OCT uses the GCA algorithm and centres the elliptical annulus for GCIPL thickness analysis as it conforms to the normal macular retinal ganglion cell distribution as far as possible.31 In contrast, the GCC algorithm of the Spectralis OCT centres 1mm temporal to the fovea to improve the yield of temporal nerve fibres. Secondly, the GCA algorithm of the Cirrus SD-OCT computed the GCIPL thickness by 1° interval of the 360 spokes of the elliptical annulus using data set from 50 to 60 sampling points. The lowest GCIPL thickness among the 360 spokes (termed minimum GCIPL) could indicate the location where local RGC loss was most severe. Also, the GCA algorithm in the Cirrus SD-OCT focuses on a 14.13mm2 area whereas the GCC algorithm of the Spectralis SD-OCT explores a 6mm diameter circle of 28.27mm2 area.32,33 Hence, averaging thickness over a larger area may tend to underestimate focal localized retinal ganglion cell loss and lead to false-negative results on serial GCC scans, given that the RGCs are spatially and sequentially unevenly affected by glaucoma. However, despite all these factors, there was no statistically significant difference between the GCIPL measurements in our study.
There is but one inherent limitation to our study. This was a one-point cross-sectional study and long-term follow-up with serial GCA scans would be needed to quantify the results of progressive GCA analysis. We did indeed follow-up our patients for a period of 2 years but the results are beyond the scope of this report. The reason for this helpless inadequacy on our part is the fact that RNFL progression has been statistically quantified at 20um but the same does not hold true for GCC thickness. We are currently in the process of analyzing our morphometric data of macular volume and GCC thickness in order to establish normative Gaussian curves for the same. In fact, this is also one of the main reasons why we chose to proceed with our study using two SD-OCTs in order to double cross-check our data retrospectively.
Conclusion
Mean, superior, inferior GCC thickness analysis and mean, superior, inferior RNFL thickness were statistically significantly reduced in pre-perimetric and perimetric glaucoma patients as compared to healthy controls.
Mean, superior, inferior GCC thickness along with macular volume analysis can substantiate RNFL analysis for diagnosis, serial monitoring and follow-up of glaucoma patients and suspects.
Ethical Clearance
Obtained from Ethical Clearance Committee, Institution Review Board. IEC.IRB/VMMC/SJH/10/2017-137
Ethical Standards
All procedures performed in studies involving human participants were in accordance with the ethical standards of the institutional and/or national research committee and with the 1964 Helsinki declaration and its later amendments or comparable ethical standards.
Informed Consent
Informed consent was obtained from all individual participants included in the study.
Author Contributions
All the authors were involved in the concept and design of the study, data acquisition, data analysis and interpretation, drafting manuscript, technical support and final review of the manuscript.
Funding
There is no funding to report.
Disclosure
The authors report no conflicts of interest for this work.
References
1. Ramakrishnan R, Nirmalan PK, Krishnadas R, et al. Glaucoma in a rural population of Southern India: the Aravind comprehensive eye survey. Ophthalmology. 2003;110:1484–1490. doi:10.1016/S0161-6420(03)00564-5
2. Cvenkel B, Kontestabile AS. Correlation between nerve fibre layer thickness measured with spectral domain OCT and visual field in patients with different stages of glaucoma. Graefes Arch Clin Exp Ophthalmol. 2011;249:575–584.
3. Wollstein G, Schuman JS, Price LL, et al. Optical coherence tomography longitudinal evaluation of retinal nerve fiber layer thickness in glaucoma. Arch Ophthalmol. 2005;123:464–470. doi:10.1001/archopht.123.4.464
4. Quigley HA, Addicks EM, Green WR. Optic nerve damage in human glaucoma. III. Quantitative correlation of nerve fiber loss and visual field defect in glaucoma, ischemic neuropathy, papilledema, and toxic neuropathy. Arch Ophthalmol. 1982;100:135–146. doi:10.1001/archopht.1982.01030030137016
5. Mikelberg FS, Yidegiligne HM, Schulzer M. Optic nerve axon count and axon diameter in patients with ocular hypertension and normal visual fields. Ophthalmology. 1995;102:342–348. doi:10.1016/S0161-6420(95)31019-6
6. Zeimer R, Asrani S, Zou S, et al. Quantitative detection of glaucomatous damage at the posterior pole by retinal thickness mapping: a pilot study. Ophthalmology. 1998;105:224–231. doi:10.1016/S0161-6420(98)92743-9
7. Ishikawa H, Stein DM, Wollstein G, Beaton S, Fujimoto JG, Schuman JS. Macular segmentation with optical coherence tomography. Invest Ophthalmol Vis Sci. 2005;46:2012–2017. doi:10.1167/iovs.04-0335
8. Tan O, Li G, Lu AT, Varma R, Huang D. Mapping of macular substructures with optical coherence tomography for glaucoma diagnosis. Ophthalmology. 2008;115:949–956. doi:10.1016/j.ophtha.2007.08.011
9. Quigley HA, Dunkelberger GR, Green WR. Retinal ganglion cell atrophy correlated with automated perimetry in human eyes with glaucoma. Am J Ophthalmol. 1989;107:453–464. doi:10.1016/0002-9394(89)90488-1
10. Harwerth RS, Carter-Dawson L, Shen F, Smith EL
11. Curcio CA, Allen KA. Topography of ganglion cells in human retina. J Comp Neurol. 1990;300:5–25.
12. Zeimer R, Shahidi M, Mori M, Asrani S. A new method for rapid mapping of the retinal thickness at the posterior pole. Invest Ophthalmol Vis Sci. 1996;37:1994–2001.
13. Tan O, Chopra V, Lu AT, et al. Detection of macular ganglion cell loss in glaucoma by fourier-domain optical coherence tomography. Ophthalmology. 2009;116:2305–2314. doi:10.1016/j.ophtha.2009.05.025
14. Rao HL, Babu JG, Addepalli UK, Senthil S, Garudadri CS. Retinal nerve fiber layer and macular inner retina measurements by spectral domain optical coherence tomograph in Indian eyes with early glaucoma. Eye (Lond). 2012;26:133–139.
15. Kita Y, Kita R, Nitta A, Nishimura C, Tomita G. Glaucomatous eye macular ganglion cell complex thickness and its relation to temporal circumpapillary retinal nerve fiber layer thickness. Jpn J Ophthalmol. 2011;55:228–234. doi:10.1007/s10384-011-0017-3
16. Cho JW, Sung KR, Lee S, et al. Relationship between visual field sensitivity and macular ganglion cell complex thickness as measured by spectral-domain optical coherence tomography. Invest Ophthalmol Vis Sci. 2010;51:6401–6407. doi:10.1167/iovs.09-5035
17. Kim YJ, Kang MH, Cho HY, Lim HW, Seong M. Comparative study of macular ganglion cell complex thickness measured by spectral-domain optical coherence tomography in healthy eyes, eyes with preperimetric glaucoma, and eyes with early glaucoma. Jpn J Ophthalmol. 2014;58:244–251.
18. Kim N, Hong S, Kim J, Rho S, Seong G, Kim C. Comparison of macular ganglion cell complex thickness by fourier-domain OCT in normal tension glaucoma and primary open-angle glaucoma. J Glaucoma. 2013;22:133–139.
19. Firat PG, Doganay S, Demirel EE, Colak C. Comparison of ganglion cell and retinal nerve fiber layer thickness in primary open-angle glaucoma and normal tension glaucoma with spectral-domain OCT. Graefes Arch Clin Exp Ophthalmol. 2013;251(3):831–838.
20. Na J, Lee K, Lee J, Baek S, Yoo S, Kook M. Detection of macular ganglion cell loss in preperimetric glaucoma patients with localized retinal nerve fibre defects by spectral-domain optical coherence tomography. Clin Exp Ophthalmol. 2013;41:870–880. doi:10.1111/ceo.12142
21. Bhagat P, Deshpande K, Natu B. Utility of ganglion cell complex analysis in early diagnosis and monitoring of glaucoma using a different spectral domain optical coherence tomography. J Curr Glaucoma Pract. 2014;8:101–106. doi:10.5005/jp-journals-10008-1171
22. Oli A, Joshi D. Can ganglion cell complex assessment on cirrus HD OCT aid in detection of early glaucoma? Saudi J Ophthalmol. 2015;29:201–204.
23. Fujimura F, Shoji N, Hirasawa K, Matsumura K, Morita T, Shimizu K. Comparison of the normal, preperimetric glaucoma, and glaucomatous eyes with upper-hemifield defects using SD-OCT. Open J Ophthalmol. 2015;05:167–173. doi:10.4236/ojoph.2015.54027
24. Tiryaki Demir S, Oba M, Tuna Erdoğan E, et al. Comparison of pattern electroretinography and optical coherence tomography parameters in patients with primary open-angle glaucoma and ocular hypertension. Turk J Ophthalmol. 2015;45:229–234. doi:10.4274/tjo.39260
25. Barua N, Sitaraman C, Goel S, Chakraborti C, Mukherjee S, Parashar H. Comparison of diagnostic capability of macular ganglion cell complex and retinal nerve fiber layer among primary open angle glaucoma, ocular hypertension, and normal population using Fourier-domain optical coherence tomography and determining their functional correlation in Indian population. Indian J Ophthalmol. 2016;64:296.
26. Cennamo G, Montorio D, Romano M, et al. Structure-functional parameters in differentiating between patients with different degrees of glaucoma. J Glaucoma. 2016;25:e884–e888. doi:10.1097/IJG.0000000000000491
27. Kita Y, Soutome N, Horie D, Kita R, Hollό G. Circumpapillary ganglion cell complex thickness to diagnose glaucoma: A pilot study. Indian J Ophthalmol. 2017;65:41. doi:10.4103/ijo.IJO_437_16
28. Giovannini A, Amato G, Mariotti C. The macular thickness and volume in glaucoma: an analysis in normal and glaucomatous eyes using OCT. Acta Ophthalmol Scand. 2002;80:34–36. doi:10.1034/j.1600-0420.80.s236.44.x
29. Khanal S, Davey P, Racette L, Thapa M. Comparison of retinal nerve fiber layer and macular thickness for discriminating primary open-angle glaucoma and normal-tension glaucoma using optical coherence tomography. Clin Exp Optom. 2016;99:373–381. doi:10.1111/cxo.12366
30. Kaushik S, Kataria P, Jain V, Joshi G, Raj S, Pandav SS. Evaluation of macular ganglion cell analysis compared to retinal nerve fiber layer thickness for preperimetric glaucoma diagnosis. Indian J Ophthalmol. 2018;66:511–516. doi:10.4103/ijo.IJO_1039_17
31. Takayama K, Hangai M, Durbin M, et al. A novel method to detect local ganglion cell loss in early glaucoma using spectral-domain optical coherence tomography. Invest Ophthalmol Vis Sci. 2012;53:6904–6913. doi:10.1167/iovs.12-10210
32. Akashi A, Kanamori A, Nakamura M, et al. Comparative assessment for the ability of Cirrus, RTVue, and 3D-OCT to diagnose glaucoma. Invest Ophthalmol Vis Sci. 2013;54:4478–4484. doi:10.1167/iovs.12-11268
33. Xu X, Xiao H, Guo X, et al. Diagnostic ability of macular ganglion cell-inner plexiform layer thickness in glaucoma suspects. Medicine (Baltimore). 2017;96(51):e9182. doi:10.1097/MD.0000000000009182
 © 2020 The Author(s). This work is published and licensed by Dove Medical Press Limited. The
full terms of this license are available at https://www.dovepress.com/terms
and incorporate the Creative Commons Attribution
- Non Commercial (unported, 3.0) License.
By accessing the work you hereby accept the Terms. Non-commercial uses of the work are permitted
without any further permission from Dove Medical Press Limited, provided the work is properly
attributed. For permission for commercial use of this work, please see paragraphs 4.2 and 5 of our Terms.
© 2020 The Author(s). This work is published and licensed by Dove Medical Press Limited. The
full terms of this license are available at https://www.dovepress.com/terms
and incorporate the Creative Commons Attribution
- Non Commercial (unported, 3.0) License.
By accessing the work you hereby accept the Terms. Non-commercial uses of the work are permitted
without any further permission from Dove Medical Press Limited, provided the work is properly
attributed. For permission for commercial use of this work, please see paragraphs 4.2 and 5 of our Terms.