Back to Journals » Clinical, Cosmetic and Investigational Dermatology » Volume 13
Can Sodium Thiosulfate Act as a Reversal Agent for Calcium Hydroxylapatite Filler? Results of a Preclinical Study
Authors Danysz W, Nowag B, Hengl T, Kreymerman P, Furne C, Madeuf E, Höennscheidt C ![]() , Mraz Robinson D
, Mraz Robinson D
Received 24 July 2020
Accepted for publication 24 November 2020
Published 31 December 2020 Volume 2020:13 Pages 1059—1073
DOI https://doi.org/10.2147/CCID.S271760
Checked for plagiarism Yes
Review by Single anonymous peer review
Peer reviewer comments 3
Editor who approved publication: Dr Jeffrey Weinberg
Wojciech Danysz,1 Bartosch Nowag,1 Thomas Hengl,1 Peter Kreymerman,2 Céline Furne,3 Elise Madeuf,4 Christoph Höennscheidt,1 Deanne Mraz Robinson5,6
1R&D, Merz Pharmaceuticals GmbH, Frankfurt am Main, Germany; 2Medical Affairs, Merz North America, Raleigh, NC, USA; 3NAMSA, Chasse sur Rhône, France; 4Preclinical Studies, Voxcan, Marcy L´Etoile, France; 5Modern Dermatology of Connecticut, Westport, CT, USA; 6Yale-New Haven Hospital, New Haven, CT, USA
Correspondence: Wojciech Danysz
Merz Pharmaceuticals GmbH, Eckenheimer Landstrasse 100, Frankfurt am Main 60318, Germany
Email [email protected]
Introduction: Calcium hydroxylapatite microspheres suspended in a gel carrier of sodium carboxymethylcellulose (CaHA; Radiesse®) has demonstrated safe and effective restoration of facial volume in clinical trials, as well as collagen biostimulation leading to skin quality improvement. The potential with CaHA, as with any filler, to produce overcorrection and subsequent complications has led to the search for a reversal agent. Sodium thiosulfate (STS) was proposed based on experience with it as a chelating agent to treat calciphylaxis. Previous pilot studies with small sample sizes have suggested its efficacy in the reduction of CaHA volume and nodule formation. The present study focuses on the verification of this effect using various readout methods in preclinical experiments.
Methods: We use both in vitro (co-incubation of STS with CaHA) and in vivo (injections in farm pig) methods with readout techniques such as 3D camera analysis, micro-computed tomography ex vivo (μCT), computed tomography in vivo (CT), histopathology and scanning electron microscopy.
Results: We did not obtain any indications of CaHA degradation by STS, either in vitro or in vivo. 3D-camera analysis also did not show any decreasing effect of STS on CaHA. However, histology, μCT ex vivo, and CT in vivo indicated a decrease of Radiesse amount/volume after STS treatment, which could be attributed to dispersion effect. It should be noted that necrosis and haemorrhages were observed after STS treatment.
Discussion: Results suggest no indication of CaHA microspheres degradation with STS and that the STS mechanism of action on CaHA is consistent with a dispersion effect. Observed necrosis is a further obstacle in the use of STS.
Keywords: calcium hydroxylapatite, sodium thiosulfate, dispersion effect, computed tomography, histology, 3D camera
Introduction
Injectable fillers continue to gain popularity and are used in a number of indications.1 The type of products on the market are generally stratified into hyaluronic acid (HA) fillers and non-HA fillers, with an increasing number of both types.2 Calcium hydroxylapatite (CaHA; Radiesse®, Merz North America, Inc., Raleigh, NC) injectable filler remains an effective and popular non-HA filler since its introduction a decade ago. Its high viscosity (η*) and elasticity (G’) and collagen-stimulating properties make CaHA a desirable filler for both volumizing and biostimulation.3–8
For personnel performing aesthetic filler injections, it is important to have clear guidance on the prevention and treatment of potential complications.9,10 For HA fillers, hyaluronidase is utilized as a reversal agent.11 In addition, there is interest in identifying a compound that can dissolve CaHA to address over-correction or nodule formation and reversal of vascular occlusions.9,10,12,13
Sodium thiosulfate (STS) was considered as a CaHA reversal agent candidate due to its action as a chelating agent shown to successfully treat calciphylaxis.14,15 Preliminary preclinical in vitro and in vivo studies suggest STS may produce degradation of CaHA particles.12,16 A larger, subsequent in vivo animal study verified the potential reduction of CaHA by STS but failed to demonstrate causality and clarify the underlying mechanism.13 Two case studies involving patients with nodules also provided support for the efficacy of STS as an agent for CaHA volume reduction.16,17 The mechanism of action could not be determined, and a mechanical component was also considered, as the massage was used in all human studies. An older preclinical study in rats suggested that water or physiological saline in combination with massage can be beneficial in the dispersion of previously injected CaHA.18 The aim of the present study is to verify the effects of STS on CaHA, its mechanism of action, and safety profile, both in vivo and in vitro using multiple readout techniques such as 3D camera analysis, micro-computed tomography (µCT), computed tomography (CT), histopathology, and scanning electron microscopy.
Materials and Methods
In vitro
Chemical Reagents
Chemical reagents used in this study were: PBS (phosphate-buffered saline), 25% STS and 0.1M EDTA (ethylenediamine tetraacetic acid) and CaHA. Pure CaHA microspheres were used to analyze the effects of the chemical reagents on the CaHA microspheres.
Procedure
Three different model systems were used to evaluate the effect of STS on CaHA microspheres: in vitro assessment in glass tubes (STS vs EDTA control), a human skin equivalent model (Phenion®; keratinocytes growing on a 3D extracellular matrix produced by fibroblasts), and human ex vivo skin.
In the glass tube model, 50 mg CaHA microspheres were added, along with 450 µL of either aqua dest. (distilled water), PBS, 25% STS or 0.1 M EDTA solution, then mixed using vortex for 30 seconds. The glass tubes were placed on a roller mixer for 3 or 7 days, washed three times, and placed into the reflection electron microscope (REM) for analysis.
In the human skin equivalent model, 50 µL CaHA was injected with a syringe (26G needle). The same injection channel was used to inject 50 µL of either aqua dest., PBS, 25% STS or 0.1 M EDTA solution. The injection channel was closed with a tissue adhesive to avoid leakage. After 3 days under standard culture conditions (37°C and 5% CO2, with the Phenion cell culture medium), Phenion models were prepared and CaHA microspheres were harvested. CaHA microspheres were washed three times and placed into the REM.
In the ex vivo human skin (NativeSkin®), 50 µL CaHA was injected and the same procedure was used as for the Phenion system setup, except the medium was changed to NativeSkin.
Scoring
To evaluate the effects of the chemical reagents on the CaHA microspheres, the surface structure was analyzed with REM. The different surface irregularities were clustered into a 4-step scoring system: 0 = no changes of the microsphere surface structure, 1 = slight changes of the microsphere surface structure, 2 = intermediate changes of the microsphere surface structure, and 3 = extensive changes of the microsphere surface structure.
In vivo
Animals
The standard procedures for animal use and handling were followed according to The Ministry of Higher Education, Research and Innovation Committee, which approved the study (APAFIS#9834-201,705,051,731,149 v2). Three female farm pigs (Sus scrofa domesticus, Landrace-Large White cross) were used at weights of 56–61 kg. Animals were housed in groups at arrival and during the entire study under standard laboratory conditions.
Test Items
The following chemicals were used as treatments: calcium hydroxylapatite (CaHA, Radiesse® 1.5 cc without lidocaine) from Merz Pharmaceuticals, Frankfurt am Main, Germany; sodium thiosulfate pentahydrate (STS, 25%) from Dr. Franz Köhler Chemie GmbH, Bensheim, Germany; and sodium chloride 0.9% solution for injection (Saline, Batch: 1,707,506).
Treatment
CaHA (500 µL) was injected in the superficial part of the subcutaneous compartment (SC) in the abdominal skin of three female pigs. One hour later, 1500 µL of STS or saline was injected directly into the CaHA bump (N=10 sites per group). Ten sites were left intact. Afterwards, the animals were moved to a recovery area and monitored for recovery from the anesthetic until sternal recumbency was achieved. After recovery, each animal was returned to its cage and observed for general health. Seven days following injection, animals were euthanized by a slow intravenous injection of embutramide-mebezonium-tetracaine (T61®, MSD). The sites were cut out for further histopathologic analysis, histomorphometry, micro-CT and electron microscopy.
For the CT analysis, 10 SC injections of CaHA were performed in the abdomen of a male pig (five bumps on each flank of the abdomen). For each bump, a theoretical volume of 0.5 mL CaHA was administered followed one hour later by injections of 1.5 mL of STS inside five bumps of dermal filler. The other five bumps were not treated. To calculate the exact volume administered for each SC bump (CaHA and STS), the syringes (having 100 µL scale) were weighed before and after each SC injection.
Measurements
3D Camera Imaging
3D camera imaging was performed under anesthesia on each site at baseline, and 15 min, 90 min, 24 hours, 3 days, 5 days, and 7 days post-injection. The pictures were taken using 3D Life Viz Mini Quantificare coupled to a Nikon D3200 camera and converted into 3D using LifeViZApp software. Next, the volume of each site (in triplicates) was determined using DermaPix software. For statistical analysis, a mean value of three repetitions for each photo of each site was taken.
Micro-Computed Tomography (µCT)
After complete fixation in 10% neutral buffered formalin (NBF), the 30 sites were scanned by cone beam micro-computed tomography (µCT 40, SCANCO, Switzerland). One additional site (T0 site) was also scanned (energy/intensity: 70Kvp, 114 µA, 8W; integration time: 300 ms; frame averaging: 2; nominal resolution high: 18 µm). The images were then segmented to separate the implant from the tissue background. The global volume of material was measured as well as density (in Hounsfield units [HU]).
Computed Tomography (CT)
X-ray computed tomography acquisitions were performed with the Computed Tomography Scanner BrightSpeed 16 from General Electric. In vivo CT scans were performed at 30 min, 1 h 15, 1 h 30, 1 h 45, 2 h, 3 h, 4 h, 8 h, 24 h, and 7 days post-injection. For each CT scan, the animal was positioned in dorsal recumbency (ventral images) and acquisitions were centered on the injection sites. The parameters of the CT-scan were as follows: image number −1 acquisition (dorsal recumbency); image format – Dicom (.dcm); field of view (FOV) – 36 cm; axial resolution – 703 µm; slice thickness – 625 µm (310 µm after reconstruction); rotation – 0.8 s; pitch – 0.938; tension – 120 kV; amperage – 150 mA; algorithms for reconstruction – STANDARD & BONE.
The reference mass of the injected products (expressed in grams) was calculated for each bump as follows: Reference mass (g) = Syringe weight before injection (g) – Syringe weight after injection (g).
To convert the mass (g) in injected volume (μL), the following formula was applied (with CaHA density 1.65g/cm3 and STS 1.12 g/cm3):

CT acquisitions were analyzed with the software Avizo version 9.2.0 focusing on the volume, mean density, and the 3D shape.
An image segmentation was performed on each CT acquisition on the standard reconstruction (Figure 1). At first, a manual pre-segmentation was performed around each bump in order to roughly isolate the voxels corresponding to the dermal filler product. An interpolation procedure was performed to obtain a contour for each slice and define a Region of Interest (ROI). Next, an automatic segmentation was applied to the ROI previously defined using a global grey-level thresholding procedure. The relevant threshold allowing isolation of the dermal filler products was defined on the basis of the Hounsfield Unit (HU) histogram, following the Otsu method to accurately define the ROI: for CaHA dermal filler, which is intrinsically radio-opaque, all voxels with HU equal to or greater than +250HU were selected in an ROI and corresponded to pure (not dispersed) CaHA (Figure 1A).
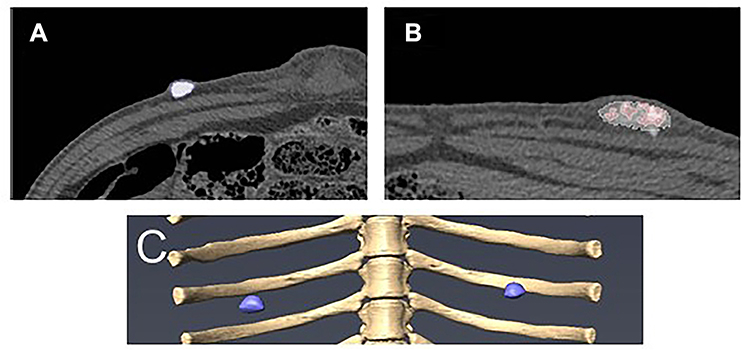 |
Figure 1 (A) Automatic segmentation with thresholding procedure to select the voxels with a grey level above 250 HU (in blue) corresponding to undiluted CaHA. (B) Automatic segmentation with thresholding procedure to select the voxels with a grey level between 0 and 250 HU (in white) corresponding to STS and degraded CaHA; the voxels with a grey level above 250 HU (in pink) correspond to undegraded CaHA. (C) 3D model of nodules of undegraded CaHA (in blue) presented in 3D view on Day 0 + 30 min. |
For STS plus dispersed CaHA, the relevant HU threshold was determined between 0HU and +250HU and all voxels within this range were selected in an ROI and corresponded to STS with the dispersed CaHA (Figure 1B). Then, a 3D model of these selected voxels (Figure 1C) was obtained allowing the calculation of the total volume (in mm3) of each bump of not dispersed dermal filler. Additionally, a voxels frequency analysis was performed on all sites for the density HU range of 0 to infinite (ie, number of voxels with given density) and plotted over HU density value.
The volume (in mm3) of the ROI corresponding to each bump of dermal filler product and the mean density (in HU) of each bump were calculated at each timepoint. To assess the evolution over time of the elimination of injected CaHA, the mean volume ± standard deviation (SD) and the average of mean density ± SD were calculated for each dermal filler product.
Histology
After fixation in 10% NBF and micro-CT analysis, a total of 30 sites and one T0 site were cut into five blocks. The blocks were decalcified for 48 h with formic acid and then dehydrated in alcohol solutions of increasing concentration, cleared in xylene, and embedded in paraffin. Following embedding, the poor quality was evidenced by suboptimal decalcification of CaHA microspheres; the blocks were then decalcified in EDTA for 30 min. Finally, the blocks were placed in HCl (hydrochloric acid) for 15 min and were cut to obtain the necessary slides for the histopathologic evaluation. One central transverse section per site was cut with a microtome (4.5 µm thickness) and stained with safranin-hematoxylin-eosin (SHE). The same procedure was used for the preparation of the T0 site used for structural characterization and evaluation of the degradation. Qualitative and semi-quantitative histopathologic evaluation of the local tissue effects and the inflammatory response at injection sites was conducted. Parameters evaluated histopathologically were graded as described in Table 1.
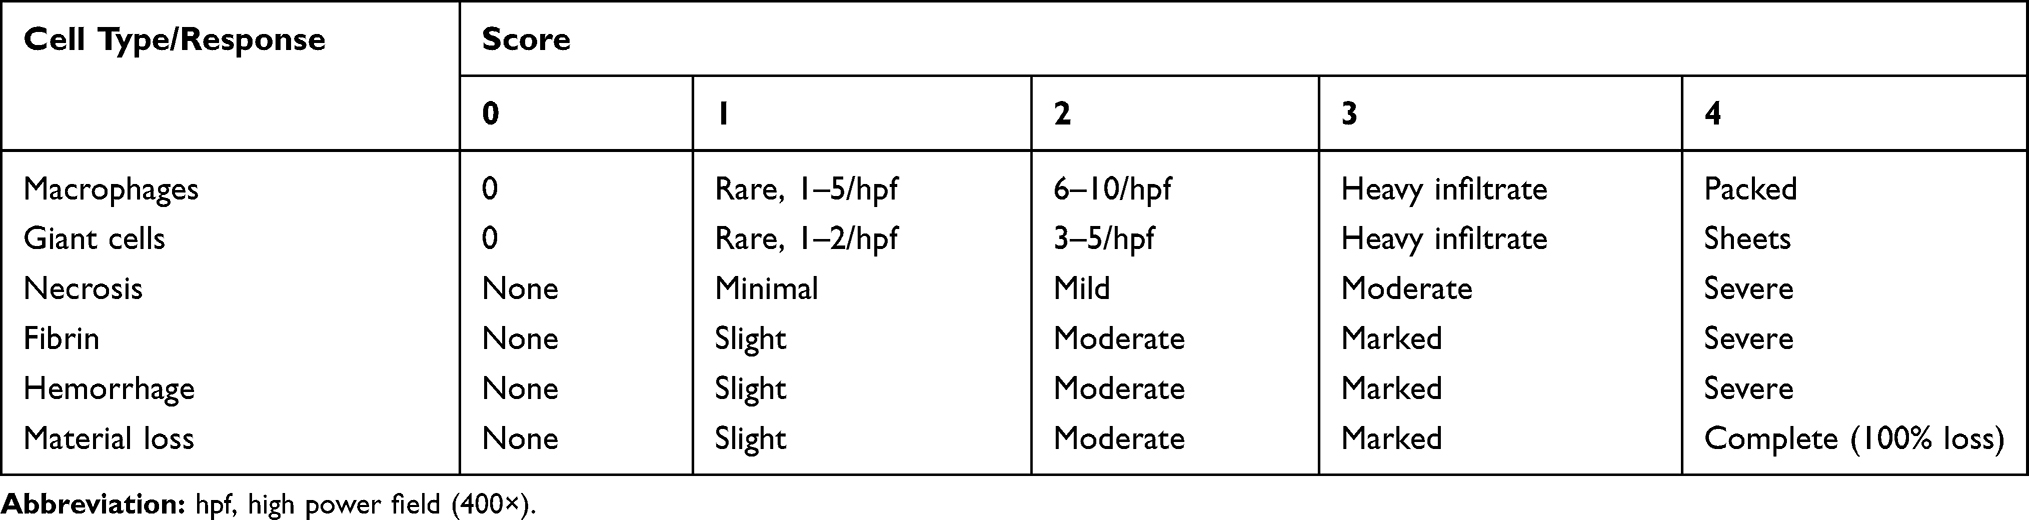 |
Table 1 Histopathology Evaluation Scoring Systems – Injection Sites |
Histomorphometry
The histomorphometric analysis was conducted on 31 sections, which were examined with a color semi-automatic image analyzing system (Tribvn, France, CALOPIX version 3.2.0). An area was defined where the print of the CaHA microspheres was clear and referred to as the test area (containing 100 to 300 defined granules to be considered as representative). The test area was defined to evaluate the average area and diameter of the microspheres. The injected area was the entire area where the material was detected on the slide. The test area was a subpart of the injected area (Figure 2). Quantitative measurements were performed either in the test area or in the entire injected area to determine the following parameters:
 |
Figure 2 Histologic sections for local tissue effect and histomorphometric analysis. Injected area is delimited by red line. |
• Number of granules (test area): a manual counting of a representative number of CaHA microspheres clearly defined on the slide.
• CaHA microspheres area (mm2) (injected area): the surface of CaHA microspheres was measured in the entire injected area (including lacunae area).
• Number of CaHA microspheres (injected area): the implant area (injected area) was divided by the average area of a microsphere to estimate the number of microspheres in the entire injected area.
• Lacunae area (mm2) (injected area): the surface of the lacunae area was measured as defined by the optically empty spaces corresponding to merged microspheres (no distinct limits between several microspheres).
Electron Microscopy
Sites dedicated to EM analysis underwent a lateral biopsy (approximately 5x5x5 mm) and were harvested. The biopsy underwent an enzymatic digestion with protease (trypsin without EDTA, for 30 days, at 37°C) after fixation in 10% NBF. Then after centrifugation, the supernatant (as well as the pellet) was prepared. For SEM, Phenom Pure G3 and Phenom Pro Suite software were used followed by ImageJ 1.51j8. The procedure was as follows:
1. Sample preparation: 40.00 ± 1.00 g water was added to each sample (50 mL falcon tube), shaken and left overnight. The following day the tissue was extracted from the top of the solution. The clear supernatant was removed with a pipette, and 40.00 ± 1.00 g water was added. Next, samples were shaken and left for 30 minutes. The washing procedure was repeated once more, and 35 mL of water was removed from each sample.
2. Loading samples (3x): samples were shaken until well suspended, and 3 mL of the suspension was immediately removed. After 30 seconds, the particles were placed on the carbon adhesive pad. All liquid was removed with air pressure (1–1.5 bar) until the sample stub pin was completely dry. Next, samples were mounted and immobilized on the stub. Then, samples were placed in the SEM.
3. Measurement: Phenom Pro Suite was used to evaluate the selected area of 9.0x9.0mm (ie, 81 mm2) (magnification 500x; range: 19,000–19,200 pxl/µm).
Statistical Analysis
SigmaPlot 14.0 software (Systat Software) was used for statistical data analysis. All data for analysis were first checked for normality of distribution (Gaussian) and similarity of variance. If both criteria were met, one-way ANOVA was used followed by Dunnett test. In case the normality test failed, ANOVA on ranks (Kruskal Wallis) was used; if significant, this was followed by a post-hoc test for pairwise comparison. All data were expressed as mean ± SEM or raw data. In the case of in vivo CT analysis, the Student’s t-test was used for comparison of CaHA alone (CaHA) vs CaHA+STS (CaHA+STS) separately for each time point. Repetitive measures ANOVA was not applied due to the modest number of sites per group (N=5).
Results
In vitro
Scoring
Surface changes of CaHA microspheres after incubation with H2O, PBS, STS, and EDTA were evaluated with a scoring system. In Figure 3, representative pictures of different surface structures with their scoring points are shown. A score of 0 indicates a CaHA microsphere that is perfectly round and has no irregularities on the surface. A score of 1 shows a microsphere, which is fully intact but shows signs of an irregular surface. The appearance of irregularities and holes on the surface of microspheres was scored as 2. A score of 3 indicates a porous surface. These data clearly show a range of CaHA microsphere behaviors after incubation with different compounds.
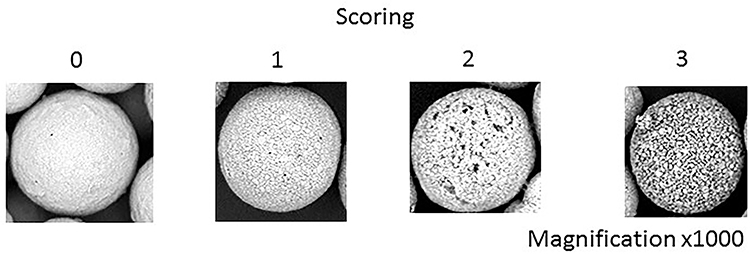 |
Figure 3 Representative electron microscopy images of CaHA microspheres from in vitro experiment and their surface appearance after incubation with different chemical agents. Scoring increased from 0 (no changes of the surface structure), 1 (slight changes of the surface structure), 2 (intermediate changes of the surface structure) to 3 (extensive changes of the surface structure). A high scoring number indicates significant changes in surface appearance of CaHA microspheres in comparison to smooth, round, and untreated microspheres. |
Effect of STS on the Surface Structure of CaHA Microspheres
Three different systems were used to evaluate the effect of STS on CaHA microspheres. The first experiments were performed in glass tubes. After 3 days of incubation (Figure 4A), there were no effects visible on the surface structure of CaHA microspheres using 25% STS with a mean scoring of 0.5. In contrast, our positive control EDTA had a major effect on the surface structure with a mean score of 1.75. CaHA microspheres were also incubated for 7 days (Figure 4B) to increase the probability of the reagent exhibiting effects on the surface structure. Even after 7 days of incubation, 25% STS had no effect on CaHA surface appearance (Scoring of 0.25). Incubation with a 0.1M EDTA solution led to porous CaHA microspheres with a score of 2.25.
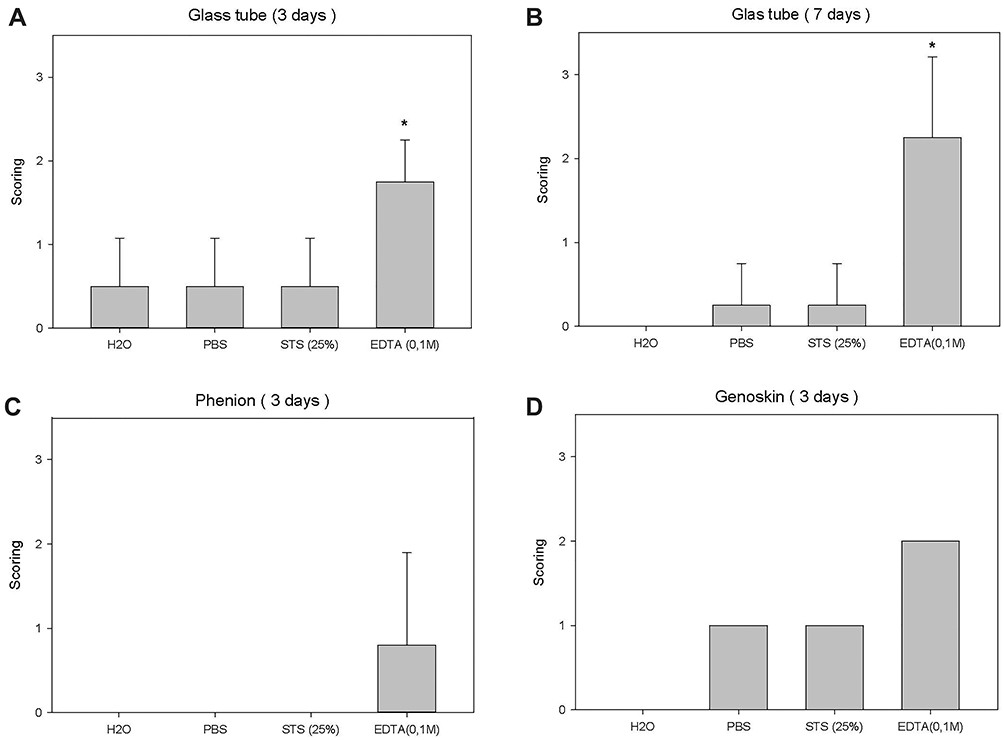 |
Figure 4 Scoring of surface structure appearance for the incubation of CaHA microspheres in a glass tube for 3 days (A) and for 7 days (B) with different compounds is shown. N=4 per group. (C) Scoring after 3 days of incubation in a human skin equivalent (Phenion) is shown. N=4 per group. (D) Incubation of CaHA microspheres in a human ex vivo skin (NativeSkin; n=1) is shown and the respective scoring. *p<0.05 Holm-Sidak method. |
To determine the effect of STS in an in vitro model, CaHA was injected into a 3D in vitro human skin equivalent (Phenion). Figure 4C shows that the injection of 50 µL of 25% STS into the CaHA bump did not affect the surface structure of CaHA microspheres after 3 days of incubation. The 0.1M EDTA solution had a score of 1.1, representing slight effects on the surface appearance of CaHA microspheres. Finally, CaHA and the chemical agents were injected into an ex vivo human skin model (NativeSkin). Slight surface irregularities were seen for 25% STS solution and PBS. In comparison, 0.1M EDTA solution had a score of 2, indicating a strong interaction between EDTA with CaHA microspheres (Figure 4D). Overall, our data suggest that STS had no effect on the surface structure of CaHA microspheres and appears not to exhibit the potential to dissolve these microspheres. In contrast to STS, EDTA demonstrated interactions with the surface leading to porous CaHA microspheres, but the ability to dissolve CaHA in these model systems is likely limited given the high concentration and long duration of exposure required.
In vivo
3D Camera Imaging
At 90 min post-injection, a large increase of volume was observed for CaHA+STS with less of an increase in the CaHA+saline (Sal) groups (Figure 5). The total theoretical volume injected corresponds to 2000 µL (500 µL CaHA + 1500 µL of injected STS or saline), which partially explains the increase observed. Surprisingly, 2700 µL total volume was observed for the CaHA+STS group and was statistically larger compared to both CaHA and CaHA+Sal groups at 90 min (Kruskal–Wallis one-way ANOVA on ranks, H=25.06, P=0.001, Dunnet’s test P<0.05). On Day 5, a greater volume increase was also observed for the CaHA+STS group as compared to CaHA+Sal group (Kruskal–Wallis one-way ANOVA on ranks, H=7.45, P=0.024, Dunnett’s test P=0.042).
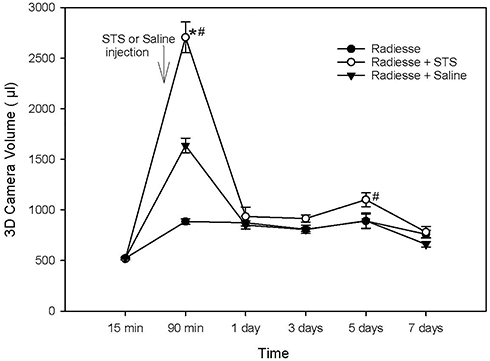 |
Figure 5 CaHA volume as estimated using 3D camera for experimental groups 7 days after injection. N=10 per group. Results are shown as mean±SEM. *p<0.05 vs CaHA® alone, #p<0.05 vs CaHA+Saline, Dunnett’s test. |
Micro-Computed Tomography (µct)
There were no visual differences in the appearance between experimental groups when comparing µCT images (Figure 6). However, statistical analysis indicated significantly lower volume in the CaHA+STS and STS+Sal groups as compared to CaHA alone (one-way ANOVA F (2,29) =8.98, followed by Dunnett’s test, P<0.05) (Figure 7). The difference between CaHA+STS and CaHA+Sal was not significant. Thus, the CaHA microsphere volume significantly dropped after administration of the STS when compared to CaHA alone.
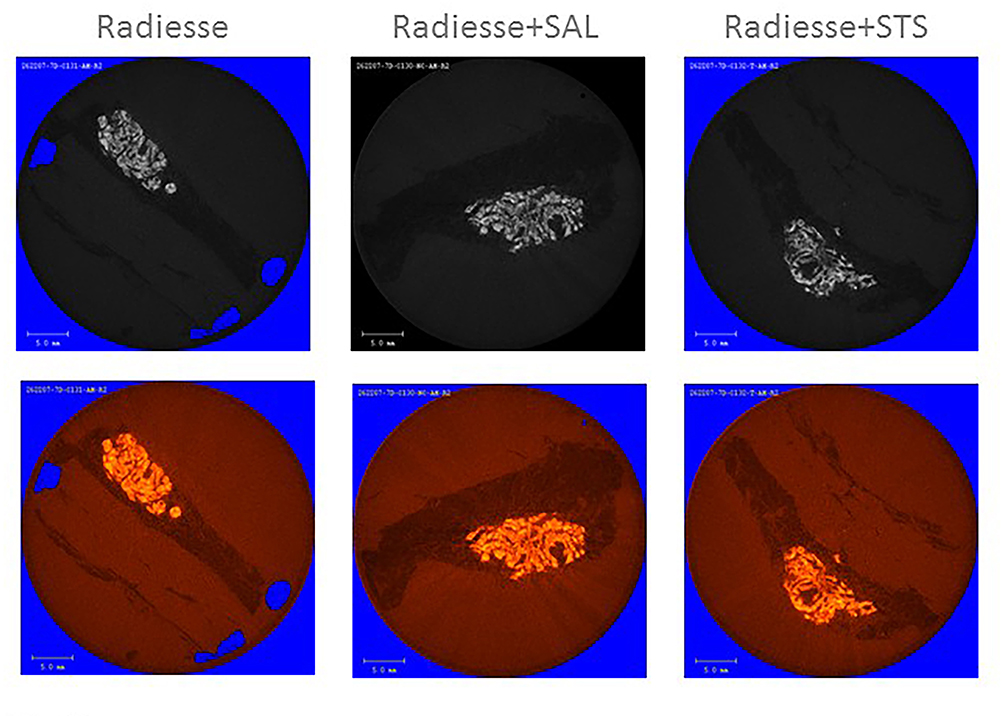 |
Figure 6 Representative images from µCT analysis of each group in grey scale (upper raw) and with color visualization (lower row). |
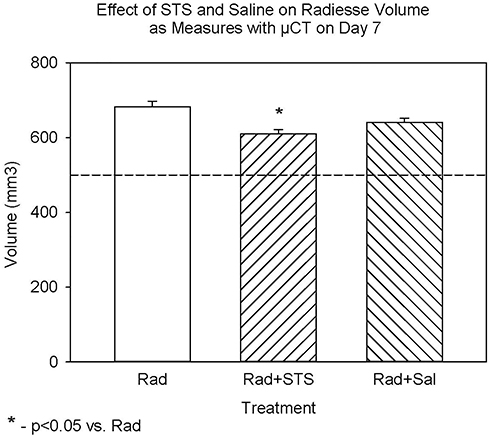 |
Figure 7 CaHA volume as estimated using µCT for experimental groups 7 days after injection. N=10 per group. Results are shown as mean±SEM. *p<0.05 Dunnett’s test vs CaHA alone. |
Computed Tomography (CT)
The injected mass for CaHA was 834.7±12.6 µg (mean ± SD, N=10) and calculated volume 505.9±7.6 µL. The calculated injected volume of STS was 1559.3±23.8 µL (mean ± SD, N=5), and the injected mass was 1746.5±26.7 µg. Approximately 30 minutes post-injection of CaHA, the mean volume of all bumps was 656.8 ± 48.9 mm3 and was slightly increased as compared to the targeted volume of 500 µL. At 4 h and on Day 1, CaHA+STS (Figure 8), the diluted fraction of the filler defined by 50–250 HU density, was observed as a grey/white “cloud” on the image. On Day 7, this was less visible and appeared only on some sites (Figure 8).
 |
Figure 8 3D models of CaHA injected in pig on Day 0+30min, Day 0+4h, Days 1 and 7. Pure CaHA nodules without STS are in blue, pure CaHA nodules with STS are in pink and diluted CaHA + STS in white/grey. |
Figure 9 shows the changes in filler volume after STS injection. Note that CaHA+STS high is defined as unchanged CaHA (HU=250-infinity), while CaHA+STS low (0–250 HU) corresponds to CaHA which has been diluted, degraded, or dispersed. The total is the sum of both high and low. A significant increase of CaHA+STS high volume vs CaHA was observed at 90 min, ie shortly after STS injection. The highest peak of the volume is seen at 4 h for both CaHA+STS total and CaHA+STS low. This likely indicates high water intake into this compartment. After 7 days, no difference between CaHA and CaHA+STS high was observed.
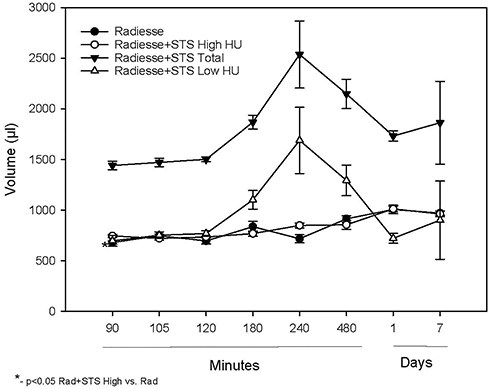 |
Figure 9 Effect of STS on CaHA volume after SC injection. Data for CaHA injected with STS are expressed as Total (0-infinity HU); High HU (250-infinity HU) and low HU (0–250 HU). Data are shown as mean±SEM. Statistical comparison was only performed for CaHA vs CaHA+STS high with the only statistically significant difference seen at 90 min. *p<0.05 Student’s t-test. |
Changes in filler mean density after STS injection are shown in Figure 10. A significant increase of CaHA+STS high means density was observed after 2 h, probably reflecting water translocation. A trend for a decrease in CaHA+STS high mean density vs CaHA was observed on Day 7. This could indicate a transition of CaHA particles to a more diluted fraction (CaHA+STS low), which led to increases in volume and decreases in mean density.
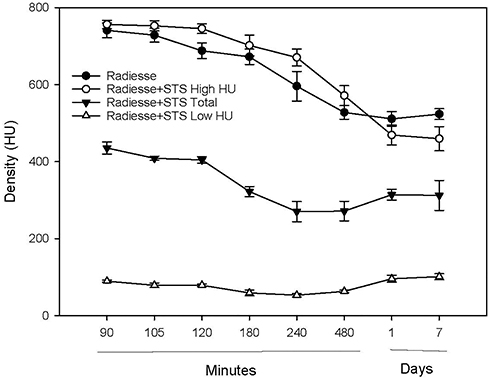 |
Figure 10 Effect of STS on CaHA mean density after SC injection. Data for CaHA injected with STS are expressed as Total (0-infinity HU); High HU (250-infinity HU) and low HU (0–250 HU). Data are shown as mean±SEM (N=5 per group). Statistical comparison was performed only for CaHA vs CaHA+STS high and the only statistically significant difference was observed at 120 min. |
When analyzed separately, changes in volume and density do not provide sufficient information on CaHA dynamics. Namely, volume could increase while mean density decreases, resulting in no net change in CaHA content. This was circumvented by determining the product of volume and mean density as a measure of overall CaHA content (Figure 11). Of note is the significant decrease in CaHA content in the CaHA+STS high fraction compared to CaHA and a parallel trend for an increase in CaHA content in CaHA+STS low fraction on Day 7. This is probably related to the transition of CaHA particles to a more diluted fraction (CaHA+STS low).
 |
Figure 11 Effect of STS on CaHA amount (defined as mean density × volume) after SC injection. Data for CaHA injected with STS are expressed as Total (0-infinity HU); High HU (250-infinity HU) and low HU (0–250 HU). Data are shown as mean±SEM. Statistical comparison was performed only for CaHA vs CaHA+STS high and the only statistically significant difference was observed at 7 days. *P<0.05 Student’s t-test. |
These analyses were based on mean HU density values within a fixed range. To investigate the full range of densities, an analysis of the number of voxels that can be allocated to a given HU value for the density range is needed. Zero to infinity was performed (Figure 12). After 75 min (15 min after STS injection), the most frequent density for the CaHA group was about 1070 HU (Figure 12A, dark blue) and approximately 100 HU for CaHA+STS (Figure 12B, dark blue). There was a clear shift to lower density after STS injection, likely due to a dispersion effect. For the density above 250HU and on T=1h15, the peak for CaHA was at 1070 HU with 92 occurrences (Figure 12C, dark blue); for CaHA+STS, the peak was at 1060 with about 98 occurrences (Figure 12D, dark blue). After 2 h, a parallel shift to the left for both groups was observed (Figure 12, orange). After 3 h, there was a further trend towards a left shift, and for the CaHA+STS group, most voxels corresponded to HU below 50, ie very close to the density of water (HU=0) (Figure 12B and D, grey). After 4 h, the trend towards a left shift for the CaHA+STS group continued (Figure 12B and D, red). After 1 day, most voxels in the CaHA+STS group were below 50HU (Figure 12B and D, green). After 7 days, most of the voxels in the CaHA group corresponded to 300–700 HU (Figure 12A and C, black). However, for the CaHA+STS group, there were two peaks, below 50HU and between 250 and 450HU (Figure 12B and D, black).
 |
Figure 12 Frequency plot, density (HU) is presented on x-axis and the number of voxels on y-axis. Plot (A and B) show whole HU range (0-infinity) for CaHA and CaHA+STS respectively. Plots (C and D) show a section from (A and B) respectively but limited to 250-infinity HU range to allow better insight. Data are mean of 5 sites. |
Histology
Scoring of histological slices revealed the following significant differences (Table 2):
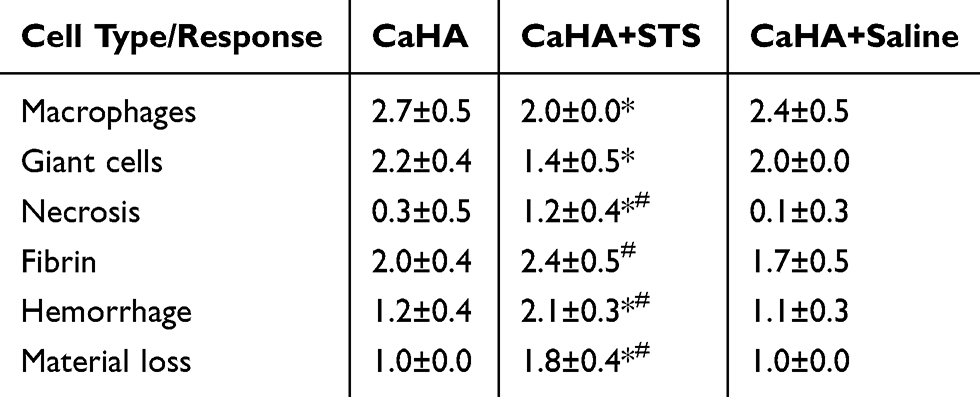 |
Table 2 Semi-Quantitative Scoring of Histological Slices. Data Were Analyzed Using Dunnett’s Test. *P<0.05 vs CaHA, #P<0.05 vs CaHA+ Saline |
1.Lower level of macrophages in CaHA+STS group as compared to CaHA alone (Kruskal–Wallis one-way ANOVA on ranks, H=10.27, P<0.006 followed by Dunnett's test, P=0.021)
2.Lower level of giant cells in CaHA+STS group as compared to CaHA alone (Kruskal–Wallis one-way ANOVA on ranks, H=13.88, P<0.001 followed by Dunnett’ test, P=0.017)
3.Higher level of necrosis in CaHA+STS group as compared to both CaHA alone and CaHA+Sal groups (Kruskal–Wallis one-way ANOVA on ranks, H=18.04, P<0.001 followed by Dunnett’s test, P=0.01)
4.Higher level of fibrin in CaHA+STS group as compared to CaHA+Sal group (one-way ANOVA, F (2,29) =5.12, P<0.013 followed by Dunnett’s test, P=0.007)
5.Higher level of hemorrhage in CaHA+STS group as compared to both CaHA alone and CaHA+Sal groups (one-way ANOVA, F (2,29) =24.09, P<0.001 followed by Dunnett’s test, P=0.001)
6.Higher level of filler loss in CaHA+STS group as compared to both CaHA alone and CaHA+Sal groups (Kruskal–Wallis one-way ANOVA on ranks, H=21.09, P<0.001 followed by Dunnett’s test, P=0.007)
There was no difference in the number of lymphocytes and polymorphonuclear cells (not shown). On Day 7, the CaHA microspheres appeared as multiple microsphere footprints or granular grey microspheres that formed uniform and/or multiple aggregates on the decalcified paraffin slides (Figure 13). In both groups, the microspheres were surrounded by a moderate to the marked number of macrophages and multinucleated giant cells admixed with lymphocytes and polymorphonuclear cells. Evidence of hemorrhage was also observed. In the group treated with STS, the CaHA microspheres appeared as multiple microsphere footprints or granular grey microspheres that formed uniform or multiple aggregates occupying a lower surface area compared to that of other treatment groups. The residual article induced a foreign body reaction. Cell-mediated material degradation of a slight grade occurred. Slight signs of necrosis were frequently observed (inflammatory cell debris, fat cell necrosis, vascular necrosis, hemorrhage). Evidence of a moderate grade of hemorrhage was noted. The injection of saline did not produce any differences as compared to the CaHA group.
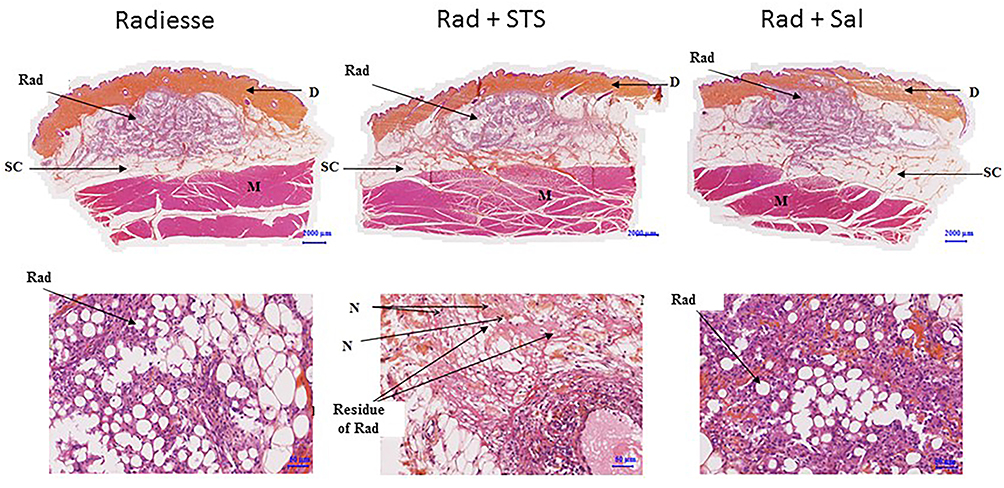 |
Figure 13 Representative histology slices stained with safranin, hematoxylin and eosin for site treated with (from left to right) CaHA only, CaHA+STS and CaHA+saline with low (upper raw) and high (lower raw) magnification. Abbreviations: CaHA, calcium hydroxylapatite; N, necrosis; SC, subcutaneous compartments; D, dermis; M, muscle. |
Histomorphometry
Analysis of histomorphometry data provided significant differences in the injected area as in Table 3:
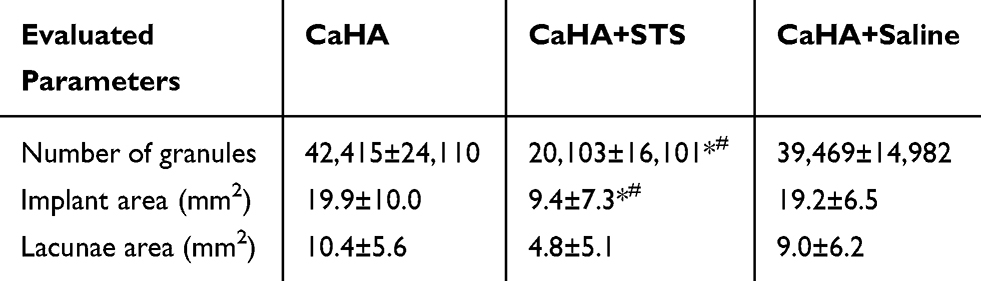 |
Table 3 Summary of Histomorphometry Evaluation of the Injected Area. Results are Shown as mean±SD. *P<0.05 vs CaHA Alone; #P<0.05 vs CaHA+Saline, Dunnett’s Test |
1. The number of granules was lower in CaHA+STS group than in CaHA alone and CaHA+Sal groups (Kruskal–Wallis one-way ANOVA on ranks, H=8.7, P=0.013, followed by Dunnett’s test p<0.035).
2. The surface of implant+lacunae area was lower in CaHA+STS group than in CaHA alone and CaHA+Sal groups (Kruskal–Wallis one-way ANOVA on ranks, H=9.68, P=0.008, followed by Dunnett’s test p<0.03).
3. The differences in lacunae area were not significant due to high variability.
In the whole slide, one-way ANOVA followed by Dunnett’s test revealed a significantly lower implant+lacunae area in the CaHA+STS group compared to both CaHA alone and CaHA+Sal groups (ANOVA F (2.29) =7.37, P=0.003, Dunnett’s P<0.007). The mean±SEM values were as follows: CaHA alone: 6.07±0.64 mm2; CaHA+STS: 2.81±0.72 mm2; CaHA+Sal: 6.21±0.76 mm2.
Electron Microscopy
Electron microscopy analysis (one sample per group only) showed no difference in particle mean diameter or distribution of particle sizes (Table 4). Moreover, there were no signs of change on the particle surface that would indicate degradation, in particular for the STS group (Figure 14). There was also no difference in the D-ratio, which describes particle shape, ie it is 1 for an ideally round sphere.
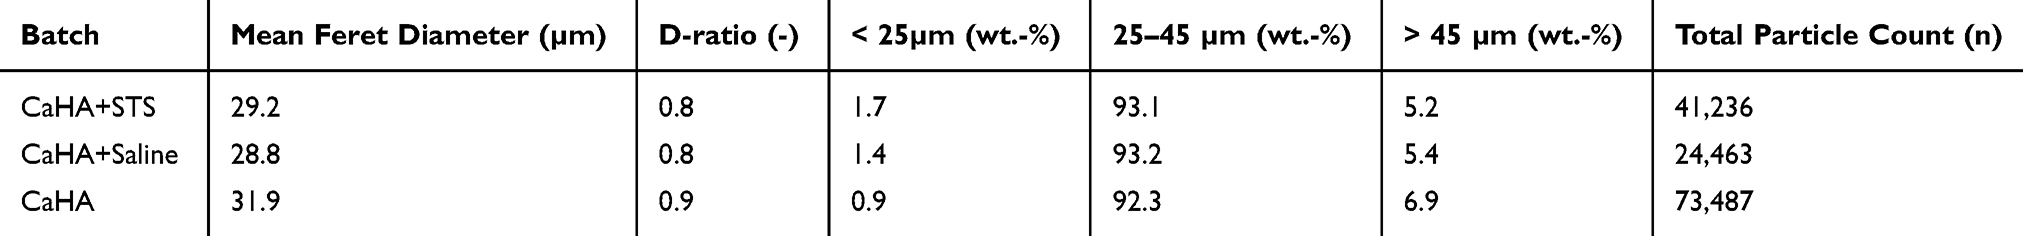 |
Table 4 Summary of Analysis of Electron Microscopy Images |
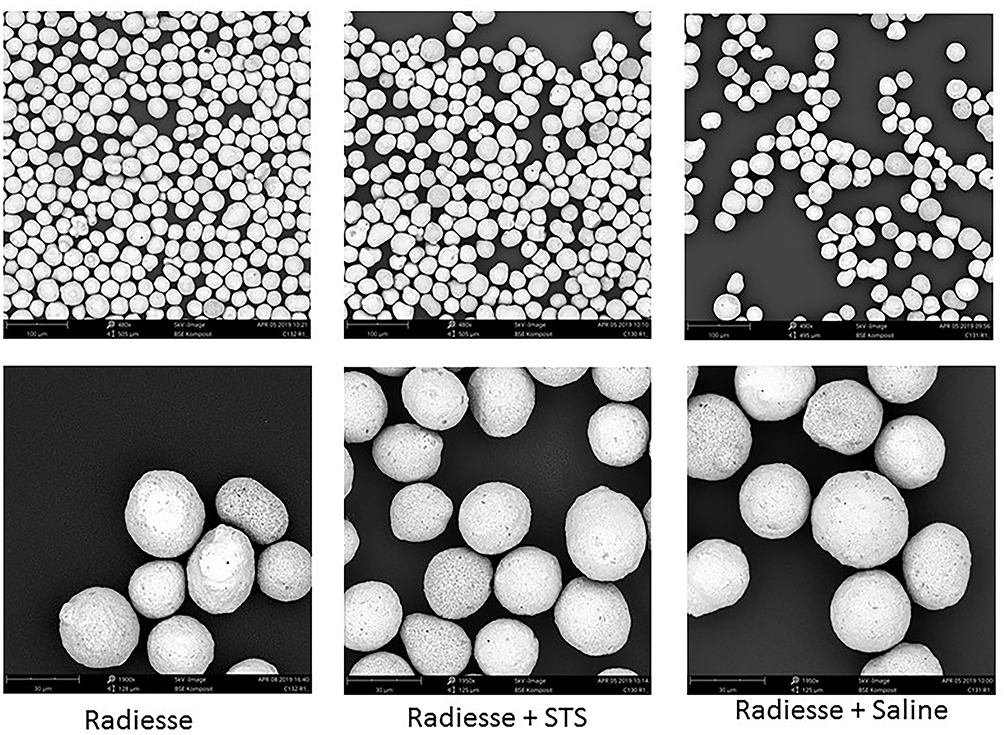 |
Figure 14 Representative scanning electron microscopy (SEM) images from in vivo experiment. |
Discussion
In this study, histology (histomorphometry and scoring) indicated that there was reduced CaHA in the sites injected with STS as compared to sites injected with saline or CaHA alone. Histology also demonstrated an increase in necrosis and hemorrhage in the STS injected sites. While 3D camera analysis indicated no difference between CaHA+STS and CaHA+Sal treatments, µCT demonstrated a significantly lower volume of CaHA+STS vs CaHA alone, but no difference compared to CaHA+Sal. This apparent discrepancy may be explained by the fact that 3D camera measures change in concave skin appearance. In contrast, the CT measures CaHA based on mean density criteria and can image full volumes, as the filler product tends to spread within the tissues (in Figure 8) the volume may be difficult to measure with 3D camera. Water intake following STS administration may also interfere with volume measurements. In vivo CT analysis using density (HU) criteria indicated that 7 days after STS injection there was less CaHA present in the tissue. This was determined by calculating the multiplication of volume with density. Electron microscopy showed no signs or indication of CaHA degradation by STS. The analysis of density frequency plots at different time points was performed to learn about the possible mechanism of STS effects.
It has been hypothesized that the effect of STS may be related to high osmolality that results in a rapid water draw from surrounding tissue and a “blow out” dispersion/dilution of CaHA, with the CaHA particles subsequently becoming phagocytized. The results from in vitro experiments where long co-incubation of CaHA and STS was used followed by electron microscopy analysis suggest that the potential to degrade CaHA microspheres with STS is very limited. However, in vivo, the injection of STS into CaHA does reduce the density of CaHA microspheres compared to saline injections. Early studies on the potential degradative effects of STS on CaHA were encouraging in that they demonstrated a volume reduction in CaHA and a reduction in the number of microspheres in a high-power field.12,13,16–18 These initial pilot studies were in vivo human and animal models with small sample sizes that did not have robust control arms, if any at all. Their designs were not geared towards demonstrating the mechanism of action but instead showed only a clinical effect.12,13,16–18 Understanding the mechanism is essential in determining an agent’s reversal potential when considering different types of clinical scenarios.
Based on this understanding of STS’s mechanism of action on CaHA, STS would not be successful in the treatment of a vascular occlusive event. However, as suggested by an earlier human histologic study and case reports, when used in small amounts over several sessions and injected directly into the CaHA implant, STS could be effective in the treatment of overcorrection and nodule formation.12,13,16–18 Nevertheless, the findings of necrosis and hemorrhage should not be neglected.
It should be stated that there are two limitations to the present study:
1.The translational aspect of extrapolation from animal to man.
2.STS treatment was performed 1 hr after CaHA, while in clinical practice it is often a week or more afterwards.
The results of this study indicate that the STS mechanism of action on CaHA is consistent with a dispersion effect. One hypothesis for greater dispersion effect with STS compared to saline is that STS may trigger subsequent tissue reactions on injection, facilitating the spread of CaHA microspheres. The results also demonstrate that CaHA particles were not degraded by STS. In contrast to EDTA, STS had no influence on the structure of CaHA microspheres. On increasing time and repeated injection of EDTA, dissolution of CaHA could be achieved, but the safety of EDTA is a significant concern due to its toxicity.19
Conclusion
This study only partially supports the potential clinical efficacy of STS as an intralesionally injected dispersion agent that can reduce CaHA volume to address overcorrection, product misplacement, or the need to reduce a nodule.12,13,16,17 Saline dilution is a known safe option for the reduction of CaHA volume with limited efficacy.18 While STS dilution may be the superior dilutant, it may carry the additional risk of tissue necrosis and hemorrhage. It is very important to note that because the mechanism of action is not consistent with degradation, STS would not be an effective agent to reverse vascular occlusions. While STS did demonstrate benefits as a dilatant in certain clinical scenarios, other potentially more efficacious and innocuous degradation agents for CaHA should continue to be explored.
Acknowledgments
This manuscript was supported by Merz Pharmaceuticals GmbH, Frankfurt am Main, Germany. Medical writing support was provided by Emma Robertson, formerly of Merz Pharmaceuticals GmbH, Frankfurt am Main, Germany in accordance with Good Publication Practice (GPP3) guidelines.
Disclosures
Prof. W. Danysz, Dr. T. Hengl, Dr. B. Nowag and C. Höennscheidt are employees of Merz Pharmaceuticals GmbH. P. Kreymermann, MD is a former employee of Merz North America. Drs. Furne and Madeuf are employees of CROs contracted by Merz. Wojciech Danysz reports a patent, USSN 62/949,381, pending (in this patent STS is one of the solutions). Peter Kreymerman has a patent, High osmolarity dilution of Radiesse, issued. C Furne is an employee of NAMSA and reports grants from MERZ PHARMACEUTICALS GmbH, during the conduct of the study and outside the submitted work. E Madeuf is an employee of Voxcan. Dr. D. Mraz Robinson is a consultant for Merz and reports research for Merz, outside the submitted work. The authors report no other potential conflicts of interest for this work.
References
1. American Society for Plastic Surgery. Cosmetic (Aesthetic) surgery national data bank statistics report; 2018. Available from: https://www.surgery.org/sites/default/files/ASAPS-Stats2018_0.pdf.
2. Transparency Market Research Report. Dermal fillers market global industry analysis, size, share, growth, trends, and forecast 2018 – 2026. Available from: https://www.transparencymarketresearch.com/report-toc/26816.
3. Sundaram H, Voigts B, Beer K, et al. Comparison of the rheological properties of viscosity and elasticity in two categories of soft tissue fillers: calcium hydroxylapatite and hyaluronic acid. Dermatol Surg. 2010;36(Suppl 3):1859–1865. doi:10.1111/j.1524-4725.2010.01743.x
4. Yutskovskaya YA, Kogan EA. Improved neocollagenesis and skin mechanical properties after injection of diluted calcium hydroxylapatite in the neck and décolletage: a pilot study. J Drugs Dermatol. 2017;16(1):68–74.
5. Yutskovskaya Y, Kogan E, Leshunov E, et al. A randomized, split-face, histomorphologic study comparing a volumetric calcium hydroxylapatite and a hyaluronic acid-based dermal filler. J Drugs Dermatol. 2014;13(9):1047–1052.
6. Berlin AL, Hussain M, Goldberg DJ, et al. Calcium hydroxylapatite filler for facial rejuvenation: a histologic and immunohistochemical analysis. Dermatol Surg. 2008;34(Suppl 1):S64–7. doi:10.1111/j.1524-4725.2008.34245.x
7. Marmur ES, Phelps R, Goldberg DJ, et al. Clinical, histologic and electron microscopic findings after injection of a calcium hydroxylapatite filler. J Cosmet Laser Ther. 2004;6(4):223–226. doi:10.1080/147641704100003048
8. Zerbinati N, Calligaro A. Calcium hydroxylapatite treatment of human skin: evidence of collagen turnover through picrosirius red staining and circularly polarized microscopy. Clin Cosmet Investig Dermatol. 2018;11:29–35. doi:10.2147/CCID.S143015
9. Woodward Khan T, Martin J. Facial filler complications. Facial Plast Surg Clin North Am. 2015;23(4):447–458.
10. van Loghem J, Funt D, Pavicic T, et al. Managing intravascular complications following treatment with calcium hydroxylapatite: an expert consensus. J Cosmet Dermatol. 2020;19:2845–2858. doi:10.1111/jocd.13353.
11. Murthy R, Roos JCP, Goldberg RA. Periocular hyaluronic acid fillers: applications, implications, complications. Curr Opin Ophthalmol. 2019;30(5):395–400. doi:10.1097/ICU.0000000000000595
12. Robinson DM. In vitro analysis of the degradation of calcium hydroxylapatite dermal filler: a proof-of-concept study. Dermatol Surg. 2018;44(Suppl 1):S5–S9. doi:10.1097/DSS.0000000000001683
13. Kreymerman PA, Miller W. Sodium thiosulfate injection dissolves calcium hydroxylapatite particles: an animal study. J Am Assoc Dermatol. 2018;79(3):S1.
14. O’Neill WC, Hardcastle KI. The chemistry of thiosulfate and vascular calcification. Nephrol Dial Transplant. 2012;27:521–526. doi:10.1093/ndt/gfr375
15. Lee M, McGeer EG, McGeer PL. Sodium thiosulfate attenuates glial-mediated neuroinflammation in degenerative neurological diseases. J Neuroinflamm. 2016;13:32. doi:10.1186/s12974-016-0488-8
16. Robinson DM. Commentary on the use of intralesional sodium thiosulfate to dissolve facial nodules from calcium hydroxylapatite. Dermatol Surg. 2020;Publish Ahead of Print. doi:10.1097/DSS.0000000000002360
17. Rullan PP, Olson R, Lee KC. The use of intralesional sodium thiosulfate to dissolve facial nodules from calcium hydroxylapatite. Dermatol Surg. 2019;Publish Ahead of Print. doi:10.1097/DSS.0000000000002238
18. Voigts R, Devore DP, Grazer JM. Dispersion of calcium hydroxylapatite accumulations in the skin: animal studies and clinical practice. Dermatol Surg. 2010;36:798–803. doi:10.1111/j.1524-4725.2010.01567.x
19. Lanigan RS, Yamarik TA. Final report on the safety assessment of EDTA, calcium disodium EDTA, diammonium EDTA, dipotassium EDTA, disodium EDTA, TEA-EDTA, tetrasodium EDTA, tripotassium EDTA, trisodium EDTA, HEDTA, and trisodium HEDTA. Int J Toxicol. 2002;21(Suppl 2):
 © 2020 The Author(s). This work is published and licensed by Dove Medical Press Limited. The
full terms of this license are available at https://www.dovepress.com/terms
and incorporate the Creative Commons Attribution
- Non Commercial (unported, 3.0) License.
By accessing the work you hereby accept the Terms. Non-commercial uses of the work are permitted
without any further permission from Dove Medical Press Limited, provided the work is properly
attributed. For permission for commercial use of this work, please see paragraphs 4.2 and 5 of our Terms.
© 2020 The Author(s). This work is published and licensed by Dove Medical Press Limited. The
full terms of this license are available at https://www.dovepress.com/terms
and incorporate the Creative Commons Attribution
- Non Commercial (unported, 3.0) License.
By accessing the work you hereby accept the Terms. Non-commercial uses of the work are permitted
without any further permission from Dove Medical Press Limited, provided the work is properly
attributed. For permission for commercial use of this work, please see paragraphs 4.2 and 5 of our Terms.