Back to Journals » International Journal of Nanomedicine » Volume 14
Calorimetric lateral flow immunoassay detection platform based on the photothermal effect of gold nanocages with high sensitivity, specificity, and accuracy
Authors Hu X, Wan J, Peng X, Zhao H ![]() , Shi D, Mai L, Yang H, Zhao Y
, Shi D, Mai L, Yang H, Zhao Y ![]() , Yang X
, Yang X
Received 9 June 2019
Accepted for publication 30 August 2019
Published 20 September 2019 Volume 2019:14 Pages 7695—7705
DOI https://doi.org/10.2147/IJN.S218834
Checked for plagiarism Yes
Review by Single anonymous peer review
Peer reviewer comments 3
Editor who approved publication: Dr Linlin Sun
Xiaoyan Hu,1 Jiangshan Wan,2,3 Xiaole Peng,2,3 Hao Zhao,1,3 Dingwen Shi,1,3 Liyi Mai,2 Hai Yang,1 Yanbing Zhao,1,3 Xiangliang Yang1
1National Engineering Research Center for Nanomedicine, College of Life Science and Technology, Huazhong University of Science and Technology, Wuhan 430074, People’s Republic of China; 2Institute of Consun Co. For Chinese Medicine in Kidney Diseases, C. Consum Pharmaceutical Group, Shenzhen 518000, People’s Republic of China; 3Shenzhen Institute of Huazhong University of Science and Technology, Shenzhen 518057, People’s Republic of China
Correspondence: Hai Yang
National Engineering Research Center for Nanomedicine, College of Life Science and Technology, Huazhong University of Science and Technology, Wuhan 430074, People’s Republic of China
Email [email protected]
Yanbing Zhao
National Engineering Research Center for Nanomedicine, College of Life Science and Technology, Huazhong University of Science and Technology, Wuhan 430074, People’s Republic of China
Email [email protected]
Background: Lateral flow assays (LFA) play an increasingly important role in the rapid detection of various pathogens, pollutants, and toxins.
Purpose: To overcome the drawbacks of low sensitivity and poor quantification in LFA, we developed a new calorimetric LFA (CLFA) using gold nanocages (GNCs) due to their high photothermal conversion efficiency, good stability of photophysical properties, and stronger penetrating ability of NIR light.
Methods: Thiol-polyethylene glycol-succinyl imide ester (HS-PEG-NHS) was modified onto GNCs, and the complex was conjugated with an antibody. Subsequently, the antibody-conjugated GNCs were analyzed by UV/Vis spectrophotometer, transmission electron microscope, high-resolution transmission electron microscope with energy dispersive spectrometer, dynamic light scattering instrument, and Atom force microscope. The GNC-based CLFA of alpha-fetoprotein (AFP) and zearalenone (ZEN), a food toxin, required nitrocellulose strips, a NIR laser source, and an infrared camera.
Results: The GNC-labeled CLFA platform technique exhibited detection sensitivity, qualitative specificity, and quantitative accuracy. The superior performance of the technique was evident both in sandwich format detection of biomacromolecules (eg, AFP protein) or competitive format detection of small molecules (eg, ZEN). After optimizing various test parameters, GNC-labeled CLFA provided ca. 5-6-fold enhanced sensitivity, higher correlativity (R2>0.99), and more favorable recovery (82–115%) when compared with visual LFA.
Conclusion: GNC-labeled CLFA may be a promising detection platform with high sensitivity, specificity, and precision.
Keywords: lateral flow assays, LFA, gold nanocages, photothermal effect, alpha-fetoprotein, AFP, zearalenone, ZEN
Introduction
Rapid and accurate detection of pathogens, tumor markers,pollutants, and/or toxins is important for clinical diagnosis, environment protection, and food safety.1,2 Compared with conventional analytical methods, lateral flow assays (LFA) play an increasingly important role due to their advantages, such as cost-effectiveness, rapidity, easy operation, friendly use, and colorimetric readout. LFA strips usually consist of a nitrocellulose substrate that contains a series of functional areas, each of which stores a specific chemical reagent. Driven by capillary force, liquid samples transport along the LFA strips and react with the reagents. The presence of the target analyte causes a change in the output signal, whose intensity is measured for qualitative or semiquantitative analysis. Visual sensing is the most often used signal readout method for LFA tests. However, the application of visual LFA (VLFA) in point-of-care diagnosis and toxin analysis was severely limited by its lower sensitivity (usually mM to μM of detection limit) than other “wet-chemistry” techniques, such as enzyme-linked immunosorbent assays (ELISA) and high pressure liquid/gas chromatography-mass spectrometry (HPLC-MS/GC-MS).
To meet the increasing requirement of highly sensitive, specific, and quantitative analysis of targeted substrates (small molecules, protein, DNA etc.), various technologies have been investigated, including microfluidics, biobarcodes, quantitative readout systems, and new signal resources though they are not yet ready for commercial application.3–8 For instance, hand-held or smartphone-based LFA readers were developed for the readout of visual signals of LFA better than naked eyes, and thus improve the sensitivity of LFAs. Some new signal resources, such as fluorescence,9 chemiluminescence,10,11 surface-enhanced Raman scattering (SERS),4,5,12 electrochemistry,13,14 magnetic and acoustic signals,15–19 have been used to fabricate highly sensitive LFA devices. Also, nanomaterial labels, including metal/carbon nanoparticles, quantum dots, magnetic nanoparticles, up-converting nanomaterials,9,20–23 played a crucial role in improving the performance of LFA tests. These nanomaterials can amplify the optical signal, and then improve the sensitivity and selectivity of LFA detection for various analytes. For example, gold nanoparticles (GNP) are a perfect candidate for colorimetric assays because of their ultrahigh extinction coefficients (>1000 times higher than most organic dyes), a stable optical signal, easy synthesis, and modification.24,25 Therefore, colloidal gold/gold nanoparticle-based LFA strips have been successfully developed for the rapid detection (usually <10 min) of pregnancy (HCG, LH, FSH), infectious diseases (HIV, HCV, HBV, HBsAg), drug residues (morphine, cocaine, marihuana, ecstasy, ractopamine), tumor markers (PSA, CEA, AFP, CAl25 and CAl5-3) etc.26–30 However, most existing GNP-labelled LFA still suffer from lower sensitivity and lack of quantification, since the color signals of GNPs can only be read out on chromatoplate surface. Some techniques, such as silver deposition, NH2OH·HCl enlargement, and GNPs with larger sizes, can achieve signal amplification and improve the detection sensitivity of GNP-labelled LFA.31–34 However, it is still desirable to design new GNP-labelled LFA with high sensitivity and quantification ability for the rapid detection of various analytes.
Besides their unique color signal, gold nanoparticles also have specific properties including localized surface plasmon resonance (LSPR) and fluorescence quenching ability, which are considered promising assets for achieving high sensitivity of the quantitative analysis.24 For instance, Bischof’s group reported that AuNPs, based on their LSPR effect, generated a robust thermal signal under 532 nm wavelength laser, and thus were developed as a calorimetric LFA (CLFA).35,36 The CLFA might realize a 32-fold increase in detection sensitivity compared to the colorimetric AuNP-LFA, and even higher than 10,000-fold increase by further optimizing the test conditions. Compared to solid gold nanospheres, hollow gold nanocages (GNCs) might be a promising photothermal label for CLFA due to two advantages: 1) higher photothermal conversion efficacy: GNCs are considered as one of the highest photothermal transducers in various gold nanostructures (e.g., Au nanospheres, Au nanoshells, Au nanorods, and nanostars), and therefore, can be used as a promising label of CLFA to achieve higher detection sensitivity. 2) Better penetration depth: the photothermal effect of GNCs is excited by the near-infrared (NIR) laser with a wavelength range of 700–900 nm, which has better penetration depth than visible light (λ<600 nm). Therefore, GNCs could generate a three-dimensional photothermal signal, achieving more accurate quantitative analysis.
In the present work, GNCs, which were synthesized via galvanic replacement as reported before,37–39 were first modified with thiol-polyethylene glycol-succinyl imide ester (HS-PEG-NHS) by the coordinating bonds of Au-S, and then were decorated with primary antibody by reactive ester coupling method. The resulting antibody-GNCs were used as a calorimetric label of LFA for improving the detection sensitivity and the accuracy of quantitative analysis (Scheme 1). A sandwich format LFA based on GNCs was launched by adding a drop of an aqueous sample containing target analytes onto the sample pad. The target analytes bound to antibody-GNCs on the conjugate pad, and the resultant conjugations of analyte-antibody-GNCs wicked up the paper strip under the action of a capillary force. The sandwich complexes were formed between analyte-antibody-GNCs; the second antibody was immobilized on the test line (T line), and unconjugated antibody-GNCs, which was free of analyte through T line, was bound to the third antibody in the control line (C line). To quantitatively measure the concentration of analytes, a beam of NIR laser (λ=808 nm, 200 mW) was irradiated onto the T line, and the amount of heat generated by GNCs was detected by an infrared imaging camera. The CLFA strips were placed in a foam box for preventing heat loss. Compared with other photothermal agents, such as gold nanospheres, GNCs showed ultrahigh heat generation efficiency and deeper penetration distance, enabling an accurate quantitative analysis. Thus, the calorimetric LFA-based methodology on GNCs was established and validated using two analytes, alpha-fetoprotein (AFP), a diagnostic marker of liver cancer and zearalenone (ZEN), a food toxin.
 |
Scheme 1 Schematics of CLFA based on GNCs with high photothermal conversion efficiency and deep penetration ability under NIR irradiation. (A) Conjugation of antibody onto GNCs. (B) Principle diagram of the generation, collection, and detection of heat signal in C-band and T-band of CLFA strips. Abbreviations: HS-PEG-NHS, Thiol-polyethylene glycol-succinyl imide ester; GNCs, gold nanocages; CLFA, calorimetric lateral flow assays. |
Materials and methods
Materials
All materials were purchased from commercial suppliers and used without further purification unless otherwise noted. HCl (37%) and chloroauric acid hydrate (HAuCl4∙4H2O, Au content >47.8%) were purchased from Sinopharm Chemical Reagent Co., Ltd., China. The sources of all other chemicals are as indicated: trisodium citrate dehydrate (purity >99.0%, Tianjin University Chemical Reagent Co., Ltd., China), gold nanoparticles (GNPs, 40 nm, Wuhan NDH Biotechnology Co., Ltd., China), gold-standard solution (1000 μg/mL, Aladdin Reagent Co., Ltd., China), silver trifluoroacetate (CF3COOAg, purity >99.99%, Sigma Aldrich), ethylene glycol (EG, purity >99.0%, Aladdin Reagent Co., Ltd., China), anhydrous sodium hydrosulfide (purity >99%, Alfa Aesar), polyvinylpyrroliDONe (PVP, Mw =55 kDa, Sigma Aldrich), standard solutions of gold and silver (1000 μg/mL, National Center of Analysis and Testing for Nonferrous Metals and Electronic Materials, China). All chemicals were used as received. Milli-Q ultrapure water (18.2 MΩ) was used in all experiments.
Mouse IgG was prepared by Wuhan Institute of Virology, Chinese Academy of Sciences, alpha-fetoprotein (mAb2 AFP) was prepared by Jiangsu Zecheng Company, and ZEN was purchased from Wuhan NDH Biotechnology Company. Thiol-polyethylene glycol-succinyl imide ester (HS-PEG-NHS, MW 555.6) was obtained from Sigma-Aldrich, and bovine serum albumin (BSA, 66.4 kDa) was acquired from Wuhan Feiyi Technology Co., Ltd. Other reagents of analytical grade were purchased from Sinopharm Group. AFP commercialization test strip card and the material for making test strip card were acquired from Xiamen Boson Biotechnology Co., Ltd. Ultrapure water was obtained from a laboratory pure water meter.
Preparation of gold nanocages (GNCs)
GNCs were prepared by a galvanic replacement reaction of silver nanocubes, as reported previously.37–39 In brief, silver nanocubes (0.5 Ag mg/mL, 10 mL), PVP (55 kDa, 150 mg) and 90 mL of ultrapure water were added into a 250 mL three-necked LFAsk, and heated to 90 °C under vigorous stirring. After 10 mins, chloroauric acid (HAuCl4, 1.0 mmol/L) was added using a two-channel syringe pump (WZ-50C6, Zhejiang Smiths Medical Instrument Co, Ltd, China) at the injection rate of 0.7 mL/min. The localized surface plasmon resonance (LSPR) peak of GNCs was tailored by controlling the molar ratio of silver nanocubes and HAuCl4. When the wavelength of LSPR peak reached 808 nm using a UV/Vis spectrophotometer (TU-1901, Beijing Purkinje General Instrument Co. Ltd, China), the injection of HAuCl4 was immediately stopped, and the solution was stirred for another 5 min at 90 °C. The resultant GNC dispersions were purified by centrifugation (10,000 rpm ×10 min), washed with ammonium hydroxide once, absolute ethyl alcohol twice, and ultrapure water twice. The dispersions of refined GNCs were stored at 4 °C for further use.
Synthesis of antibody-labeled GNCs
As previously reported,38,39 GNCs were modified by thiol-polyethylene glycol-succinyl imide ester (HS-PEG-NHS) for inhibiting non-specific adsorption to antibodies. HS-PEG-NHS (0.5 μL, 100 mg/mL) was added dropwise to the GNC dispersions (500 μL, 0.290 mg Au/mL) and stirred overnight at 4 °C. After a few minutes of ultrasonic dispersion, the reaction mixture was centrifuged (6800 rpm ×30 min) at 4 °C. HS-PEG-NHS modified GNCs were purified and collected by removing the centrifuged supernatant. For conjugation with GNCs, various monoclonal antibodies including mouse IgG, AFP mAb1 antibody (AFP), zearalenone (ZEN) antibody, IgG (20 μL, 2.65 μg/μL), AFP (1.7 μL, 1.0 μg/μL) or ZEN (1.0 μL, 3.2 μg/μL) were added dropwise into the dispersions of HS-PEG-NHS-modified GNCs (500 μL, 0.238 mg Au/mL), and stirred at 4 °C in dark for 12 h. The antibody-conjugated GNCs were purified by centrifuging (6800 rpm ×30 min) at 4 °C and re-dispersing in ultrapure water three times. The refined antibody-conjugated GNCs were stored at 4 °C in the dark for later use.
Characterization
The preparation of GNCs was monitored using a UV/Vis spectrophotometer (Lambda35, PerkinElmer Instruments Co. Ltd, USA) in the wavelength range of 300–900 nm at various reaction times. The gold content in bare GNCs and antibody-GNCs was measured using an inductively coupled plasma source mass spectrometer (ICP-MS, ELAN DRC-e, Perkin-Elmer, USA). The reference solutions with various concentrations (10, 20, 50, and 100 ppb) were prepared using a gold standard solution (GSB04-1715-2004), and the sample solutions were diluted to less than 100 ppb. The morphologies of bare GNCs and antibody-GNCs were characterized using a transmission electron microscope (TEM, 200 kV, Tecnai G2 20, FEI Corp., Netherlands) and a high-resolution transmission electron microscope (HR-TEM, 300 kV, Tecnai G2 F30, FEI Corp, USA) with energy dispersive spectrometer (EDS, X-MaxN 100TLE, Oxford). The samples of bare GNCs and antibody-GNCs were diluted to 25 μg/mL using ultrapure water. After ultrasonic oscillation for 10 mins, 5 μL of the dilution solution was dropped onto a TEM copper grid (carbon film-coated, 300-mesh) and dried at room temperature for TEM and HR-TEM characterization. Atom force microscopy (AFM) characterization was performed in ScanAsyst mode of Nanoscope Multimode 8 (Bruker, Santa Barbara, USA) for investigating the surface appearance of various antibody-GNCs. One drop of GNC dispersions was placed on a freshly cleaved mica piece and then dried at room temperature for AFM characterization. Following ultrasonic oscillation for 5.0 min, the size and zeta potential of antibody-GNCs (0.073 mg/mL), were measured using a dynamic light scattering instrument (DLS, ZetasizerNanoZS90, Malvern Instruments Ltd, UK) equipped with a 4 mW He-Ne laser source (λ=633 nm) with a scattering angle of 90°. To investigate the photothermal effect, test strips were embedded in adiabatic foam and irradiated using an optical fiber-coupled laser source (MDL-808, Changchun New Industries Optoelectronics Tech. Co., Ltd, China) for 2.0 min with different powers (0.5 W, 1.2 W, 2 W). The temperature of GNC dispersions was measured at 15-second intervals using a near-infrared thermal imager (FLIR-E64501, FLIR Systems Inc. USA).
Calorimetric lateral flow assay (CLFA)
The calorimetric lateral flow assay (CLFA) based on GNCs was performed using nitrocellulose strips, a NIR laser source, and an infrared camera. The nitrocellulose strips were divided into five consecutive zones: sample pad, conjugate pad with primary antibodies-modified GNCs (AFP-GNCs and ZEN-GNCs), test line (T-line) immobilized with the second antibodies (monoclonal antibodies of anti-AFP or anti-ZEN), control line (C-line) immobilized with the third antibody (goat-anti- mouse second antibody). Using AFP detection as an example, the assay was initiated by placing the sample pad of CLFA strips into a 96-well plate containing sample solutions (ca. 70 μL), which moved along the strips to absorption pad under capillary force. The analytes in sample solutions were bound to the AFP-GNCs immobilized on a conjugate pad, and the resulting conjugations of AFP-GNCs were further complexed with the second antibody immobilized on T-line. The sandwich complexes on T-line were irradiated with a NIR laser (λ=808 nm, 200 mW) for 2.0 min, and an infrared imaging camera (FLIR-E64501, FLIR Systems Inc. USA) was used for obtaining infrared thermal imaging photographs. To prevent heat loss, The CLFA strips were placed into a foam plastic box under NIR irradiation.
The amount of heat generated by GNCs was calculated using FLIR Tools (the build-in software of infrared image analysis). A series concentration of the AFP (67.23, 22.41, 7.47, 2.49, 0.83, 0.27 ng/mL), or ZEN (0, 5, 10, 20, 40, 80, 160 ng/mL) solutions were prepared with the sampling buffer solution (1%Tween20 and 2%BSA in PBS, pH 7.4). The CLFA strips were immersed into these standard solutions, and the temperature difference before and after NIR irradiation was recorded and normalized to establish the standard curve of AFP or ZEN. For each concentration, three duplicated strips were prepared. Subsequently, the strips were removed from the vials and dried at room temperature for 30 mins. The CLFA based on GNPs was performed with similar chromatographic conditions as GNCs. However, the sandwich GNP complexes on T-line were irradiated for 2.0 min using a NIR laser (200 mW) at the wavelength of 532 nm, the characteristic adsorption peak of GNPs.
Results and discussion
Preparation and characterization of AFP-GNCs
As a promising calorimetric label, GNCs have many advantages over other photothermal agents, such as a well-defined nanostructure and high efficiency of photothermal conversion. The reaction between silver nanocubes and HAuCl4 was used to synthesize GNCs,37–40 and which peaks localized surface long wavelength NIR excitation. Classical galvanic replacement localized surface plasmon resonance (LSPR) was easily tuned to 800 nm wavelength by monitoring with a UV-vis spectrometer (Figure 1A). Subsequently, successful modification with specific antibodies onto GNCs was achieved by using succinyl imide ester conjugation. As seen in TEM photographs (Figure 1B and C), the surface modification had little effect on the structure and properties of GNCs. The characteristic LSPR peak of AFP-GNCs was the same as ca. 800 nm, without any changes (Figure 1A). The element distribution of AFP-GNCs was compared with bare GNCs using energy dispersive spectra (EDS) and element mapping images of carbon, silver, gold, sulfur, oxygen, and nitrogen. In EDS curves, the characteristic EDS peaks of carbon (0.263 keV), oxygen (0.481 keV), gold (2.123, 8.904, 9.704, 11.448 and 13.401 keV) and silver (2.988 keV) were present in AFP-GNCs and bare GNCs. Following AFP conjugation onto GNCs, the carbon content increased from 63.4 wt.% up to 89.0 wt.%, and the weight contents of silver and gold decreased from 18.0 wt.% and 18.6 wt.% to 5.7 wt.% and 6.8 wt.%, respectively. Furthermore, although the signal intensity was very low, the EDS peak of sulfur (2.406 keV) was only observed in the EDS spectra and element distribution images of AFP-GNCs (Figure 1D and Figure S1), confirming the successful conjugation of antibody proteins (AFP, ZEN, or BSA etc.) onto GNCs. The edges of bare GNCs and AFP-GNCs were calculated as 48.4±7.2 nm and 53.8±7.1 nm, respectively, in the TEM photographs (Figure 1B and C). The hydrodynamic diameters of bare GNCs and AFP-GNCs were measured as 106±0.6 nm and 94.5±0.4 nm respectively, and the corresponding zeta potentials were −18.5 mV and −19.1 mV by DLS measurement (Figure 1E). Consistent with the TEM photographs, AFM characterization also indicated that AFP-GNCs exhibited a cubic nanostructure with the edge size of 50–60 nm, and granulated surface compared to the smooth surface of bare GNCs (Figure 1F). These results indicated that the synthesis of GNCs and surface conjugation of various antibodies (the data of ZEN conjugation is not shown) were accomplished successfully in the present work.
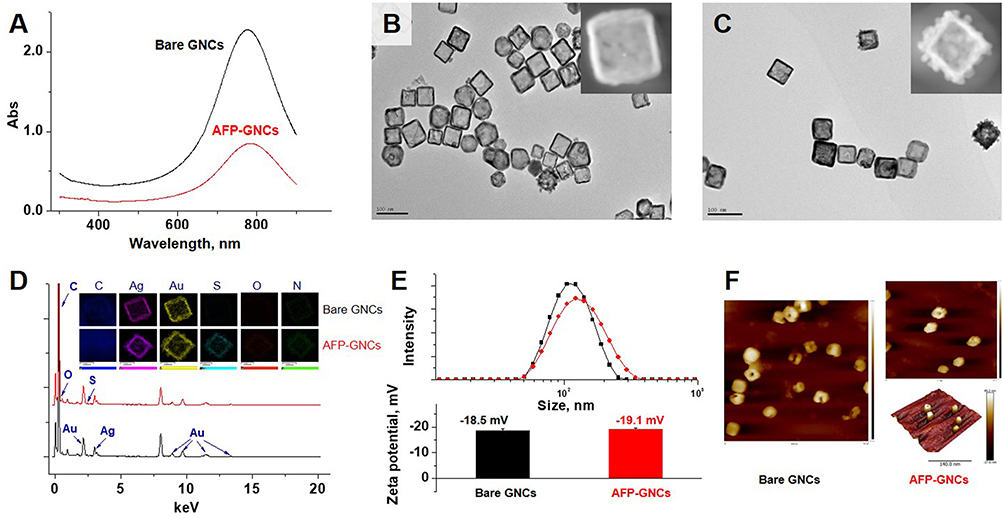 |
Figure 1 Morphology, characterization, and surface modification of AFP-GNCs. (A) the UV-Vis spectra comparison of AFP-GNCs before and after surface modification. (B) and (C) the TEM photographs of bare GNCs and AFP-GNCs, respectively. (D) Energy dispersive spectra (EDS) of AFP-GNCs (red line) and bare GNCs (black line). The inset plots are the element mapping images of AFP-GNCs and bare GNCs. (E) Hydrodynamic diameters and zeta potentials of AFP-GNCs (red) and bare GNCs (black). (F) Atom force microscopy (AFM) characterization of AFP-GNCs and bare GNCs. Abbreviations: GNCs, gold nanocages; GNPs, gold nanoparticles; AFP, alpha-fetoprotein. |
The photothermal effect of AFP-GNCs
Among the photothermal materials (e.g. ICG, polypyrrole/polydopamine, carbon nanotube/graphene, gold nanorods/nanoshells/nanostars) reported so far,41–48 GNCs showed high photothermal conversion efficiency and good stability of photophysical properties. To investigate the influence of antibody modification on the photothermal conversion of GNCs, the heat-generating capabilities of bare GNCs and AFP-GNCs (0.1 mg/mL, 5.0 μL) were compared under 2.0 min of NIR irradiation (λ=808 nm, 100 mW). AFP-GNC dispersions under NIR irradiation showed a temperature increment (ΔT) value of 20.7±0.5 °C, with no difference from that (20.1±0.9 °C) of bare-GNC dispersions (Figure 2A). Furthermore, the photothermal effect of AFP-GNC strips was investigated by NIR-irradiation at the T-line with different powers (0.5, 1.2, and 2.0 W/cm2) post-LFA chromatography. The maximum ΔTs on T-line of AFP-GNC strips increased rapidly to 27.4 °C, 61.5 °C and 90.9 °C after 20 seconds of NIR irradiation with the powers of 0.5, 1.2, and 2.0 W/cm2, respectively (Figure 2B). This indicated that AFP-GNC strips exhibited higher efficiency of photothermal conversion than the GNCs dispersion, enabling CLFA detection with high sensitivity. In contrast to labile photophysical properties (e.g. photobleaching and photothermal attenuation) of other photothermal materials, the AFP-GNC strips showed high stability of ΔTs (from 88.6 °C to 90.9 °C) on T-line in five heating-cooling cycles under NIR irradiation (2.0 W/cm2, 2 min), indicating good reliability and reproducibility of CLFA detection based on GNCs (Figure 2C).
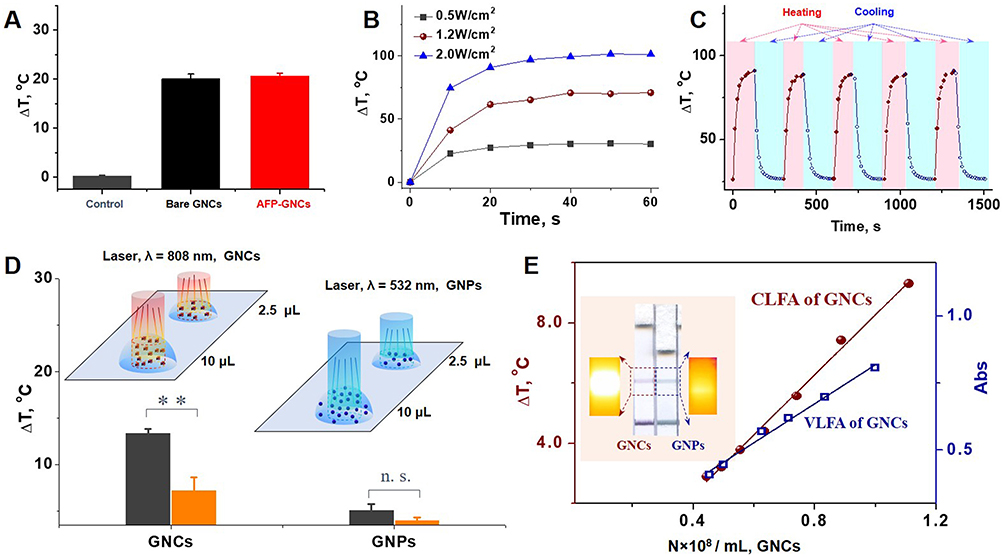 |
Figure 2 Photothermal effect of AFP-GNCs. (A) Comparison of photothermal conversion efficacy of AFP-GNC dispersions with bare GNC dispersions and control solution: the gold contents of AFP-GNCs and bare GNCs were 0.1 mg Au/mL, and the control solution was ultrapure water. (B) Influence of laser power (λ=808 nm) on the photothermal effect of AFP-GNC strips. (C) Stability evaluation of the photothermal conversion ability of AFP-GNC strips: five repeats of heating/cooling curves of AFP-GNCs strips under NIR laser with the power of 2.0 mW/cm2. (D) Photothermal conversion comparison of various volumes of GNCs and GNPs under the NIR laser with the corresponding wavelength (λ=808 nm and 532 nm respectively). (E) Linear dependence on gold contents of signal intensities of GNC-labelled CLFA and GNC-labelled VLFA. Abbreviations: GNCs, gold nanocages; GNPs, gold nanoparticles; CLFA, calorimetric lateral flow assays; VLFA, visual lateral flow assays. |
Since the excitation wavelength of GNCs (λ=700–1000 nm, typically ca. 800 nm) had deeper penetration distance in nitrocellulose membranes than that (λ=532 nm) of GNPs, the photothermal signal generated by GNCs under NIR laser could be detected with ultra-high sensitivity, improving the accuracy of CLFA detection. To investigate the penetration depth of excitation light on photothermal effect, two droplets (2.5 μL and 10 μL) of GNC (or GNP) dispersions (0.058 mg Au/mL) were placed onto a hydrophobic smooth surface, and irradiated by a NIR laser (λ=808 nm for GNCs and λ=532 nm for GNPs, 0.1 W,) for 2 min. There was a significant difference (P<0.01) of ΔT values between the two droplets (2.5 μL and 10 μL) of GNC dispersions, while no difference of ΔT values was detected between the two droplets of GNP dispersions (Figure 2D). This observation confirmed that GNCs could be used as a photothermal label with ultra-high detection accuracy, since their near-infrared LPSR wavelength had deeper penetrating ability than the visible LPSR wavelength of GNPs, resulting in a more sensitive photothermal signal of GNCs. Furthermore, the photothermal effect of GNC strips showed good linear dependence (r2=0.994) on the number of GNC particles in the range of 0.45–1.0×10⁸/mL (Figure 2E). Although VLFA of GNCs also showed the same linear dependence of the calorimetric signal on the GNC number, there was a significant difference of photothermal signal (22.7 °C vs 4.9 °C) between GNCs and GNPs under the same colorimetric signal (the inset picture of Figure 2E).
CLFA with GNC-labeled strips for AFP detection
As an important serum marker of primary liver cancer and some other malignancies, AFP in serum must be rapidly detected with high sensitivity in early diagnosis of liver cancer. We first investigated the CLFA detection limit of GNC strips as compared to VLFA in the AFP concentration range of 0.13–40 ng/mL. The normalized intensities (NI) of CLFA (ΔT) or VLFA (absorbance) signals were used to evaluate the LFA detection sensitivity. As shown in Figure 3A, the NI value of GNC-labeled CLFA strips was 0.11±0.05 (the data point of S1) at 0.25 ng/mL, and the ΔT value reached up to 14.6±0.28 °C (inset plot). Meanwhile, the NI value of the same strips was zero in VLFA detection (the data point of S1) indicating that the T-line of the strips was invisible to the naked eye (inset plot) but could be distinctly identified by the photothermal signal. Moreover, the NI values of CLFA and VLFA increased with the increasing AFP concentration and reached the maximum value at 10 ng/mL (the data point of S2). As the AFP concentration further increased from 10 ng/mL to 40 ng/mL, the NI value of VLFA decreased sharply, resulting from so-called high dose hook effect.49–51 However, the normalized CLFA values decreased slightly in the same range of AFP concentration (10–40 ng/mL). This indicated that the high dose hook effect on detection signal could be effectively inhibited in the CLFA of GNCs, enabling the simplification of the sample processing procedure.
 |
Figure 3 VLFA for AFP detection. (A) Comparison of GNC-labeled CLFA or VLFA strips of AFP detection. (B) The AFP detection of GNC-labeled CLFA with GNC-labeled VLFA or GNP-labeled VLFA. Abbreviations: AFP, alpha-fetoprotein; GNC, gold nanocage; GNP, gold nanoparticle, CLFA, calorimetric lateral flow assays; VLFA, visual lateral flow assays. |
GNC-labeled CLFA or VLFA were further compared to commercial GNP-labeled VLFA strips. The three LFA detection modes showed favorable correlativity (R2>0.99) of normalized value and AFP concentration for quantitative LFA analysis (Figure 3B). The detection sensitivity could be quantitatively evaluated by both parameters, 50% and 20% of maximal normalized intensity concentration (NIC50 and NIC20). Compared to 12.7 ng/mL (NIC20) and 34.2 ng/mL (NIC50) in VLFA, the NIC20 and NIC50 of commercial GNP-labelled strips were calculated respectively as 6.2 ng/mL and 11.5 ng/mL in CLFA, improving the detection sensitivity by 2- to 3-fold. Furthermore, the NIC20 and NIC50 of GNC-labelled CLFA strips were 2.3 ng/mL and 6.8 ng/mL, ca. 5–6 times lower than those of commercial GNP-labelled VLFA strips. These data of NIC20 and NIC50 indicated that CLFA with GNC-labeled strips showed higher detection sensitivity than VLFA with GNP- or GNC-labeled strips. Then AFP clinical serum samples were tested by using CLFA and ELISA methods. As listed in Table 1, the relative errors between the two methods ranged from −3.0% to 7.9%, indicating an acceptable accuracy. These results indicated that CLFA is feasible and reliable for the detection of AFP in real clinical samples.
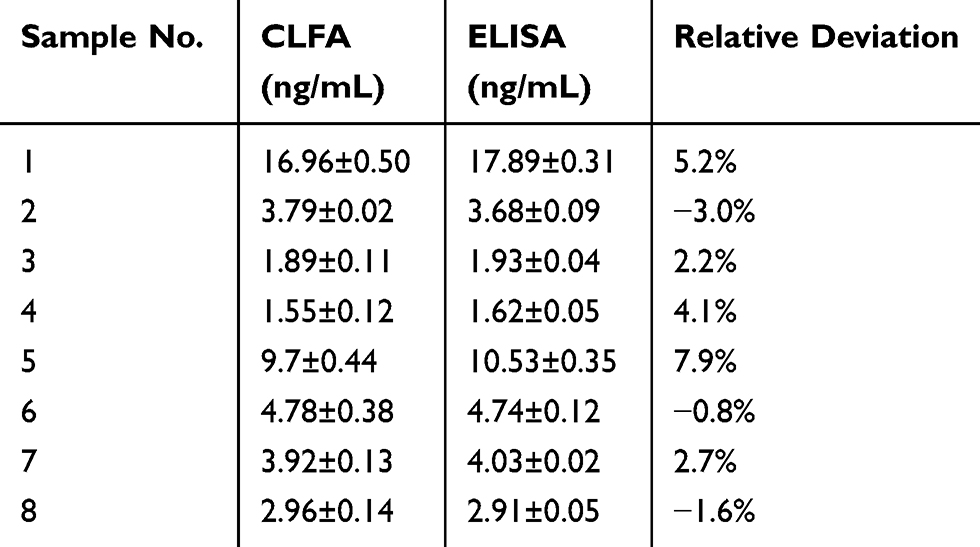 |
Table 1 Assay results of AFP clinical serum samples using the CLFA and ELISA methods (n=3) |
CLFA with GNC-labeled strips for ZEN detection
ZEN, a hazardous mycotoxin that can contaminate various food products, must be detected with simplicity, rapidity, and high efficiency.52–54 In the present study, in contrast to `sandwich format CLFA for AFP detection, we adopted a competitive format CLFA for the quick and highly sensitive detection of ZEN. First, the influence chromatographic time was investigated at normalized intensity (NI) of CLFA (Figure 4A). The NI of GNC-labeled strips increased with chromatographic time and reached the maximum NI (3.5±0.1) at 20 min when the blank solution was added but remained unchanged at 1.0–1.3 when the positive sample (80 ng/mL of ZEN) was added. Moreover, the NI of GNC-labeled strips decreased with the increase of GNC content and achieved a constant NI value (2.7±0.2) at 0.37 µg/mL of GNC content as the blank solution was added (Figure 4B). Although GNC-labeled strips showed higher NI values of 3.7±0.2 and 3.1±0.1 at 0.09 µg/mL and 0.19 μg/mL of GNC contents respectively, their absolute signal intensity (ΔT) was lower than that of 0.37 μg/mL of GNC content, probably reducing the reproducibility of CLFA detection. Furthermore, three disrupting mycotoxins, vomitoxin (DON), aLFAtoxin (AFB1) and insariotoxin (T-2), were used to investigate ZEN detection specificity of CLFA with GNC-labeled strips (Figure 4C). Their NIs in CLFA detection remained unchanged (ca. 2.7–2.84, 1000 ppb) as that of the blank solution (2.8±0.2) However, the NI in CLFA detection of ZEN significantly decreased to ca. 0.5±0.02 (120 ppb) showing high specificity of CLFA with GNC-labeled strips. Finally, the quantitative relation between ZEN concentration and CLFA signal NI value was evaluated in the range of 2.0–1000 ng/mL, which showed favorable correlativity (R2>0.99) (Figure 4D). The recovery of CLFA with GNC-labeled strips was investigated to evaluate the accuracy of ZEN detection and found to be 82–115%, and the coefficient of variation (CV%) was 1.9, 2.0, 0.9, 0.3, 3.7, 0.6, 2.3, 2.7, 2.4, 4.6 respectively, indicating good accuracy of CLFA with GNC-labeled strips in ZEN detection.
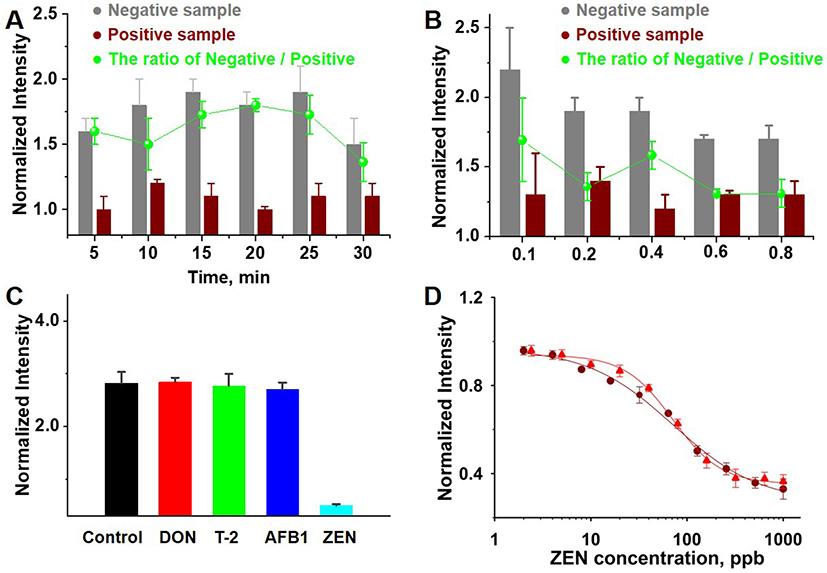 |
Figure 4 Systematic evaluation of GNC-labelled CLFA strips for rapid detection of ZEN. (A) and (B): influence of chromatographic time and GNC content on CLFA signal intensity, respectively. Normalized CLFA signal intensity of negative sample (gray), positive sample (red), and the ratio of the both (green). (C) and (D): Qualitative specificity and quantitative accuracy of GNC-labelled CLFA strips for ZEN detection, respectively. Abbreviations: ZEN, zearalenone; DON, vomitoxin; T-2, insariotoxin; AFB1, aLFAtoxin. |
Conclusion
GNCs were used as a CLFA label due to their high photothermal conversion efficiency, good stability of photophysical properties, and stronger penetrating ability of NIR light. Compared to the conventional VLFA and GNP-labeled CLFA test strips, the GNC-labelled CLFA test strip was highly advantageous in rapid LFA detection with high sensitivity, qualitative specificity, and quantitative accuracy. For AFP detection using sandwich format GNC-labeled CLFA, the detection limit (NI =0.11±0.05) reached 0.25 ng/mL, while the NI value in VLFA was zero at the same concentration. Compared to the detection sensitivity of commercial GNP-labeled VLFA strips, GNC-labeled CLFA showed the lowest NIC20 (2.3 ng/mL) and NIC50 (6.8 ng/mL) in GNP-/GNC-labeled CLFA and VLFA, increasing by ca. 5–6 times. The competitive format GNC-labeled CLFA was used to investigate highly sensitive and specific detection of small molecular toxins such as ZEN and showed high sensitivity and specificity following optimization of the test parameters (chromatographic time and GNC content). The NIs of CLFA detection on vomitoxin (DON), aLFAtoxin (AFB1) and insariotoxin (T-2), remained unchanged (ca. 2.7–2.84, 1000 ppb), but the NI of ZEN significantly decreased to ca. 0.5±0.02 (120 ppb). Furthermore, the competitive format CLFA detection of ZEN showed high correlativity (R2>0.99) and favorable recovery (82–115%). These results indicated that GNC-label ed CLFA is a promising detection method for improving sensitivity and precision.
Acknowledgment
This work was supported by National Natural Science Foundation of China (grant Nos. 81673016 and 81773653), Shenzhen Science and Technology Innovation Foundation (grant No. JCYJ 20170307154436878) and National Basic Research Program of China (973 Program, grant No. 2015CB931802). We thank the Analysis and Test Center of HUST and School of Maters Engineering of HUST for related analysis.
Disclosure
Jiangshan Wan, Xiaole Peng, and Liyi Mai were employed by the C. Consum Pharmaceutical Group at the time of the study. The authors report no other conflicts of interest in this work.
References
1. Luppa PB, Müller C, Schlichtiger A, et al. Point-of-care testing (POCT): current techniques and future perspectives. TrAC-Trends Anal Chem. 2011;30(6):887–898. doi:10.1016/j.trac.2011.01.019
2. Raeisossadati MJ, Danesh MN, Borna F, et al. Lateral flow based immunobiosensors for detection of food contaminants. Biosens Bioelectron. 2016;86:235–246. doi:10.1016/j.bios.2016.06.061
3. Zhong YH, Chen YJ, Yao L, et al. Gold nanoparticles based lateral flow immunoassay with largely amplified sensitivity for rapid melamine screening. Microchim Acta. 2016;183(6):1989–1994. doi:10.1007/s00604-016-1812-9
4. Wang XK, Choi N, Cheng ZY, et al. Simultaneous detection of dual nucleic acids using a SERS-based lateral flow assay biosensor. Anal Chem. 2017;89(2):1163–1169. doi:10.1021/acs.analchem.6b03536
5. Fu XL, Cheng ZY, Yu JM, et al. A SERS-based lateral flow assay biosensor for highly sensitive detection of HIV-1 DNA. Biosens Bioelectron. 2016;78:530–537. doi:10.1016/j.bios.2015.11.099
6. Yao YY, Guo WS, Zhang J, et al. Reverse fluorescence enhancement and colorimetric bimodal signal readout immunochromatography test strip for ultrasensitive large-scale screening and postoperative monitoring. ACS Appl Mater Interfaces. 2016;8(35):22963–22970. doi:10.1021/acsami.6b08445
7. Qin CY, Gao Y, Wen W, et al. Visual multiple recognition of protein biomarkers based on an array of aptamer modified gold nanoparticles in biocomputing to strip biosensor logic operations. Biosens Bioelectron. 2016;79:522–530. doi:10.1016/j.bios.2015.12.096
8. Mirasoli M, Guardigli M, Michelini E, Roda A. Recent advancements in chemical luminescence-based lab-on-chip and microfluidic platforms for bioanalysis. J Pharm Biomed Anal. 2014;87:36–52. doi:10.1016/j.jpba.2013.07.008
9. Huang XL, Aguilar ZP, Xu HY, et al. Membrane-based lateral flow immunochromatographic strip with nanoparticles as reporters for detection: a review. Biosens Bioelectron. 2016;75:166–180. doi:10.1016/j.bios.2015.08.032
10. Mirasoli M, Buragina A, Dolci LS, et al. Development of a chemiluminescence-based quantitative lateral flow immunoassay for on-field detection of 2,4,6-trinitrotoluene. Anal Chim Acta. 2012;721:167–172. doi:10.1016/j.aca.2012.01.036
11. Chen YP, Sun JS, Xianyu YL, et al. A dual-readout chemiluminescent-gold lateral flow test for multiplex and ultrasensitive detection of disease biomarkers in real samples. Nanoscale. 2016;8(33):15205–15212. doi:10.1039/c6nr04017a
12. Nobel J, Attree S, Horgan A, et al. Optical scattering artifacts observed in the development of multiplexed surface enhanced raman spectroscopy nanotag immunoassays. Anal Chem. 2012;84(19):8246–8252. doi:10.1021/ac301566k
13. Newman JD, Turner APF. Home blood glucose biosensors: a commercial perspective. Biosens Bioelectron. 2005;20:2435–2453. doi:10.1016/j.bios.2004.11.012
14. Du D, Wang J, Wang LM, et al. Integrated lateral flow test strip with electrochemical sensor for quantification of phosphorylated cholinesterase: biomarker of exposure to organophosphorus agents. Anal Chem. 2012;84(3):1380–1385. doi:10.1021/ac202391w
15. Sandhu A, Handa H, Abe M. Synthesis and applications of magnetic nanoparticles for biorecognition and point of care medical diagnostics. Nanotechnology. 2010;21:442001. doi:10.1088/0957-4484/21/44/442001
16. Huang WC, Wu KH, Wu HC, et al. Magnetic nanoparticle-based lateral flow immunochromatographic strip as a reporter for rapid detection of melamine. J Nanosci Nanotechnol. 2018;18:7190–7196. doi:10.1166/jnn.2018.16020
17. Wang DB, Tian B, Zhang ZP, et al. Rapid detection of bacillus anthracis spores using a super-paramagnetic lateral-flow immunological detection system. Biosens Bioelectron. 2013;42:661–667. doi:10.1016/j.bios.2012.10.088
18. Zheng C, Wang XC, Lu Y, Liu Y. Rapid detection of fish major allergen parvalbumin using superparamagnetic nanoparticle-based lateral flow immunoassay. Food Control. 2012;26:446–452. doi:10.1016/j.foodcont.2012.01.040
19. Gas F, Baus B, Queré J, Chapelle A, Dreanno C. Rapid detection and quantification of the Marine toxic Algae, Alexandrium Minutum, using a super-paramagnetic immunochromatographic strip test. Talanta. 2016;147:581–589. doi:10.1016/j.talanta.2015.10.036
20. Quesada-González D, Merkoçi A. Nanoparticle-based lateral flow biosensors. Biosens Bioelectron. 2015;73:47–63. doi:10.1016/j.bios.2015.05.050
21. Clark LC
22. Ju Q, Noor MO, Krull UJ. Paper-based biodetection using luminescent nanoparticles. Analyst. 2016;141(10):2838–2860. doi:10.1039/c6an00129g
23. Bahadır EB, Sezgintürk MK. Lateral flow assays: principles, designs and labels. Trac-Trends Anal Chem. 2016;82:286–306. doi:10.1016/j.trac.2016.06.006
24. Sperling RA, Gil PR, Zhang F, Zanella M, Parak WJ. Biological applications of gold nanoparticles. Chem Soc Rev. 2008;37(9):1896–1908. doi:10.1039/b712170a
25. Giljohann DA, Seferos DS, Daniel WL, et al. ChemInform abstract: gold nanoparticles for biology and medicine. Angew Chem Int Ed. 2010;49(19):3280–3294. doi:10.1002/anie.200904359
26. Dykman L, Khlebtsov N. Gold nanoparticles in biomedical applications: recent advances and perspectives. Chem Soc Rev. 2012;41(6):2256–2282. doi:10.1039/c1cs15166e
27. Dreaden EC, Alkilany AM, Huang XH, et al. The golden age: gold nanoparticles for biomedicine. Chem Soc Rev. 2012;41(7):2704–2779.
28. Choi JR, Liu Z, Hu J, et al. Polydimethylsiloxane-paper hybrid lateral flow assay for highly sensitive point-of-care nucleic acid testing. Anal Chem. 2016;88(12):6254–6264. doi:10.1021/acs.analchem.6b00195
29. Shi CG, Deng N, Liang JJ, et al. A fluorescent polymer dots positive readout fluorescent quenching lateral flow sensor for ractopamine rapid detection. Anal Chim Acta. 2015;854:202–208. doi:10.1016/j.aca.2014.11.005
30. Liang RL, Xu XP, Liu TC, et al. Rapid and sensitive lateral flow immunoassay method for determining alpha fetoprotein in serum using europium (III) chelate microparticles-based lateral flow test strips. Anal Chim Acta. 2015;891:277–283. doi:10.1016/j.aca.2015.07.053
31. Park S, Taton TA, Mirkin CA, et al. Array-based electrical detection of DNA with nanoparticle probes. Science. 2002;295(5559):1053–1056.
32. Hao MJ, Ma ZF. An ultrasensitive chemiluminescence biosensor for carcinoembryonic antigen based on autocatalytic enlargement of immunogold nanoprobes. Sensors. 2012;12(12):17320–17329. doi:10.3390/s121217320
33. Liu YM, Peng XL, Qian K, et al. Temperature sensitive p(N-isopropylacrylamide co-acrylic acid) modified gold nanoparticles for trans-arterial embolization and angiography. J Mater Chem B. 2017;5:907–916. doi:10.1039/C6TB02383E
34. Ma YY, Wan JS, Qian K, et al. The studies on highly concentrated complex dispersions of gold nanoparticles and temperature sensitive nanogels and their application as new blood-vessel-embolic materials with high resolution angiography. J Mater Chem B. 2014;2:6044–6053. doi:10.1039/C4TB00748D
35. Wang YR, Qin ZP, Boulware DR, et al. Thermal contrast amplification reader yielding 8-fold analytical improvement for disease detection with lateral flow assays. Anal Chem. 2016;88(23):11774–11782. doi:10.1021/acs.analchem.6b03406
36. Qin ZP, Chan WCW, Boulware DR, et al. Significantly improved analytical sensitivity of lateral flow immunoassays by using thermal contrast. Angew Chem Int Ed. 2012;51(18):4358–4361. doi:10.1002/anie.201200997
37. Skrabalak SE, Chen JY, Sun YG, et al. Gold nanocages: synthesis, properties, and applications. Acc Chem Res. 2008;41(12):1587–1595. doi:10.1021/ar800018v
38. Chen JY, Wiley B, Li ZY, et al. Gold nanocages: engineering their structure for biomedical applications. Adv Mater. 2005;17(18):2255–2261. doi:10.1002/adma.200500833
39. Kim CH, Cho EC, Chen JY, et al. In vivo molecular photoacoustic tomography of melanomas targeted by bioconjugated gold nanocages. ACS Nano. 2010;4(8):4559–4564. doi:10.1021/nn100736c
40. Wan JS, Geng SN, Zhao H, et al. Precise synchronization of hyperthermia-chemotherapy: photothermally induced on-demand release from injectable hydrogels of gold nanocages. Nanoscale. 2018;10(42):20020–20032. doi:10.1039/c8nr06851h
41. Zheng MB, Yue CX, Ma YF, et al. Single-step assembly of DOX/ICG loaded lipid- polymer nanoparticles for highly effective chemo-photothermal combination therapy. ACS Nano. 2013;7(3):2056–2067. doi:10.1021/nn400334y
42. Yang K, Xu H, Cheng L, et al. In vitro and in vivo near-infrared photothermal therapy of cancer using polypyrrole organic nanoparticles. Adv Mater. 2012;24(41):5586–5592. doi:10.1002/adma.201202625
43. Lin LS, Cong ZX, Cao JB, et al. Multifunctional Fe3O4@polydopamine core-shell nanocomposites for intracellular mRNA detection and imaging-guided photothermal therapy. ACS Nano. 2014;8(4):3876–3883. doi:10.1021/nn500722y
44. Berber S, K YK, Tomanek D. Unusually high thermal conductivity of carbon nanotubes. Phys Rev Lett. 2000;84(20):4613–4616. doi:10.1103/PhysRevLett.84.4613
45. Balandin AA, Ghosh S, Bao WZ, et al. Superior thermal conductivity of single-layer graphene. Nano Lett. 2008;8(3):902–907. doi:10.1021/nl0731872
46. Juste JP, Santos IP, Marzan LML, et al. Gold nanorods: synthesis, characterization and applications. Coordin Chem Rev. 2005;249(17–18):1870–1901. doi:10.1016/j.ccr.2005.01.030
47. Gobin AM, Lee MH, Halas NJ, et al. Near-infrared resonant nanoshells for combined optical imaging and photethermal cancer therapy. Nano Lett. 2007;7(7):1929–1934. doi:10.1021/nl070610y
48. Yuan H, Fales AM, Dinh TV. TAT peptide-functionalized gold nanostars: enhanced intracellular delivery and efficient NIR photothermal therapy using ultralow irradiance. J Am Chem Soc. 2012;134(28):11358–11361. doi:10.1021/ja304180y
49. Rey EG, O’Dell D, Mehta S, et al. Mitigating the hook effect in lateral flow sandwich immunoassays using real-time reaction kinetics. Anal Chem. 2017;89:5095–5100. doi:10.1021/acs.analchem.7b00638
50. Fernando SA, Sportsman JR, Wilson GS. Studies of the low dose ‘hook’ effect in a competitive homogeneous immunoassay. J Immunol Methods. 1992;151(1–2):27–46. doi:10.1016/0022-1759(92)90103-z
51. Fermando SA, Sportsman JR, Wilson GS. Studies of the ‘hook’ effect in the one-step sandwich immunoassay. J Immunol Methods. 1992;151(1–2):47–66. doi:10.1016/0022-1759(92)90104-2
52. Niazi S, Wang XL, Pasha I, et al. A novel bioassay based on aptamer-functionalized magnetic nanoparticle for the detection of zearalenone using time resolvedo-fluorescence NaYF4: Ce/Tb nanoparticles as signal probe. Talanta. 2018;186:97–103. doi:10.1016/j.talanta.2018.04.013
53. Weiss R, Freudenschuss M, Krska R, et al. Improving methods of analysis for mycotoxins: molecularly imprinted polymers for deoxynivalenol and zearalenone. Food Addit Contam. 2003;20(4):386–395. doi:10.1080/0265203031000065827
54. Wu SJ, Liu LH, Duan N, et al. Aptamer-based lateral flow test strip for rapid detection of zearalenone in corn samples. J Agric Food Chem. 2018;66(8):1949–1954. doi:10.1021/acs.jafc.7b05326
 © 2019 The Author(s). This work is published and licensed by Dove Medical Press Limited. The
full terms of this license are available at https://www.dovepress.com/terms
and incorporate the Creative Commons Attribution
- Non Commercial (unported, 3.0) License.
By accessing the work you hereby accept the Terms. Non-commercial uses of the work are permitted
without any further permission from Dove Medical Press Limited, provided the work is properly
attributed. For permission for commercial use of this work, please see paragraphs 4.2 and 5 of our Terms.
© 2019 The Author(s). This work is published and licensed by Dove Medical Press Limited. The
full terms of this license are available at https://www.dovepress.com/terms
and incorporate the Creative Commons Attribution
- Non Commercial (unported, 3.0) License.
By accessing the work you hereby accept the Terms. Non-commercial uses of the work are permitted
without any further permission from Dove Medical Press Limited, provided the work is properly
attributed. For permission for commercial use of this work, please see paragraphs 4.2 and 5 of our Terms.