Back to Journals » OncoTargets and Therapy » Volume 12
C-terminal of E1A binding protein 1 enhances the migration of gastric epithelial cells and has a clinicopathologic significance in human gastric carcinoma
Authors Wang C, Wang M, Xing B, Chi Z, Wang H, Lie C, Dong H
Received 30 January 2019
Accepted for publication 31 May 2019
Published 2 July 2019 Volume 2019:12 Pages 5189—5200
DOI https://doi.org/10.2147/OTT.S203479
Checked for plagiarism Yes
Review by Single anonymous peer review
Peer reviewer comments 2
Editor who approved publication: Dr Carlos E Vigil
This paper has been retracted.
Can Wang, 1 Min Wang, 2 Bocheng Xing, 1 Zhaocheng Chi, 1 Hongyu Wang, 3 Chunxiao Lie, 1 Han Dong 4
1Second Department of Gastrointestinal Surgery, Jilin Provincial Cancer Hospital, Changchun, Jilin 130012, People’s Republic of China; 2Department of Pathology, Jilin Provincial Cancer Hospital, Changchun 130012, People’s Republic of China; 3Internal Medicine of Abdominal Tumors, Jilin Provincial Cancer Hospital, Changchun 130012, People’s Republic of China; 4Department of Geriatric Medicine, First Hospital of Jilin University, Changchun, Jilin 130012, People’s Republic of China
Background: Recent studies have claimed that the C-terminal of E1A binding proteins (CtBPs) influence tumorigenesis through participating in cell signal transduction in various human tumors. However, the detailed expression profiles of CtBP isoforms in human gastric cancer (GC) and the molecular mechanisms of CtBP involvement in tumor cell phenotypes warrant further investigation.
Materials and methods: The expression of CtBPs in GC cell lines and a human gastric epithelial cell line were explored via RT-qPCR and Western blotting assays. Moreover, the expression profiles of CtBPs in GC and histologically noncancerous tissues were explored by immunohistochemistry. To explore the effects of CtBP1 on the metastatic phenotype in GC, gastric epithelial cells were transfected with a eukaryotic expression plasmid to overexpress CTBP1, and the endogenous CtBP1 or JAK1 in GC cells was silenced through an RNA interference (RNAi) method. These transfections were validated via Western blotting, and the activation state of the JAK1/Stat3 signaling pathway was also explored via Western blotting. Furthermore, the malignant phenotype of GC cells was evaluated via a Cell Counting Kit-8 (CCK8) assay, colony formation assay, transwell assay, and wound-healing experiment.
Results: Our data revealed that the expression of CtBP1, but not CTBP2, was upregulated in 102 GC tissue samples compared with 98 noncancerous tissue samples, and the elevated expression level of CtBP1 was notably associated with distant metastasis. CTBP1 modulated cell migration and invasion through the JAK1/Stat3 signaling pathway in gastric epithelial cells. In addition, genetic silence of CtBP1 expression in GC cells notably constrained cell proliferation, invasion and migration abilities through inhibiting the activation of the JAK1/Stat3 pathway in GC cells.
Conclusion: Our data reveal that the knockout of CtBP1 notably constrains distant metastasis in GC through the JAK1/Stat3 pathway, suggesting that targeting CtBP1 is a practical anti-tumor approach to restrain tumor progression in GC.
Keywords: C-terminus of the E1A binding proteins, Janus Kinase 1, signal transducer and activator of transcription 3, gastric cancer
Introduction
The main reason for the poor prognosis of gastric cancer (GC) is metastasis and recurrence, and the overall 5-year survival rate is less than less than 20–25% in the USA, Europe, and China.1–3 To date, restraining the recurrence and metastasis of GC has proven to be a limiting point in the therapy of this disease; once tumors progress to the metastatic stage, there are currently no feasible and efficient therapies.4 The C-terminal of E1A binding protein (CtBP) was originally identified based on its ability to bind the carboxyl terminus of the adenovirus E1A oncoprotein.5 As a corepressor, CtBP binds to transcription factors (and E1A) through a conserved PXDLS peptide motif to carry out its function.6 CtBPs are genetically coded from two DNA fragments; the mRNA products of CtBPs are spliced at their 5ʹ ends to generate two protein isoforms, CTBP1 and CTBP2.7 CtBPs are expressed at high levels during development and participate in axial patterning, cellular proliferation, and differentiation within many organs, including the eyes, heart, brain, placenta vasculature, and muscles.8 Genetically engineered mutations in CtBPs have adverse consequences on the development of organs/tissues, confirming the role of CtBPs as critical regulators of organogenesis and tissue morphogenesis.9,10 For example, CtBP2-null mice are embryonic lethal and often exhibit axial truncations, heart defects, and incomplete neural development11,12 .
Recently, CtBPs were revealed to be transcriptional corepressors that interact with certain DNA-binding transcription factors to implement various functions in both developmental and oncogenic processes.13 The importance of the CtBP corepressor complex in multiple developmental programs suggests that the overexpression of CtBPs in adult tissues could play a role in both tumorigenesis and tumor progression.10 Knockout- and gain-of-function studies have confirmed that CtBPs are regulators of sequence-specific DNA-binding transcription factors that control segmentation, the epithelial-mesenchymal transition (EMT), and apoptosis.14–16 Tumorigenic cells frequently exhibit a more embryonic phenotype than normal cells, having been reprogrammed to activate survival, proliferation, and other cancer hallmark pathways, suggesting that inhibiting developmental transcriptional pathways in cancerous tissue may be an effective therapeutic approach.8 In addition to being overexpressed, CtBP can also be hyperactivated in cancer cells through other means.17 Target proteins regulated by CtBP have been revealed through detection of certain CtBP-binding transcription factors that can bind CtBP at its gene promoters.18,19 In this regard, it has been observed that the expression level of E-cadherin, which is well accepted as a cell adhesion gene, is suppressed by CtBP through the binding of CtBP with zinc-finger E-box-binding homeobox (ZEB), revealing the potential molecular mechanism for CtBP-mediated metastasis.20
Previous data have revealed that CtBP has conspicuous amino acid sequence homology with NADH-dependent dehydrogenases, and it is well known that tumor cells frequently have elevated NADH levels due to NADH production under hypoxic and pseudohypoxia conditions.21–23 Recent reports have revealed that NADH can bind to CtBP with high affinity, leading to a structural alteration in CtBP that enables its interaction with transcriptional repressors.24–26 A recent study demonstrated that high NADH levels under hypoxic conditions are involved in a reduction in E-cadherin transcription in tumors, leading to the oncogenic action of CtBP in vivo.27 These properties provide a unique opportunity for cancer-specific therapy that potentially spares normal tissues. However, at present, there is no report on the impact of CtBPs on tumorigenesis in a specific human malignancy, GC. Hence, the objective of this study was to detect the expression profiles of CtBPs and the molecular mechanisms of the role of CtBPs in the malignant phenotype in GC.
Materials and methods
RNA extraction and quantitative real-time PCR (qRT-PCR)
Total RNA was isolated from cultured cells using TRIzol reagent (Thermo Fisher, Wilmington, DE, USA). First-strand cDNA for CTBP1 was synthesized using a High Capacity Reverse Transcription System Kit (Takara, Dalian, China).
Then, qPCRs were performed using a Universal SYBR Green PCR Kit (Takara) and ran on an ABI 7500 Real-Time PCR System (Applied Biosystems, Foster City, CA, USA). The results were assessed with the 2-ΔΔCt method using GAPDH or U6 small RNA as the housekeeping gene for normalization of CTBP1 expression. The qRT-PCR primers included primers for CTBP1 (sense primer, 5′-CGCCAGTGACCAGTTGTAGC-3′, antisense primer, 5′-CGTGATGATGCCGTCTTCA-3ʹ), CTBP2 (sense primer, 5′-ATCCACGAGAAGGTTCTAAACGA-3′, antisense primer: 5′-CCGCACGATCACTCTCAGG-3′) and β-actin (sense primer, 5′-GCACCACACCTTCTACAATGAG-3′, antisense primer, 5′-ACAGCCTGGATGGCTACGT-3′).
Western blotting
The protein in supernatant was extracted and quantified using bicinchoninic acid (BCA) Protein Assay Kit (Pierce Chemical Co., Rockford, Illinois, USA). Equal amounts of protein (thirty micrograms) were denatured at 98 °C for 5 min and were separated via10% SDS-PAGE gel and electro transferred to nitrocellulose membrane (Millipore, Temecula, California, USA). Next, the membranes were blocked overnight at 4 °C with 5% non-fat milk power, probed with the following primary antibodies at 37 °C for 2 h: Rabbit anti-human CTBP1(#8684), rabbit anti-human CTBP2 (#13,256), Rabbit anti-human phospho-Stat3 (#9145), rabbit anti-human Stat3(#12,640), rabbit anti-human phospho-JAK1 (#74129), rabbit anti-human JAK1 (#29,261) were purchased from Cell Signaling Technology (Boston, USA), and mouse anti-human β-actin (ab8227) were purchased from Abcam (Massachusetts, US). After washing, the membranes were further incubated with horseradish peroxidase (HRP)-conjugated secondary antibodies (Cell Signaling Technology, Inc, Danvers, MA, USA) at a 1:1000 dilution for another 2 h. Finally, the protein binds were visualized using ECL kit (Biorobot, Shanghai, China) on Bio-Rad ChemiDoc MP imaging system (Bio-Rad Laboratories, Hercules, CA, USA).
Patients and tissue specimens
Our research was performed with the approval of the Research Ethics Committee of First Hospital of Jilin University. The participants signed written informed consent prior this research. Tissues were gathered from 102 patients who underwent surgical resection at First Hospital of Jilin University between January 2005 and June 2012. The patients were chosen on account of the following principles: pathological diagnosis of GC; no prior or second tumor; no history of chemotherapy and radiotherapy. All excised tissues were immediately frozen in liquid nitrogen and stored at −80 °C for the following study. The clinicopathologic parameters of GC patients, containing age, gender, distant metastasis, and TNM stage, were summarized and shown as Table 1. Histologically non-cancerous gastric tissue was gained from 98 gastritis patients with an average age of 55 years including 52 men and 46 women treated at First Hospital of Jilin University between January 2007 and October 2013.
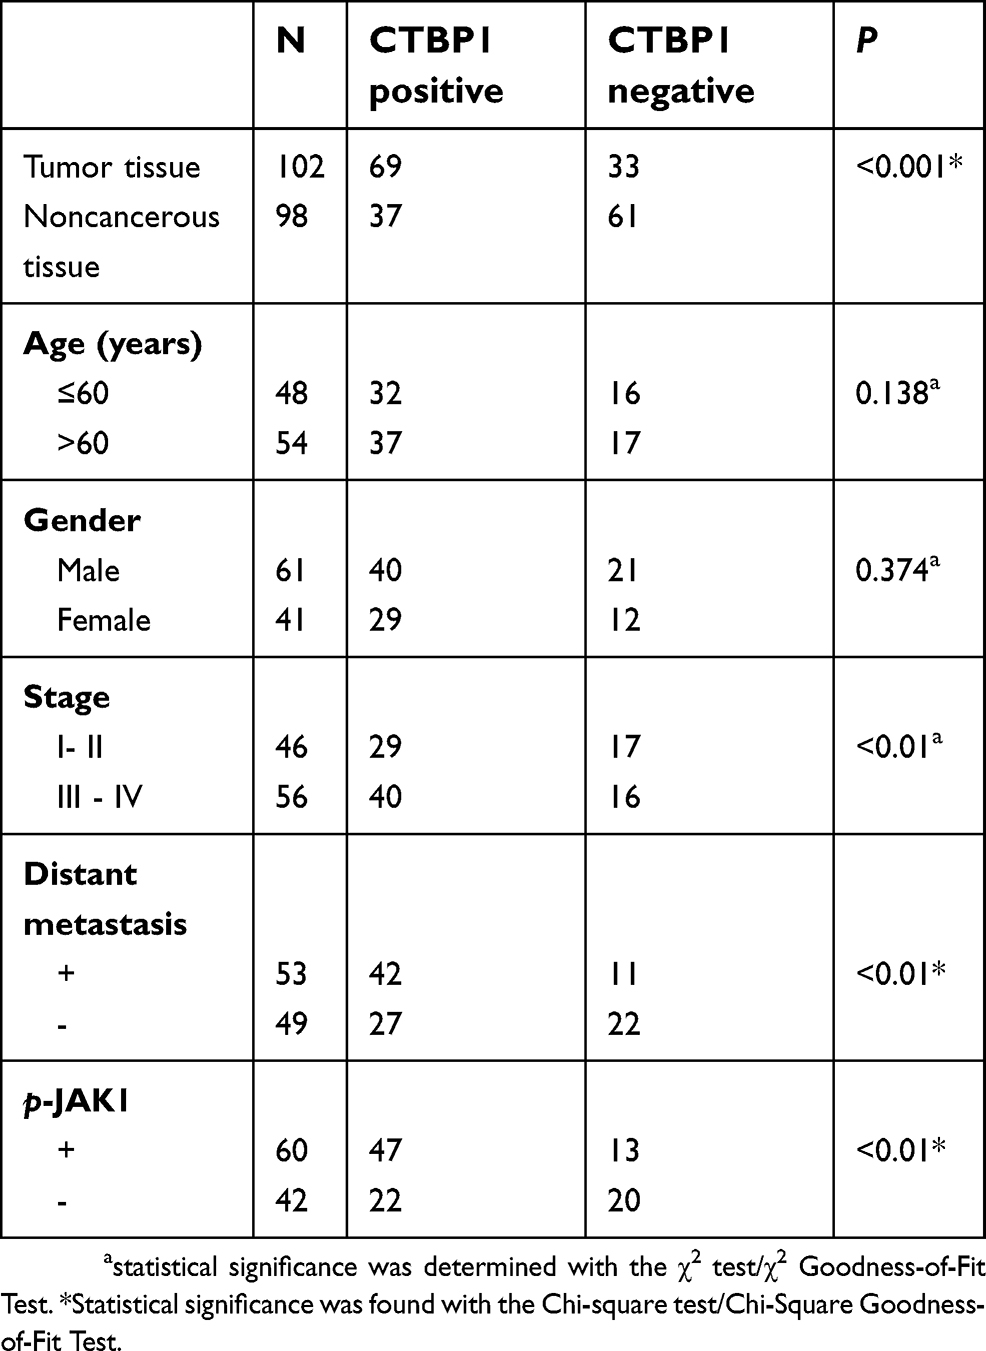 |
Table 1 Expression of CTBP1 and clinicopathological characteristics in GC patients |
Immunohistochemistry
An immunohistochemistry assay was carried out as described previously,28 and the antibodies used were rabbit anti-human CTBP1 and p-JAK1 antibodies. The negative control was incubated with isotype antibodies at the same dilution as the CTBP1 and p-JAK1 antibodies. Expression of CTBP1 and p-JAK1 in the cell nucleus was taken as positive. Staining was assessed, and scoring of CtBP and p-JAK1 protein expression levels was classified semi quantitatively based on the total combined percentage of positively stained tumor cells and the staining intensity, as previously described.29 Afterwards, all patients who underwent surgery or adjuvant chemotherapy were followed for up to 5 years on an outpatient basis or through telephone interviews to confirm the living status of each patient for 5-year Kaplan-Meier survival analysis. Patients who died due to diseases other than GC were excluded from the present study.
Cell culture and transfection
Human GC cell lines (BGC-823、SGC-790、MKN-4、MKN45) and a human gastric epithelial cell line (GES-1) were purchased from the Institute of Basic Medical Sciences, Chinese Academy of Medical Sciences (Beijing, China). All cells were cultured in RPMI 1640 medium (Gibco, Carlsbad, CA, USA) containing 10% fetal bovine serum (FBS, Gibco) at 37 °C in a humidified atmosphere of 5% CO2. The full-length fragments of CTBP1 were inserted into a pNSE-IRES2-EGFP-C1 vector to generate a CTBP1 overexpression plasmid (constructed and amplified by KeyGEN BioTECH), with empty pNSE-IRES2-EGFP-C1 vectors serving as a negative control (vector). GES-1 cells were seeded into 6-well plates at a density of 1.2×10⁵ cells/well, followed by transfected with the above products with Lipofectamine 2000 reagent (Invitrogen, Carlsbad, CA, USA), and G418 (Sigma, St. Louis, MO, USA)-resistant clones were expanded in culture as a monoclonal population.
Cell counting kit-8 (CCK8) assay
Cells were seeded at a density of 3×10⁵ cells/well into 96-well plates in triplicate and cultured at 37 °C overnight in an incubator. A growth curve was drawn based on the growth every 12 h over 4 days as analyzed via a colorimetric water-soluble tetrazolium salt kit (CCK-8; Dojindo Molecular Technologies, Inc., Kumamoto, Japan) in accordance with the manufacturer’s protocol.
Colony formation assays under 2D culture conditions
Colony formation assays were carried out as described previously.28 Cells were maintained in 60-mm cell dishes at a density of 600 cells per dish until visible colonies were formed.
Transwell chamber method
Cell migration and invasion ability was evaluated using Transwell chambers (BD Biosciences, San JGCe, CA, USA) in 24-well plates. Briefly, SGC-790 and GES-1 cells supplemented with serum-free medium were added into the upper chambers. The bottom chambers were filled with complete medium containing 10% FBS. Approximately 16 h after incubation, the cells on the basal side of the membrane were fixed and stained with hematoxylin (Sigma, St. Louis, USA); then, the migrating and invading cells were counted in three random visual fields using a microscope (Olympus, Tokyo, Japan).
Wound-healing assay
Cells were cultured as a monolayer in RPMI 1640 medium (Gibco, Carlsbad, CA, USA) containing 10% FBS (Gibco) at 37 °C to 60% confluence in 6-well dishes (Costar, Corning, Cambridge, MA). Then, the monolayer was scratched using a 20-μl pipette tip and washed 3 times with PBS. The scratches were imaged in the same field of view at 0, 12 and 24 h with a light microscope (E100; Nikon Corporation; magnification, 200x).
RNA interference (RNAi) method
The GC cells with CTBP1 or JAK1 silencing was established via an RNA interference (RNAi) method, the pGCSIL-CTBP1-RNAi or pGCSIL-JAK1 -RNAi plasmid was used to silence the expression of CTBP1 or JAK1 in GC cell line SGC-790, and the pGCSIL-scramble plasmid was used as negative control. The pGCSIL-CTBP1-RNAi, pGCSIL-JAK1 -RNAi, pGCSIL-scramble, pGCSIL-green fluorescent protein (GFP), VSVG expression plasmid, virion-packaging elements (pHelper 1.0), and frozen glycerol bacterial stocks were purchased from Shanghai GenePharma Biotech Co., Ltd. (Shanghai, China). The process of cell transfection was the same as described previously.30
Statistical methods
All experiments were independently performed at least three times. The data are presented as the mean ± standard deviation (SD). The statistical significance of differences between groups was assessed by Student’s t-test or ANOVA using SPSS 20.0 software (SPSS, Inc., Chicago, IL, USA). P-values less than 0.05 were identified as statistically significant.
Results
CtBP1 was obviously upregulated in GC cells compared with human gastric epithelial cells and was associated with clinicopathologic features and prognosis
The expression patterns of CtBPs in GC cell lines (BGC-823、SGC-790、MKN-4 and MKN45) and a human gastric epithelial cell line (GES-1) were explored via RT-qPCR or Western blotting assays. Our data revealed that CTBP1 and CTBP2 mRNA and protein were highly expressed in the GC cell lines BGC-823、SGC-790、MKN-4 and MKN45 but were expressed at low levels in the human gastric epithelial cell line GES-1 (Figure 1A-C). In addition, there is no obvious difference in CTBP2 expression between the GC cell lines (BGC-823、SGC-790、MKN-4 and MKN45) and a human gastric epithelial cell line (GES-1) at the mRNA and protein levels.
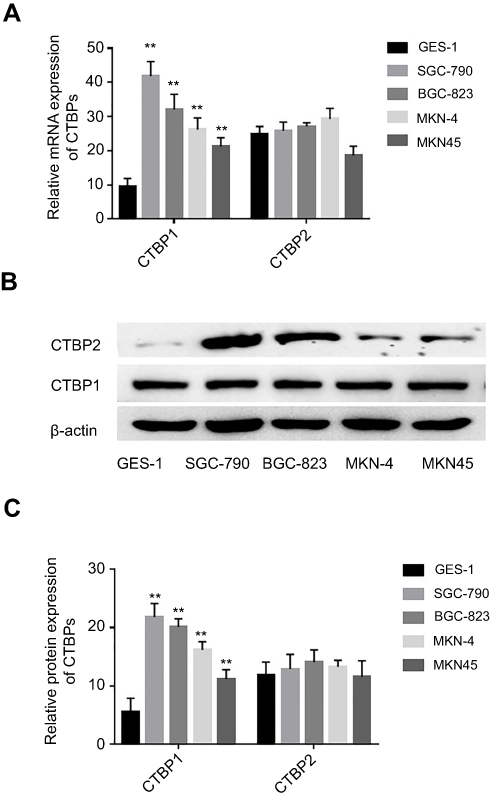 |
Figure 1 The mRNA and protein expression levels of CTBP1 in human gastric epithelial cell line and GC cell lines. (A) The relative mRNA expression of CTBP1 in gastric epithelial cell line and GC cell lines. (B) The relative protein expression of CTBP1 in gastric epithelial cell line and GC cell lines. (C) The corresponding statistical analysis of CTBP1 protein expression. **p<0.01, compared with gastric epithelial cell line. |
CtBP1 was obviously upregulated in GC patients and was associated with clinicopathologic prognosis
The expression patterns of CTBP1 among the 102 GC tissue samples and 98 noncancerous tissue samples were also explored via Western blotting assay or immunohistochemistry. As revealed in Figure 2A, CTBP1 expression in GC tissues and noncancerous tissues was primarily located in cell nuclei. As depicted in Table 1, CTBP1 was expressed in 67.6% (69/102) of GC tissues and 37.8% (37/98) of noncancerous tissues (Table 1). CTBP1 was notably overexpressed in the GC tissues compared with the noncancerous tissues. Moreover, the expression of CTBP1 seemed not to be markedly associated with clinical factors such as patient age (p=0.138) and gender (p=0.374), but was associated with TNM stage (p=0.0007), p-JAK1 (p=0.0026) and distant metastasis (p=0.0014).
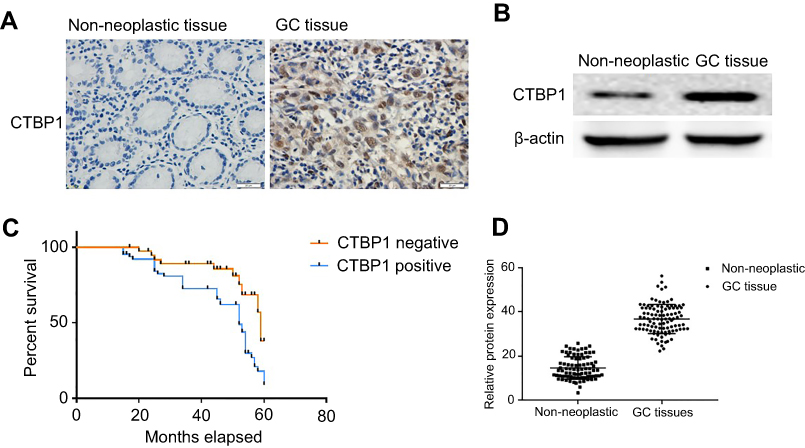 |
Figure 2 The expression of CTBP1 in GC patients. (A) Detection of CTBP1 in primary GC tissues and non-neoplastic tissues. (B) Protein expression of CTBP1 in human primary GC tissues and non-neoplastic tissues. (C) Kaplan-Meier Survival Curves and the Log-Rank Test were used in analysis of association between CTBP1 and survival time. (D) The corresponding statistical analysis of CTBP1 protein expression. |
Semiquantitative immunoblotting analysis was also performed to analyze the differences in CTBP1 expression between noncancerous tissues and GC tissues. As shown in Figure 2B and D, CTBP1 was significantly upregulated in GC tissues compared with noncancerous bone tissues (p=0.0034).
The association between CtBP1 and survival time was analyzed via Kaplan-Meier survival curves and the log-rank test. As suggested in Figure 2C, patients with tumors that were positive for the CTBP1 protein (median survival, 38.75 months) had notably shorter survival times than patients with tumors that were negative for the CTBP1 protein (median survival, 44.26 months) (log-rank P-value=0.0064).
Overexpression of ctBP1 significantly promoted the malignant phenotype of human gastric epithelial cells
Given that low CtBP1 expression was observed in the human gastric epithelial cell line GES-1, we attempted to explore the effects of CtBP1 overexpression on the metastatic phenotype of human gastric epithelial cells. GES-1 cells were transfected with the pNSE-IRES2-EGFP-C1/CTBP1 plasmid (termed the CTBP1 group) or with the pNSE-IRES2-EGFP-C1 vector as a negative control. Western blotting was used to analyze the expression of CTBP1 and the changes in the activation state of the JAK1/Stat3 pathway in these cells. As shown in Figure 3A, the proportions of phosphorylated JAK1 (p=0.0012) and phosphorylated Stat3 (p=0.0023) were significantly increased in the GES-1 cells that overexpressed CTBP1. To determine the impact of CTBP1 on the malignant phenotype of gastric epithelial cell lines, the CCK8 method was used to draw a growth curve for the GES-1 cell line. As depicted in Figure 3B, the proliferation rate of GES-1-CTBP1 cells was significantly higher than that of the vector-transfected cells (p=0.006). We also determined the ability of CTBP1-overexpressing cells to form colonies in 2D monolayer cultures (Figure 3C). The number of colonies formed by CTBP1-overexpressing cells was significantly higher than the number formed by the scramble-transfected cells (p=0.0002). Upon performing transwell assays (Figure 3D) and wound-healing assays (Figure 3E), we observed that cell migration and invasion ability was enhanced following the overexpression of CTBP1 in GES-1 cells. Taken together, the results suggest that CTBP1 expressing has an ameliorative effect on the malignant phenotype in gastric epithelial cells.
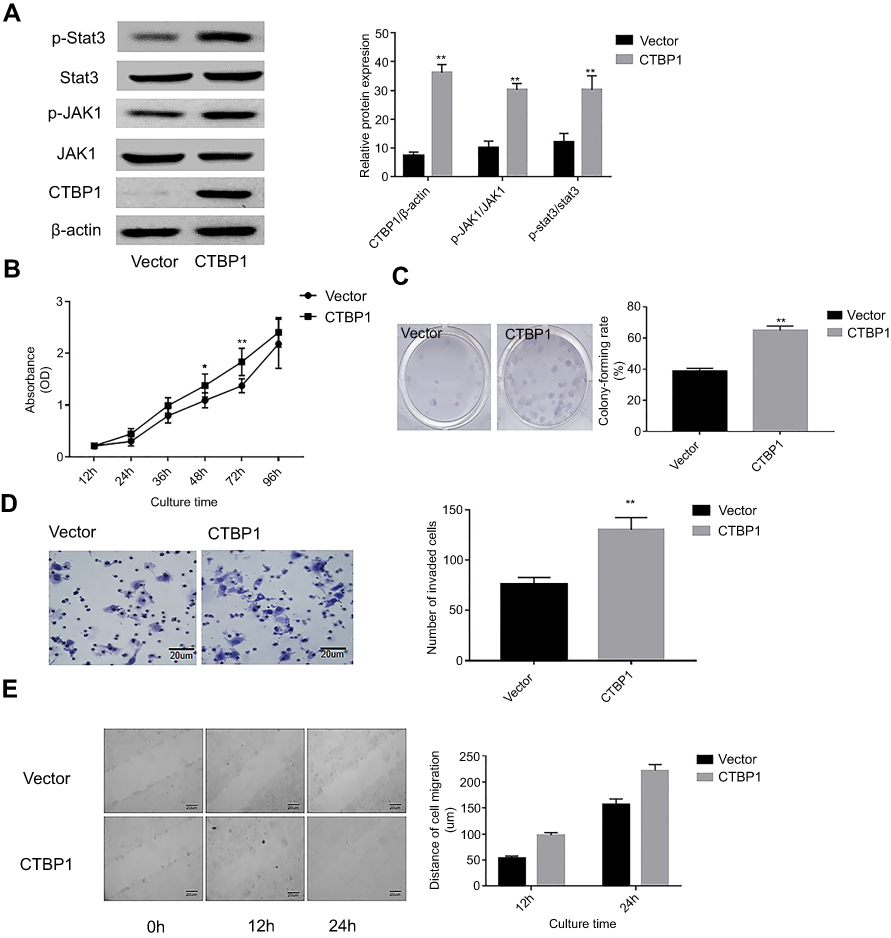 |
Figure 3 The overexpression of CtBP1 significantly promoted the malignant phenotype of gastric epithelial cell line cell. (A) Western blotting was utilized to examine the expression of CTBP1 and the activities level of the JAK1/Stat3 signaling pathway (left), and the corresponding statistical analysis of protein expression (right). Note: normalized with β-actin. (B) Growth curve of GES-1 cells detected by the CCK-8 assay. (C) The abilities of GES-1 cells to form colonies under 2D culture condition were determined through colony formation assay. (D) The Tanswell chambers method was utilized to explore the impact of CTBP1 overexpression on the invasive ability of GES-1 cells in vitro (left), and the corresponding statistical analysis (right). (E) The wound-healing assay was utilized to explore the migration ability of GES-1 cells in vitro. **p<0.01, compared with the vector group. |
Knockout of ctBP1 or JAK1 decreased the migration and invasion ability of GC cells
Given that CtBP1 overexpression was observed in GC cells, we attempted to explore the effects of CtBP1 or JAK1 knockout on GC progression. As presented in Figure 4A and B, the activation state of the Stat3 pathway in GC cell line SGC-790 was explored via Western blotting. As displayed in Figure 4A, the ratios of phosphorylated and phosphorylated Stat3 (p=0.0003; p=0.0021, respectively) were significantly decreased in the SGC-790 cells with silenced CTBP1 or JAK1. Although it is observed that the JAK1/Stat3 signaling pathway was regulated by CTBP1, our data also revealed that the JAK1 silencing have no obvious effect on the expression on CTBP1 expression (p=0.723) in GC cells. Similarly, as it revealed in Figure S1, exogenous inhibitors of JAK1 AG490 was used to treat the GC cells, our observation revealed that the exogenous inhibitors of JAK1 have no obvious effect on the expression of CTBP1 (p=0.836).
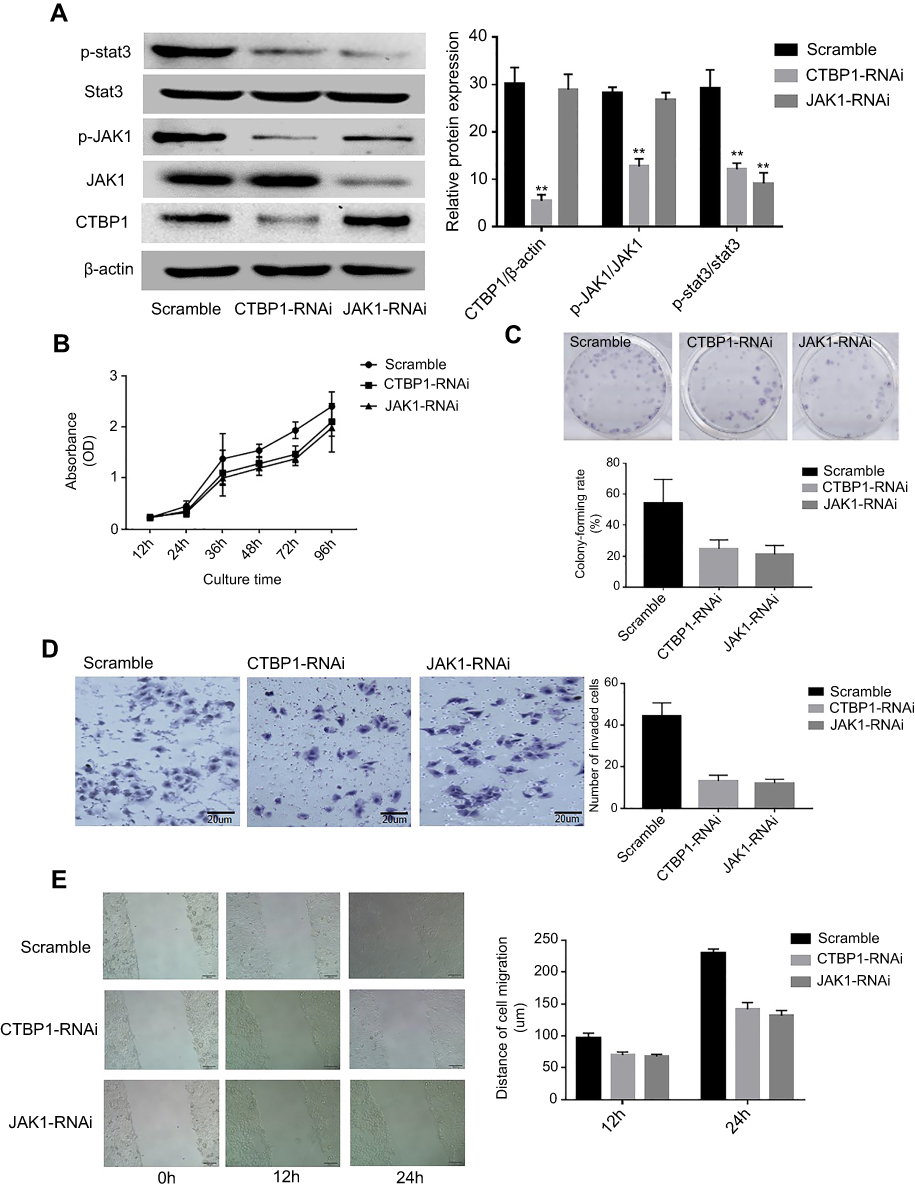 |
Figure 4 Loss of CtBP1 or JAK1 decreased the on the migration and invasion ability of GC cells. (A) Western blotting was used to examine the effects of silencing CtBP1 or JAK1 and the activation of the Stat3 signaling pathway in the SGC-790 cell line (left), and the corresponding statistical analysis of protein expression (right). Note: normalized with β-actin. (B) Growth curve of SGC-790 cells detected by the CCK-8 assay. (C)The abilities of SGC-790 cells to form colonies under 2D culture condition were determined through colony formation assay. (D) The Tanswell chambers method was utilized to explore the impact of CTBP1 or JAK1 slience on the invasive ability of SGC-790 cells in vitro (left), and the corresponding statistical analysis (right). (E) The wound-healing assay was utilized to explore the migration ability of SGC-790 cells in vitro. **p<0.01, compared with the scramble group. |
To determine the impact of CTBP1 and JAK1 on the malignant phenotype of GC cell lines, the CCK8 method was used to draw the growth curve of the SGC-790 cell line. As depicted in Figure 4B, the proliferation rate of CTBP1-RNAi or JAK1-RNAi transfected cells were significantly lower than that of the scramble-transfected cells (p=0.0017; p=0.0022, respectively). We also determined the ability of CTBP1-silenced and JAK1-silenced cells to form colonies in 2D monolayer cultures (Figure 4C). The number of colonies formed by CTBP1-silenced and JAK1-silenced cells were significantly lower than the number formed by the scramble-transfected cells (p=0.0032; p=0.0045, respectively). Upon performing wound-healing and transwell assays (Figure 4D and E), we observed that cell migration and invasion ability was reduced following induced CTBP1 or JAK1 expression in SGC-790 cells. Taken together, the results suggest that CTBP1 silencing inhibits cell migration and invasion in the human GC cell line SGC-790.
Discussion
GC was reported to rank the second leading cause of cancer-specific mortality worldwide.31 With a poor prognosis, 5-year survival rate of GC is less than 20–25% in the USA, China, and Europe.32 However, early GC represents an excellent (over 90%) opportunity of cure through surgical resection.2 As the increasing detection of early GC, biological therapy options have been technologically advanced both curatively and minimally invasively to maintain a good quality of life.1,3 Recently, dysregulated control of CtBPs expression have been revealed to be a vital originating step in the formation of certainhuman tumors.33–35 CtBPs inhibit multiple proapoptotic and epithelial genes, and overexpression of CtBP in human cancer cells promotes the EMT and cancer cell survival.15,16,36 Knockout of CtBP clearly increases apoptosis and inhibits tumorigenesis in vivo.37,38 However, reduced CtBP1 expression is associated with melanoma progression owing to a knockout of CtBP-dependent suppression of melanoma-inhibiting gene expression in melanoma cells.39,40 Our previous tissue chip research has suggested that an overexpression of CTBP1 is very highly related to tumor progression in GC. These properties provide a unique opportunity for cancer-specific therapy in GC that potentially spares normal tissues. Inhibition of CtBP function is therefore an attractive anticancer therapeutic strategy, but the functions of CtBPs protein have not been clinically targeted in GC thus far. Overall, more studies on the expression profiles and roles of CtBPs in GC need to be performed.
Since earlier studies implicated CtBP as a transcriptional co-repressor, several studies have also revealed context-specific roles of CtBP in transcriptional activation.17 For instance, CtBP2 has been shown to directly activate the expression of Tiam1 in an NADH-dependent manner and to activate the transcription factor 4 (TCF-4) signaling pathway.41,42 In human multidrug-resistant (MDR) cancer cell lines, CtBP1 has been shown to directly activate the expression of the MDR1 gene, thereby increasing levels of the P-glycoprotein and drug resistance.43 Interestingly, the NADH-unbound form of CtBP has also been implicated in distinct transcriptional activities unique to apo-CtBP, including the interaction with specific transcriptional regulators, p300 and Hdm2, and the transcriptional activation of Wingless pathway targets.44 CtBP corepressors thus play multiple context-dependent roles in oncogenic processes.12,45 Consequently, further research to expand our present understanding of transcriptional corepressors in GC oncogenesis could impact the future development of new therapies.
Janus kinase (JAK) 1, a member of receptor protein tyrosine kinases (RPTKs) which integrates signals from many cytokines and associate with the intracellular domains of surface cytokine receptors, can phosphorylate the signal transducers and activators of transcription (STATs) to modulate gene expression.46 In the present study, the influence of CTBP1 on the JAK1/Stat3 signaling pathway in GC cells was explored, and the results suggested that CtBP1 markedly promoted the JAK1/Stat3 signaling pathway. Moreover, to further confirm our results, an GC cell line (SGC-790) with CtBP1 knockout was also established. Similar to the observations in the gastric epithelial cells, the present data showed that CtBP1 silencing resulted in inhibition of the JAK1/Stat3 signaling pathway and suppressed the metastatic phenotype in GC cell lines. Beyond that the JAK1/Stat3 signaling pathway was regulated by CTBP1, our data revealed that the JAK1 silencing have no obvious effect on the expression on CTBP1 expression in GC cells. Currently, a limited number of studies have indicated that JAK1/Stat3 signaling impacts the role of CtBPs protein in human tumorigenesis. Notably, in the present study, it was demonstrated that upregulation of CtBP1 contributes to enhancement of cell invasion and migration through the JAK1/Stat3 signaling pathway in GC. However, the detailed mechanism of how the signal is transduced from nuclear-anchored CtBP1 to JAK1 proteins remains to be elucidated.
Currently, the specific molecular mechanisms of CtBPs and their role in GC remain unclear. Our results suggested that CTBP1 overexpression markedly enhanced the invasive ability of the GC cell line and revealed that CTBP1 activated Stat3 signaling via JAK1, ultimately promoting the invasive ability of GC cells. In view of the inadequate therapeutic options for GC, our assessment of the role of CTBP1 as a target protein is of great research significance.
Conclusion
In summary, our observations revealed that CTBP1 was overexpressed in GC tissues and that this overexpression was associated with distant metastasis. To validate our hypothesis, a CTBP1-overexpressing gastric epithelial cell line and a CTBP1-knockout GC cell line were established, and our data indicated that knockout of CTBP1 inhibited the proliferation, metastasis and migration of GC cells. Additionally, the JAK1/Stat3 signaling pathway was found to be involved in the influence of CTBP1 on the metastatic ability of GC cells.
Consent for publication
Written informed consent for publication was obtained. A copy of the consent form is available for review by the Editor of this journal.
Data availability
The datasets used and/or analyzed during the present study are available from the corresponding author on reasonable request.
Ethics approval and informed consent
All procedures performed in studies involving human participants were in accordance with the ethical standards of the institutional and/or national research committee and with the 9864 Helsinki Declaration and its later amendments or comparable ethical standards. Ethics approval (approval no. JLU02812) was approved by the Ethics Committee of Jilin University. This article does not contain any studies with animals performed by any of the authors. The informed consent for participation was obtained from all patients and their parents who participated in this study in an appropriate method.
Abbreviations
C-terminus of the E1A binding protein, CTBP; immunohistochemical analysis, IHC; cell counting kit-8, CCK-8; Janus Kinase 1, JAK1; signal transducer and activator of transcription 3, Stat3; gastric cancer, GC.
Disclosure
The authors report no conflicts of interest in this work.
References
1. Wang J, Yu JC, Kang WM, Ma ZQ. Treatment strategy for early gastric cancer. Surg Oncol. 2012;21(2):119–123. doi:10.1016/j.suronc.2010.12.004
2. Koessler T, Roth A, Cacheux W. [Early gastric cancer: epidemiology, diagnostic and management]. Rev Med Suisse. 2014;10(431):1118–1122.
3. Karimi P, Islami F, Anandasabapathy S, Freedman ND, Kamangar F. Gastric cancer: descriptive epidemiology, risk factors, screening, and prevention. Cancer Epidemiol Biomarkers Prev. 2014;23(5):700–713. doi:10.1158/1055-9965.EPI-13-1057
4. Cavatorta O, Scida S, Miraglia C, et al. Epidemiology of gastric cancer and risk factors. Acta Bio-Medica. 2018;89(8–S):82–87. doi:10.23750/abm.v89i8-S.7966
5. Schaeper U, Subramanian T, Lim L, Boyd JM, Chinnadurai G. Interaction between a cellular protein that binds to the C-terminal region of adenovirus E1A (CtBP) and a novel cellular protein is disrupted by E1A through a conserved PLDLS motif. J Biol Chem. 1998;273(15):8549–8552. doi:10.1074/jbc.273.15.8549
6. Zhao LJ, Subramanian T, Vijayalingam S, Chinnadurai G. PLDLS-dependent interaction of E1A with CtBP: regulation of CtBP nuclear localization and transcriptional functions. Oncogene. 2007;26(54):7544–7551. doi:10.1038/sj.onc.1210569
7. Chinnadurai G. The transcriptional corepressor CtBP: a foe of multiple tumor suppressors. Cancer Res. 2009;69(3):731–734. doi:10.1158/0008-5472.CAN-08-3349
8. Blevins MA, Huang M, Zhao R. The role of CtBP1 in oncogenic processes and its potential as a therapeutic target. Mol Cancer Ther. 2017;16(6):981–990. doi:10.1158/1535-7163.MCT-16-0592
9. Paredes R, Schneider M, Stevens A, et al. EVI1 carboxy-terminal phosphorylation is ATM-mediated and sustains transcriptional modulation and self-renewal via enhanced CtBP1 association. Nucleic Acids Res. 2018;46(15):7662–7674. doi:10.1093/nar/gky536
10. Dcona MM, Morris BL, Ellis KC, Grossman SR. CtBP- an emerging oncogene and novel small molecule drug target: advances in the understanding of its oncogenic action and identification of therapeutic inhibitors. Cancer Biol Ther. 2017;18(6):379–391. doi:10.1080/15384047.2017.1323586
11. Zou F, Xu J, Fu H, et al. Different functions of HIPK2 and CtBP2 in traumatic brain injury. J Mol Neurosci. 2013;49(2):395–408. doi:10.1007/s12031-012-9906-2
12. Chinnadurai G. CtBP family proteins: more than transcriptional corepressors. BioEssays. 2003;25(1):9–12. doi:10.1002/bies.10212
13. Turner J, Crossley M. The CtBP family: enigmatic and enzymatic transcriptional co-repressors. BioEssays. 2001;23(8):683–690. doi:10.1002/bies.1097
14. Zhao Z, Hao D, Wang L, et al. CtBP promotes metastasis of breast cancer through repressing cholesterol and activating TGF-beta signaling. Oncogene. 2018;38(12):2076–2091.
15. Zheng X, Song T, Dou C, Jia Y, Liu Q. CtBP2 is an independent prognostic marker that promotes GLI1 induced epithelial-mesenchymal transition in hepatocellular carcinoma. Oncotarget. 2015;6(6):3752–3769. doi:10.18632/oncotarget.2915
16. Zhang XL, Huang CX, Zhang J, Inoue A, Zeng SE, Xiao SJ. CtBP1 is involved in epithelial-mesenchymal transition and is a potential therapeutic target for hepatocellular carcinoma. Oncol Rep. 2013;30(2):809–814. doi:10.3892/or.2013.2537
17. Blevins MA, Zhang C, Zhang L, et al. CPP-E1A fusion peptides inhibit CtBP-mediated transcriptional repression. Mol Oncol. 2018;12(8):1358–1373. doi:10.1002/1878-0261.12330
18. Shen Z, Asa SL, Ezzat S. Ikaros and its interacting partner CtBP target the metalloprotease ADAMTS10 to modulate pituitary cell function. Mol Cell Endocrinol. 2017;439:126–132. doi:10.1016/j.mce.2016.10.032
19. Li L, Liu X, He L, et al. ZNF516 suppresses EGFR by targeting the CtBP/LSD1/CoREST complex to chromatin. Nat Commun. 2017;8(1):691. doi:10.1038/s41467-017-00702-5
20. Ichikawa K, Kubota Y, Nakamura T, et al. MCRIP1, an ERK substrate, mediates ERK-induced gene silencing during epithelial-mesenchymal transition by regulating the co-repressor CtBP. Mol Cell. 2015;58(1):35–46. doi:10.1016/j.molcel.2015.01.023
21. Kumar V, Carlson JE, Ohgi KA, et al. Transcription corepressor CtBP is an NAD(+)-regulated dehydrogenase. Mol Cell. 2002;10(4):857–869.
22. Balasubramanian P, Zhao LJ, Chinnadurai G. Nicotinamide adenine dinucleotide stimulates oligomerization, interaction with adenovirus E1A and an intrinsic dehydrogenase activity of CtBP. FEBS Lett. 2003;537(1–3):157–160.
23. Chen S, Whetstine JR, Ghosh S, et al. The conserved NAD(H)-dependent corepressor CTBP-1 regulates caenorhabditis elegans life span. Proc Natl Acad Sci U S A. 2009;106(5):1496–1501. doi:10.1073/pnas.0802674106
24. Verger A, Quinlan KG, Crofts LA, et al. Mechanisms directing the nuclear localization of the CtBP family proteins. Mol Cell Biol. 2006;26(13):4882–4894. doi:10.1128/MCB.02402-05
25. Zhang Q, Wang SY, Nottke AC, Rocheleau JV, Piston DW, Goodman RH. Redox sensor CtBP mediates hypoxia-induced tumor cell migration. Proc Natl Acad Sci U S A. 2006;103(24):9029–9033. doi:10.1073/pnas.0603269103
26. Bellesis AG, Jecrois AM, Hayes JA, Schiffer CA, Royer WE
27. Deng Y, Liu J, Han G, et al. Redox-dependent Brca1 transcriptional regulation by an NADH-sensor CtBP1. Oncogene. 2010;29(50):6603–6608. doi:10.1038/onc.2010.406
28. Zhang X, Ruan Y, Li Y, Lin D, Quan C. Tight junction protein claudin-6 inhibits growth and induces the apoptosis of cervical carcinoma cells in vitro and in vivo. Med Oncol. 2015;32(5):148. doi:10.1007/s12032-015-0600-4
29. Yang Y, Yang H, McNutt MA, et al. LAPTM4B overexpression is an independent prognostic marker in ovarian carcinoma. Oncol Rep. 2008;20(5):1077–1083.
30. Zhang X, Wang H, Li Q, Li T. CLDN2 inhibits the metastasis of osteosarcoma cells via down-regulating the afadin/ERK signaling pathway. Cancer Cell Int. 2018;18:160. doi:10.1186/s12935-018-0662-4
31. Venerito M, Vasapolli R, Rokkas T, Malfertheiner P. Gastric cancer: epidemiology, prevention, and therapy. Helicobacter. 2018;23(Suppl):1e12518. doi:10.1111/hel.2018.23.issue-S1
32. Sitarz R, Skierucha M, Mielko J, Offerhaus GJA, Maciejewski R, Polkowski WP. Gastric cancer: epidemiology, prevention, classification, and treatment. Cancer Manag Res. 2018;10:239–248. doi:10.2147/CMAR.S149619
33. Eshelman MA, Shah M, Raup-Konsavage WM, Rennoll SA, Yochum GS. TCF7L1 recruits CtBP and HDAC1 to repress DICKKOPF4 gene expression in human colorectal cancer cells. Biochem Biophys Res Commun. 2017;487(3):716–722. doi:10.1016/j.bbrc.2017.04.123
34. de Barrios O, Gyorffy B, Fernandez-Acenero MJ, et al. ZEB1-induced tumourigenesis requires senescence inhibition via activation of DKK1/mutant p53/Mdm2/CtBP and repression of macroH2A1. Gut. 2017;66(4):666–682. doi:10.1136/gutjnl-2015-310838
35. Zhao C, Shen Y, Tao X, et al. Silencing of CtBP1 suppresses the migration in human glioma cells. J Mol Histol. 2016;47(3):297–304. doi:10.1007/s10735-016-9678-z
36. Zhang G, Kang L, Chen J, et al. CtBP2 regulates TGFbeta2-induced epithelial-mesenchymal transition through notch signaling pathway in lens epithelial cells. Curr Eye Res. 2016;41(8):1057–1063. doi:10.3109/02713683.2015.1092554
37. Wang SY, Iordanov M, Zhang Q. c-Jun NH2-terminal kinase promotes apoptosis by down-regulating the transcriptional co-repressor CtBP. J Biol Chem. 2006;281(46):34810–34815. doi:10.1074/jbc.M607484200
38. Corda D, Colanzi A, Luini A. The multiple activities of CtBP/BARS proteins: the golgi view. Trends Cell Biol. 2006;16(3):167–173. doi:10.1016/j.tcb.2006.01.007
39. Deng H, Liu J, Deng Y, et al. CtBP1 is expressed in melanoma and represses the transcription of p16INK4a and Brca1. J Invest Dermatol. 2013;133(5):1294–1301. doi:10.1038/jid.2012.487
40. Winklmeier A, Poser I, Hoek KS, Bosserhoff AK. Loss of full length CtBP1 expression enhances the invasive potential of human melanoma. BMC Cancer. 2009;9:52. doi:10.1186/1471-2407-9-52
41. Cuilliere-Dartigues P, El-Bchiri J, Krimi A, et al. TCF-4 isoforms absent in TCF-4 mutated MSI-H colorectal cancer cells colocalize with nuclear CtBP and repress TCF-4-mediated transcription. Oncogene. 2006;25(32):4441–4448. doi:10.1038/sj.onc.1209471
42. Valenta T, Lukas J, Korinek V. HMG box transcription factor TCF-4’s interaction with CtBP1 controls the expression of the Wnt target Axin2/conductin in human embryonic kidney cells. Nucleic Acids Res. 2003;31(9):2369–2380. doi:10.1093/nar/gkg346
43. Jin W, Scotto KW, Hait WN, Yang JM. Involvement of CtBP1 in the transcriptional activation of the MDR1 gene in human multidrug resistant cancer cells. Biochem Pharmacol. 2007;74(6):851–859. doi:10.1016/j.bcp.2007.06.017
44. Kim JH, Cho EJ, Kim ST, Youn HD. CtBP represses p300-mediated transcriptional activation by direct association with its bromodomain. Nat Struct Mol Biol. 2005;12(5):423–428. doi:10.1038/nsmb924
45. Senyuk V, Sinha KK, Nucifora G. Corepressor CtBP1 interacts with and specifically inhibits CBP activity. Arch Biochem Biophys. 2005;441(2):168–173. doi:10.1016/j.abb.2005.06.024
46. Wehde BL, Radler PD, Shrestha H, et al. Janus Kinase 1 plays a critical role in mammary cancer progression. Cell Rep. 2018;25(8):2192–2207, e2195. doi:10.1016/j.celrep.2018.10.063
Supplementary material
The exogenous inhibitors of JAK1 have no obvious effect on the expression of CTBP1
To determine the relationship between exogenous inhibitors of JAK1 and CTBP1, GC cells were treated with the JAK1 tyrosinase inhibitor AG490.
After treatment with 20 nM of the JAK1 tyrosinase inhibitor AG490 for 24 h, the activation state of the JAK1/Stat3 pathway and CTBP1 expression in GC SGC-790 cells was explored via Western blotting. As shown in Figure S1, the ratios of phosphorylated JAK1 (p=0.0027) and phosphorylated Stat1 (p=0.0003) were significantly decreased in GC cells following AG490 treatment. However, our observation revealed that the exogenous inhibitors of JAK1 have no obvious effect on the expression of CTBP1 (p=0.763).
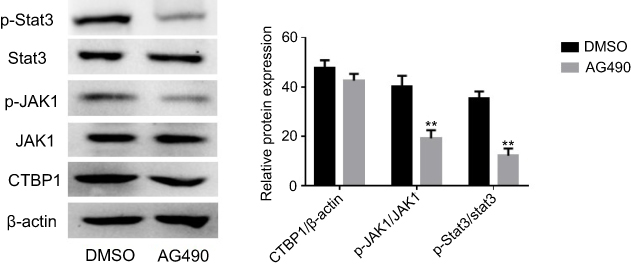 |
Figure S1 The tyrosine phosphorylation inhibitors AG490 was used to inhibit the JAK1 activity in GC SGC-790 cells. Western blotting was utilized to examine the expression of CTBP1 and the activities level of the JAK1/Stat3 signaling pathway.Note: Student’s t-test, **p<0.01, compared with DMSO group. |
 © 2019 The Author(s). This work is published and licensed by Dove Medical Press Limited. The
full terms of this license are available at https://www.dovepress.com/terms
and incorporate the Creative Commons Attribution
- Non Commercial (unported, 3.0) License.
By accessing the work you hereby accept the Terms. Non-commercial uses of the work are permitted
without any further permission from Dove Medical Press Limited, provided the work is properly
attributed. For permission for commercial use of this work, please see paragraphs 4.2 and 5 of our Terms.
© 2019 The Author(s). This work is published and licensed by Dove Medical Press Limited. The
full terms of this license are available at https://www.dovepress.com/terms
and incorporate the Creative Commons Attribution
- Non Commercial (unported, 3.0) License.
By accessing the work you hereby accept the Terms. Non-commercial uses of the work are permitted
without any further permission from Dove Medical Press Limited, provided the work is properly
attributed. For permission for commercial use of this work, please see paragraphs 4.2 and 5 of our Terms.