Back to Journals » Diabetes, Metabolic Syndrome and Obesity » Volume 8
C-reactive protein is associated with low-density lipoprotein cholesterol and obesity in type 2 diabetic Sudanese
Authors Dongway A, Faggad A ![]() , Zaki H, Abdalla B
, Zaki H, Abdalla B
Received 26 March 2015
Accepted for publication 3 June 2015
Published 4 September 2015 Volume 2015:8 Pages 427—435
DOI https://doi.org/10.2147/DMSO.S85451
Checked for plagiarism Yes
Review by Single anonymous peer review
Peer reviewer comments 3
Editor who approved publication: Professor Ming-Hui Zou
Angelo C Dongway,1 Areeg S Faggad,2,3 Hani Y Zaki,2 Badreldin E Abdalla,2,4
1Department of Biochemistry, Faculty of Medicine, Upper Nile University, Malakal, South Sudan; 2Department of Biochemistry and Nutrition, Faculty of Medicine, University of Gezira, 3Department of Molecular Biology, National Cancer Institute-University of Gezira, Wad Medani, Sudan; 4Department of Biochemistry, Faculty of Science, King Abdulaziz University, Jeddah, Kingdom of Saudi Arabia
Background: Type 2 diabetes is emerging in Sudan and is associated with obesity. Deregulated lipid metabolism and inflammatory states are suggested risk factors for cardiovascular disease, which is a leading cause of diabetic death. This study aimed to investigate C-reactive protein (CRP) levels and the lipid profile in type 2 diabetic adult Sudanese compared with nondiabetics, and to test their associations with other characteristics.
Methods: A cross-sectional study including 70 diabetics and 40 nondiabetics was conducted. Anthropometric measurements were assessed, and demographic and medical data were obtained using a structured questionnaire. Blood specimens were collected and biochemical parameters were analyzed applying standard methods.
Results: CRP and triglycerides were significantly higher in the diabetic group (P<0.001 and P=0.01, respectively). Differences in total cholesterol, low-density lipoprotein cholesterol (LDL-C), and high-density lipoprotein cholesterol (HDL-C) were not statistically significant between the diabetic and nondiabetic groups. In the diabetic group, correlation analysis revealed that the CRP level had a significant positive correlation with LDL-C (r=0.255, P=0.034) and body mass index (r=0.29, P=0.016). Body mass index showed a significant positive correlation with triglycerides (r=0.386, P=0.001). Within the lipid parameters, a number of significant correlations were observed. Elevated levels of CRP, LDL-C, and triglycerides were markedly more prevalent in the diabetic group of patients. Diabetics showed significantly higher CRP levels compared with nondiabetics (odds ratio 5.56, P=0.001).
Conclusion: The high prevalence of obesity among diabetics, together with elevated levels of triglycerides and CRP, suggest coexistence of dyslipidemia and inflammation in diabetes. Our findings emphasize that diabetics were 5.6 times more likely to have high CRP levels than nondiabetics; as CRP is a predictor of cardiovascular disease risk, it can be recognized that diabetics are at more risk of cardiovascular disease than nondiabetics. Considering evaluation of CRP together with the lipid profile in prediction of cardiovascular disease risk in Sudanese diabetics should be further tested in large-scale studies.
Keywords: C-reactive protein, type 2 diabetes, lipid profile, obesity, cardiovascular disease, Sudanese
Introduction
Diabetes mellitus is a syndrome characterized by chronic hyperglycemia due to an absolute or relative lack of insulin and/or insulin resistance, resulting mainly in dysregulation of carbohydrate, protein, and lipid metabolism, which account for the symptoms and complications of diabetes.1
Diabetes is increasingly emerging as a major public health burden across the world. In 2013, the global prevalence of diabetes was estimated to be 8.4%, with 382 million people living with diabetes and over 5 million diabetes-related deaths;2 it is expected that the number of people living with diabetes will more than double between 2000 and 2030.3 The World Health Organization projects that diabetes will be the seventh leading cause of death in 2030.4 Diabetes particularly affects low-income and middle-income countries in terms of prevalence, mortality, and morbidity. More than 80% of people with diabetes live in developing countries, where rapid cultural and social changes, including changes in lifestyle, aging populations, increasing urbanization, dietary changes, and reduced physical activity, all contribute to the dramatic increase in the epidemic of diabetes. The majority of people with diabetes in low-income and middle-income countries are under 60 years of age.2 According to recent estimates, diabetes accounts for 1.4 million cases with a 7.7% prevalence and more than 25,000 diabetes-related deaths in Sudan.2
Type 2 diabetes mellitus (T2DM) accounts for approximately 90% of the diabetes cases worldwide,2 and is linked mainly to excess body weight and physical inactivity. The glucotoxicity and lipotoxicity that occur in diabetic patients could be reversed early by good management, which may assist in preventing or delaying the long-term complications of T2DM, particularly vascular complications.5
It is recognized that the risk of cardiovascular events is amplified in patients with T2DM, and dyslipidemia is a contributing factor.6 Weight gain and obesity are key factors in increasing the prevalence of both cardiovascular disease (CVD) and T2DM.7 CVD is more likely to develop at a younger age in patients with diabetes than in nondiabetics, with an increasing risk over the duration of the disease.8 It has been documented that diabetics are more likely to die of cardiovascular-related causes than nondiabetics.9 Data on mortality in diabetic patients showed that 52% of people with T2DM died of CVD, primarily heart disease and stroke.10 According to a recent World Health Organization report, age-standardized death rates for ischemic heart disease and cerebrovascular disease in Sudan were 212 and 118 per 100,000 respectively.11
C-reactive protein (CRP) is a 115 kDa pentamer synthesized and released mainly by hepatocytes under the control of cytokines such as interleukin-6, interleukin-1, and tumor necrosis factor-α.12 CRP is an acute-phase protein produced as part of innate nonspecific physiological and biochemical responses to a number of pathophysiological conditions including tissue damage, infection, inflammation, and malignancy.13 CRP can be used as a marker of systemic inflammation because circulating levels of CRP increase up to 1,000-fold within hours of a tissue injury.14 Currently, CRP is recognized as an indicator of vascular inflammation. Recently, the role of inflammation in the pathophysiology of CVD has been emphasized, and CRP, an inflammatory marker, has been reported to be related to different cardiovascular diseases.13,14 CRP is recognized as a predictor of cardiovascular conditions secondary to atherosclerosis,15 and is suggested to be a stronger predictor of cardiovascular events when compared with low-density lipoprotein cholesterol (LDL-C).16 Experiments demonstrated that CRP as a sensitive physiological marker of subclinical systemic inflammation is associated with hyperglycemia, insulin resistance, and overt T2DM.17 It is well established that a link exists between diabetes and systemic inflammation, an association that could be reflected in circulating levels of CRP.18–20 Increased concentrations of CRP have been reported in adult patients with T2DM.18,21–23 In other studies, CRP has been observed to be elevated prior to the development of diabetes,24–26 and could be an early indication of inflammation in diabetics. Recently, CRP was suggested as a therapeutic target.13 In subjects with type 2 diabetes, distribution of adipose tissue has been shown to be an important determinant of systemic inflammation.27 Worldwide, including in Sudan, the lipid profile, particularly LDL-C, is the focus of current guidelines for determination of risk of CVD in clinical practice. Considering evaluation of serum CRP together with the lipid pattern could be useful in early identification of type 2 diabetic Sudanese individuals at high risk of CVD. The aims of this study were to investigate CRP levels and the lipid profile in type 2 diabetic adult Sudanese in comparison with nondiabetics and to test the associations between these parameters and other characteristics of the study groups.
Materials and methods
Study subjects, area, and design
This study was approved by the ethics committee of the Faculty of Medicine, University of Gezira, Sudan. Prior to its implementation, the study objectives and procedure were explained to all participants, before obtaining their consent to enroll into the study. This cross-sectional study included 110 adult Sudanese residents of Gezira State, central Sudan. Among the participants, 70 were type 2 diabetic patients with no complications of the disease (diabetic group) who were attending Abu Aagla diabetes management center in Wad Medani, Gezira State, Sudan, in regular monthly visits for medical follow-up and monitoring of glycemic control. The remainder comprised the nondiabetic group, which included 40 healthy individuals without diabetes. Both males and females were included in the study (24.5% and 75.5%, respectively).
The diabetic and nondiabetic groups satisfied the following inclusion criteria: adult, willing to participate, nonsmokers, nonalcoholics, nonhypertensive, with no CVD, or liver or renal disease, no infection or inflammation, and not taking anti-inflammatory, lipid-lowering, or other medication that could interfere with the planned biochemical measurements. Subjects who did not meet the inclusion criteria were excluded.
Collection and processing of blood samples
Four milliliters of venous blood were collected from each participant after overnight fasting. Standard laboratory procedures were followed to prepare plasma for the measurement of glucose, total cholesterol, high-density lipoprotein cholesterol (HDL-C), LDL-C, and triglycerides, and to prepare serum for estimating the CRP concentration. Glycated hemoglobin (HbA1c) was assessed immediately using whole blood.
Data collection and anthropometric measurements
A structured questionnaire (Figure S1) was designed to obtain personal data and demographic characteristics, in addition to past and current medical information. Weight in kilogram (kg) and height in meter (m) for each participant were measured. The body mass index (BMI) was calculated applying the standard formula:

Biochemical measurements
The laboratory analyses of biochemical parameters were carried out using an A15 automated random access chemical analyzer manufactured by Biosystems (Barcelona, Spain). All reagents used were purchased from Biosystems. Biochemical investigations were performed applying standard methods according to the procedures recommended by the manufacturer. HbA1c and serum CRP were measured turbidimetrically. Plasma glucose, total cholesterol, HDL-C, LDL-C, and triglycerides were determined by spectrophotometry using standard enzymatic methods.
Statistical analysis
The statistical analysis was performed using Statistical Package for Social Sciences version 16 software (SPSS Inc., Chicago, IL, USA). Descriptive statistics were done applying appropriate methods. Numerical variables are presented as the mean and standard error of the mean. The independent samples t-test was used to compare the mean values of biochemical parameters between the diabetic and nondiabetic groups. Pearson’s correlation was applied to determine the association between biochemical and anthropometric parameters. Odds ratios were calculated by risk statistics in cross-tabulations for categorized variables (normal vs high or low). P-values ≤0.05 were considered to be statistically significant.
Results
To determine CRP levels and the lipid profile in type 2 diabetes, a total of 110 subjects (males and females) aged 30–70 years were recruited for this study. The average duration of disease was 5.5 years in the diabetic group. Demographic and anthropometric characteristics of the study group are shown in Table 1.
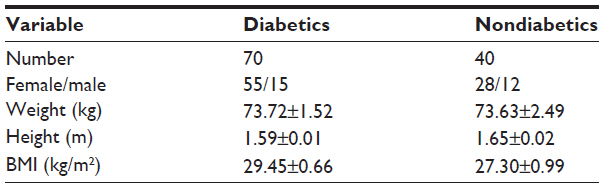 | Table 1 Characteristics of the study subjects |
Biochemical parameters
The plasma triglyceride concentration was found to be significantly higher in the diabetic group (127.76±7.57 mg/dL) than in the nondiabetic group (95.13±9.22 mg/dL; P=0.01). The acute-phase CRP serum concentration was markedly elevated in the diabetic group (3.93±0.46 mg/L) when compared with the nondiabetic group (1.65±0.99 mg/L); this difference was found to be statistically significant (P<0.0001). Nonsignificant higher mean values for total cholesterol and LDL-C and lower levels for HDL-C were observed in the diabetic group when compared with the nondiabetic group (Table 2).
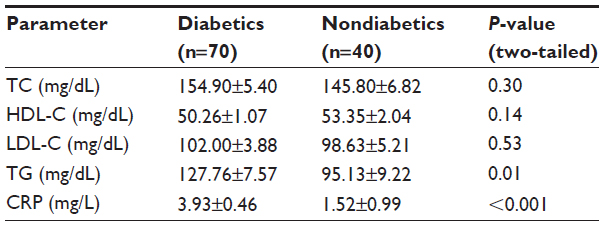 | Table 2 Biochemical parameters of the study groups |
Glycemic control
In the diabetic group, 49% of patients showed a higher fasting plasma glucose level. With regard to long-term glycemic control, according to the recommendations of the American Diabetes Association,28 good control (HbA1c <7%) was found in 42 (60%) of patients, while 28 (40%) were considered to have poor glycemic control (HbA1c ≥7%).
Risk factors for CVD
Classification of the diabetic subjects on the basis of concentrations of the measured biochemical parameters (as abnormal [high or low] vs normal) showed variations in the prevalence of risk factors for CVD between the two groups. High LDL-C was observed in 52.9% of the patients, followed by high CRP in 44.3%, and high triglycerides and total cholesterol in 31.4% and 15.7%, respectively. Low HDL-C was observed in only 10% of the diabetic group. In contrast, elevated levels were seen in 12.5%, 42.5%, 20%, and 12% for total cholesterol, LDL-C, triglycerides, and CRP, respectively, in the nondiabetic group (Figure 1).
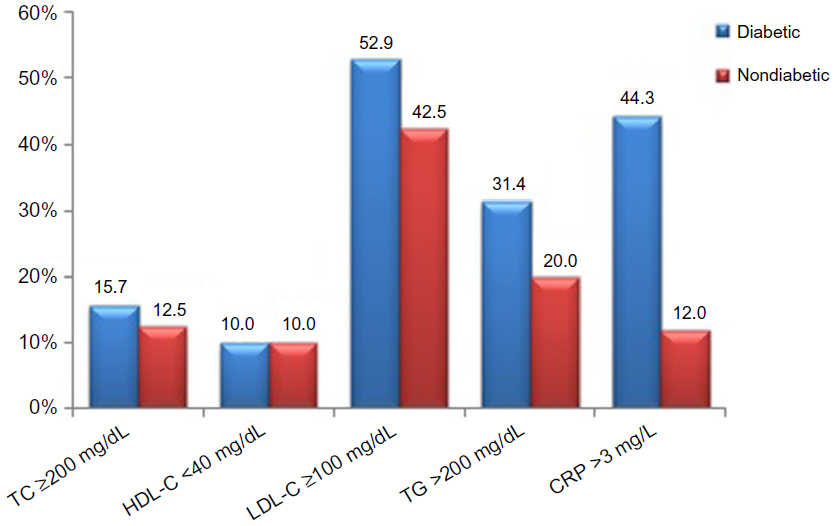 | Figure 1 Prevalence of abnormal levels of CRP and lipid parameters in the study groups. |
Odds ratios for CVD risk factors
Odds ratios calculated for lipid parameters revealed that diabetes was associated with higher levels of triglycerides, total cholesterol, LDL-C, and HDL-C. Elevated triglycerides showed the highest odds ratio (1.60) among the components of the lipid profile. However, all the lipid parameters failed to reach statistical significance. In contrast, a high CRP serum concentration was significantly associated with diabetes (odds ratio 5.56, P=0.001), ie, diabetics had a more than five times higher CRP level than nondiabetics (Table 3).
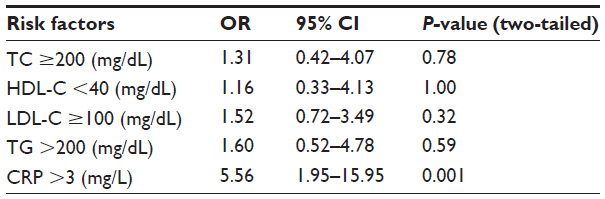 | Table 3 Odd ratios for CRP and lipid profile |
Correlation analysis
Pearson’s correlation analysis for biochemical parameters in the diabetic group showed correlations between BMI and some of the lipid parameters. BMI had a significant positive correlation with levels of triglycerides (r=0.386, P=0.001) and CRP (r=0.293, P=0.016), but showed no significant correlation with total cholesterol, HDL-C, triglycerides, fasting plasma glucose, or HbA1c. Further, CRP demonstrated a significant positive correlation with LDL-C (r=0.255, P=0.034) and a nonsignificant correlation with total cholesterol, HDL-C, and triglycerides (Table 4). Correlation analysis among the lipid parameters revealed a number of significant correlations; the total cholesterol level showed a strong significant correlation with LDL-C (r=0.847, P<0.01), and a moderate positive significant correlation with triglycerides (r=0.477, P<0.001) and with HDL-C (r=0.389, P=0.001). LDL-C showed a moderate positive significant correlation with HDL-C (r=0.315, P=0.009). LDL-C had a moderate positive correlation of borderline significance with triglycerides (r=0.225, P=0.067). Regression lines for the significant correlations are presented in Figure 2.
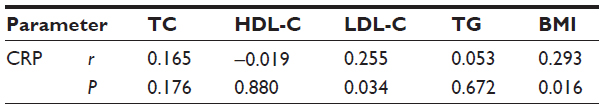 | Table 4 Correlation analysis of CRP with lipid profile and BMI in diabetics |
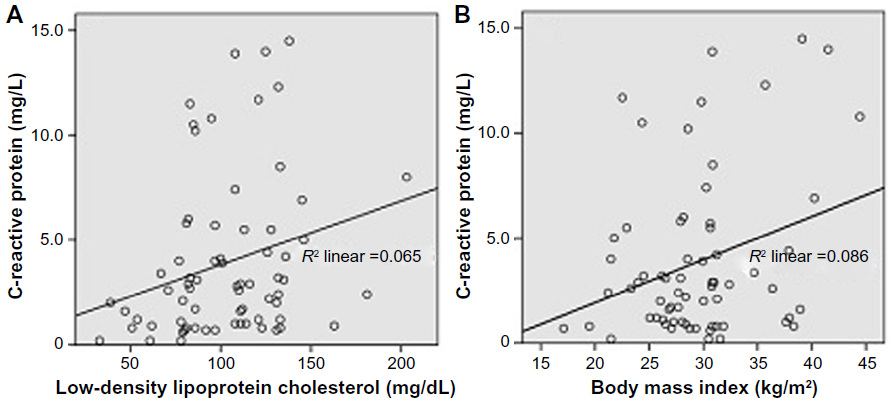 | Figure 2 Regression lines for (A) C-reactive protein and low-density lipoprotein cholesterol and (B) C-reactive protein and body mass index. |
Regression analysis
A logistic regression analysis was performed to determine the effects of total cholesterol, LDL-C, HDL-C, triglycerides, and HbA1c (as categorical covariates) on the likelihood of diabetics having high CRP. The logistic regression model was not statistically significant (χ2[5]=3.972, P=0.553). The model explained 7.4% of the variance in CRP and correctly classified 52.9% of cases. Diabetics with low HDL-C were 2.4 times more likely to have high CRP than those with high HDL-C. High HbA1c, indicating poor long-term glycemic control, was associated with a 1.8-fold increased likelihood of high CRP, and having high LDL-C and high triglycerides was associated with an 1.7-fold and 1.4-fold likelihood of high CRP, respectively. However, none of these associations reached a significance level of 0.05 (Table 5).
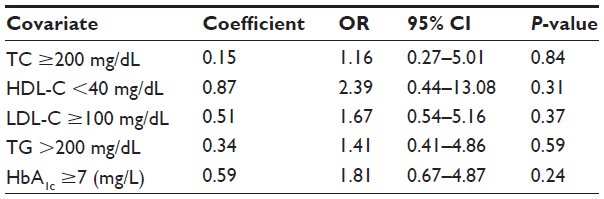 | Table 5 Logistic regression of CRP, lipid parameters, and HbA1c in diabetics |
Discussion
In this study, serum CRP and triglycerides were found to be significantly higher in the diabetic group when compared with the nondiabetic group. The CRP concentration correlated with LDL-C and BMI in type 2 diabetic Sudanese. The prevalence of elevated CRP, LDL-C, and triglycerides was significantly higher in the diabetic group.
A high prevalence of obesity was observed in the diabetic group, which had a mean BMI of 29.45±0.66 kg/m2. This high prevalence supports the link between type 2 diabetes and obesity, and has been reported to be a common finding in diabetic patients.7,29,30 It has been shown that glucose disposal by lean body mass is markedly reduced and glucose metabolism was impaired in obese adults, while plasma concentrations of nonesterified fatty acids and blood glycerol were high due to insulin resistance.31 Obesity is commonly associated with insulin resistance, increased production of proinflammatory cytokines, and changes in body fat distribution. Moreover, there are multiple complex redundant biochemical pathways that contribute locally and systemically to provoke and potentiate insulin resistance and chronic inflammation, which in turn promote further conditions, including diabetes mellitus.32 Obesity in diabetic patients affects the CRP level probably through hormonal changes linked to obesity. The high serum CRP concentration in diabetes reported in this study, and by other authors,33–35 could be due to the increase in adipose tissue mass that enhances cytokine production by adipocytes. Cytokine production is known to stimulate hepatic synthesis of CRP.36 Previous studies have documented that obesity is associated with elevated levels of CRP.37–39 In this study, in accordance with other researchers,33,40–43 we observed a significant correlation between BMI and serum concentration of CRP in T2DM. It has been suggested that obesity and hyperglycemia induce oxidative stress,44–46 which results in generation of free radicals in diabetic patients that could cause damage to the cell membrane and hence are associated with elevation of CRP, a mediator of inflammation. Therefore, we suggest that the effects of obesity and hyperglycemia could underlie the elevation of CRP. An elevated CRP level indicates inflammatory processes. Our findings highlight that diabetics were 5.6 times more likely to have high levels of CRP than nondiabetics, and since CRP is a predictor of CVD risk, it can be deduced that diabetics are at higher risk of CVD than nondiabetics and that CRP could be a potential indicator of CVD, especially in obese diabetics, as it has been shown that the inflammatory response, marked in part by the acute phase reactant CRP, is implicated in atherogenesis.47,48 Recently, elevated serum CRP on admission was reported to be an independent predictor of short-term case fatality and adverse functional outcome following acute ischemic stroke.49 Dyslipidemia is a key characteristic of type 2 diabetes,50,51 and contributes significantly to the high risk for CVD. The lipid abnormalities could be attributed mainly to the reduced action of insulin at the tissue level in type 2 diabetes.52
Deregulated lipid metabolism in type 2 diabetes has been reported in many studies, but with inconsistent findings for the different lipid components. Elevated mean total cholesterol, triglycerides, LDL-C, and lower HDL-C levels have been described in diabetics when compared with healthy nondiabetics.53 In agreement with earlier studies,53,54 our findings showed a significant elevation of triglycerides in the diabetic group, which could be attributed to high lipolysis in the diabetic state due to reduction or impairment of the action of insulin on adipose tissue. The influx of free fatty acids into the liver leads to high hepatic synthesis of triglycerides. In addition, the action of lipoprotein lipase in adipose tissue is suppressed, resulting in low lipoprotein degradation and hypertriglyceridemia.55 Our study showed no significant difference in total cholesterol between diabetics and nondiabetics, which is in line with Barrett-Connor et al.54 The lack of significant differences in LDL-C and HDL-C levels between diabetics and nondiabetics in this study is similar to the findings of Ledeia et al56 but in contrast with those of other authors.53 Our finding of raised CRP in Sudanese type 2 diabetics is consistent with studies in other populations.21–23,57–59 High CRP, dyslipidemia, and high LDL-C are reported to be the main risk factors for the chronic complications of T2DM.60 The high prevalence of obesity in diabetics together with elevation of triglycerides and CRP suggests coexistence of dysregulated lipid metabolism and inflammation in diabetic patients.
This study had a small sample size, which limited the power and accuracy of the analysis. However, data on CRP and lipid variables in T2DM and their possible involvement in CVD have not been available in this part of the world, and our research should help to highlight the need for serious monitoring and management of raised CRP and dyslipidemia in patients with type 2 diabetes.
In conclusion, the present study demonstrates a link between serum CRP concentration, LDL-C, and BMI. Diabetics were found to have more than five times higher CRP than nondiabetics, and there was a higher prevalence of hypertriglyceridemia and elevated LDL-C in diabetics. Further research in a large study population of type 2 diabetics is needed to test our findings and investigate the association between glycemic control on the one hand and CRP and lipid profile on the other. Additional investigations are also needed to compare the predictive value of CRP with that of LDL-C for assessment of CVD risk in type 2 diabetic patients and to determine if joint determination of CRP and the lipid profile could be used as early biomarkers for the cardiovascular complications of diabetes.
Acknowledgments
The authors are grateful to the study participants for their cooperation. The laboratory technicians at Abu Agla diabetes management center are acknowledged for their facilitation of the laboratory analyses. This work was funded by the Ministry of Education, Unity State, South Sudan.
Disclosure
The authors report no conflicts of interest in this work.
References
Frier BM, Fisher M. Diabetes mellitus. In: Colledge NR, Walker BR, Ralston SH, editors. Davidsons’s Principles and Practice of Medicine. 21st ed. New York, NY, USA: Churchill Livingstone Elsevier; 2010. | |
International Diabetes Federation. IDF Diabetes Atlas. 6th ed, 2013. Available from: http://www.idf.org/sites/default/files/EN_6E_Atlas_Full_0.pdf. Accessed June 25, 2015. | |
Wild S, Roglic G, Green A, Sicree R, King H. Global prevalence of diabetes: estimates for the year 2000 and projections for 2030. Diabetes Care. 2004;27(5):1047–1053. | |
Mathers CD, Loncar D. Projections of global mortality and burden of disease from 2002 to 2030. PLoS Med. 2006;3(11):e442. | |
Stolar M. Glycemic control and complications in type 2 diabetes mellitus. Am J Med. 2010;123(3 Suppl):S3–S11. | |
Brunzell JD, Davidson M, Furberg CD, et al. Lipoprotein management in patients with cardiometabolic risk: consensus statement from the American Diabetes Association and the American College of Cardiology Foundation. Diabetes Care. 2008;31(4):811–822. | |
Bays HE, Chapman RH, Grandy S. The relationship of body mass index to diabetes mellitus, hypertension and dyslipidaemia: comparison of data from two national surveys. Int J Clin Pract. 2007;61(5):737–747. | |
Lloyd-Jones D, Adams R, Carnethon M, et al. Heart disease and stroke statistics – 2009 update: a report from the American Heart Association Statistics Committee and Stroke Statistics Subcommittee. Circulation. 2009;119(3):e21–e181. | |
Kvan E, Pettersen KI, Sandvik L, Reikvam A. High mortality in diabetic patients with acute myocardial infarction: cardiovascular co-morbidities contribute most to the high risk. Int J Cardiol. 2007;121(2):184–188. | |
Morrish NJ, Wang SL, Stevens LK, Fuller JH, Keen H. Mortality and causes of death in the WHO Multinational Study of Vascular Disease in Diabetes. Diabetologia. 2001;44 Suppl 2:S14–S21. | |
Mendis S, Puska P, Norrving B, editors. Global Atlas on Cardiovascular Disease Prevention and Control. Geneva, Switzerland: World Health Organization; 2011. | |
Schultz DR, Arnold PI. Properties of four acute phase proteins: C-reactive protein, serum amyloid A protein, alpha 1-acid glycoprotein, and fibrinogen. Semin Arthritis Rheum. 1990;20(3):129–147. | |
Pepys MB, Hirschfield GM. C-reactive protein: a critical update. J Clin Invest. 2003;111(12):1805–1812. | |
Hage FG, Szalai AJ. C-reactive protein gene polymorphisms, C-reactive protein blood levels, and cardiovascular disease risk. J Am Coll Cardiol. 2007;50(12):1115–1122. | |
Murray RK, Bender DA, Botham KM, Kennelly PJ, Rodwell VW, Weil PA. Harper’s Illustrated Biochemistry. 28th ed. New York, NY, USA: McGraw-Hill Companies; 2009. | |
Ridker PM, Rifai N, Rose L, Buring JE, Cook NR. Comparison of C-reactive protein and low-density lipoprotein cholesterol levels in the prediction of first cardiovascular events. N Engl J Med. 2002;347(20):1557–1565. | |
Su SC, Pei D, Hsieh CH, Hsiao FC, Wu CZ, Hung YJ. Circulating pro-inflammatory cytokines and adiponectin in young men with type 2 diabetes. Acta Diabetol. 2011;48(2):113–119. | |
de Rekeneire N, Peila R, Ding J, et al. Diabetes, hyperglycemia, and inflammation in older individuals: the health, aging and body composition study. Diabetes Care. 2006;29(8):1902–1908. | |
Waheed P, Naveed AK, Farooq F. Levels of inflammatory markers and their correlation with dyslipidemia in diabetics. J Coll Physicians Surg Pak. 2009;19(4):207–210. | |
Bertoni AG, Burke GL, Owusu JA, et al. Inflammation and the incidence of type 2 diabetes: the Multi-Ethnic Study of Atherosclerosis (MESA). Diabetes Care. 2010;33(4):804–810. | |
Belfki H, Ben Ali S, Bougatef S, et al. Association between C-reactive protein and type 2 diabetes in a Tunisian population. Inflammation. 2012;35(2):684–689. | |
Ehiaghe AF, Agbonlahor DE, Tatfeng YM, Onikepe F, Oviasogie FE, Ehiaghe JI. Serum C reactive protein level in type 2 diabetes mellitus patients attending diabetic clinic in Benin City, Nigeria. Journal of Diabetes Mellitus. 2013;2013. | |
Misra DP, Das S, Sahu PK. Prevalence of inflammatory markers (high-sensitivity C-reactive protein, nuclear factor-kappaB, and adiponectin) in Indian patients with type 2 diabetes mellitus with and without macrovascular complications. Metab Syndr Relat Disord. 2012;10(3):209–213. | |
Barzilay JI, Abraham L, Heckbert SR, et al. The relation of markers of inflammation to the development of glucose disorders in the elderly: the Cardiovascular Health Study. Diabetes. 2001;50(10):2384–2389. | |
Hu FB, Meigs JB, Li TY, Rifai N, Manson JE. Inflammatory markers and risk of developing type 2 diabetes in women. Diabetes. 2004; 53(3):693–700. | |
Tabak AG, Kivimaki M, Brunner EJ, et al. Changes in C-reactive protein levels before type 2 diabetes and cardiovascular death: the Whitehall II study. Eur J Endocrinol. 2010;163(1):89–95. | |
Sam S, Haffner S, Davidson MH, et al. Relation of abdominal fat depots to systemic markers of inflammation in type 2 diabetes. Diabetes Care. 2009;32(5):932–937. | |
American Diabetes Association. Standards of medical care in diabetes. Diabetes Care. 2005;28 Suppl 1:S4–S36. | |
Nguyen NT, Magno CP, Lane KT, Hinojosa MW, Lane JS. Association of hypertension, diabetes, dyslipidemia, and metabolic syndrome with obesity: findings from the National Health and Nutrition Examination Survey, 1999 to 2004. J Am Coll Surg. 2008;207(6):928–934. | |
Abdullah A, Peeters A, de Courten M, Stoelwinder J. The magnitude of association between overweight and obesity and the risk of diabetes: a meta-analysis of prospective cohort studies. Diabetes Res Clin Pract. 2010;89(3):309–319. | |
Del Prato S, Enzi G, Vigili de Kreutzenberg S, et al. Insulin regulation of glucose and lipid metabolism in massive obesity. Diabetologia. 1990; 33(4):228–236. | |
Schuster DP. Obesity and the development of type 2 diabetes: the effects of fatty tissue inflammation. Diabetes Metab Syndr Obes. 2010;3:253–262. | |
Connelly PW, Hanley AJ, Harris SB, Hegele RA, Zinman B. Relation of waist circumference and glycemic status to C-reactive protein in the Sandy Lake Oji-Cree. Int J Obes Relat Metab Disord. 2003;27(3):347–354. | |
Baba MM, Kolawole BA, lkem RT, Arogundade FA, Yusuph H, Gezawa ID. Serum C-reactive protein in Nigerians with type 2 diabetes mellitus. Niger J Med. 2010;19(4):427–431. | |
Nabipour I, Vahdat K, Jafari SM, et al. Elevated high sensitivity C-reactive protein is associated with type 2 diabetes mellitus: the Persian Gulf Healthy Heart Study. Endocr J. 2008;55(4):717–722. | |
Sabanayagam C, Shankar A, Lim SC, Lee J, Tai ES, Wong TY. Serum C-reactive protein level and prediabetes in two Asian populations. Diabetologia. 2011;54(4):767–775. | |
Choi J, Joseph L, Pilote L. Obesity and C-reactive protein in various populations: a systematic review and meta-analysis. Obes Rev. 2013; 14(3):232–244. | |
Zhao Y, Lv G. Correlation of C-reactive protein level and obesity in Chinese adults and children: a meta-analysis. J Endocrinol Invest. 2013; 36(8):642–647. | |
Huffman FG, Whisner S, Zarini GG, Nath S. Waist circumference and BMI in relation to serum high sensitivity C-reactive protein (hs-CRP) in Cuban Americans with and without type 2 diabetes. Int J Environ Res Public Health. 2010;7(3):842–852. | |
Zaciragic A, Huskic J, Hadzovic-Dzuvo A, Valjevac A, Avdagic N, Mulabegovic N. Serum C-reactive protein concentration and measures of adiposity in patients with type 2 diabetes mellitus. Bosn J Basic Med Sci. 2007;7(4):322–327. | |
Baba MM, Balogun MO, Kolawole BA, Ikem RT, Arogundade FA, Adebayo RA. Relationship between C-reactive protein and body mass index in Nigerians with type II diabetes mellitus. Niger J Clin Med. 2012;4(3). | |
Unek IT, Bayraktar F, Solmaz D, et al. The levels of soluble CD40 ligand and C-reactive protein in normal weight, overweight and obese people. Clin Med Res. 2010;8(2):89–95. | |
Bullo M, Garcia-Lorda P, Megias I, Salas-Salvado J. Systemic inflammation, adipose tissue tumor necrosis factor, and leptin expression. Obes Res. 2003;11(4):525–531. | |
Furukawa S, Fujita T, Shimabukuro M, et al. Increased oxidative stress in obesity and its impact on metabolic syndrome. J Clin Invest. 2004; 114(12):1752–1761. | |
Ceriello A. New insights on oxidative stress and diabetic complications may lead to a “causal” antioxidant therapy. Diabetes Care. 2003; 26(5):1589–1596. | |
Arnalich F, Hernanz A, Lopez-Maderuelo D, et al. Enhanced acute-phase response and oxidative stress in older adults with type II diabetes. Horm Metab Res. 2000;32(10):407–412. | |
Alizadeh Dehnavi R, de Roos A, Rabelink TJ, et al. Elevated CRP levels are associated with increased carotid atherosclerosis independent of visceral obesity. Atherosclerosis. 2008;200(2):417–423. | |
Nordestgaard BG, Zacho J. Lipids, atherosclerosis and CVD risk: is CRP an innocent bystander? Nutr Metab Cardiovasc Dis. 2009;19(8):521–524. | |
Abubakar SA, Okubadejo NU, Ojo OO, Oladipo O, Ojini FI, Danesi MA. Relationship between admission serum C-reactive protein and short term outcome following acute ischaemic stroke at a tertiary health institution in Nigeria. Niger J Clin Pract. 2013;16(3):320–324. | |
Mooradian AD. Dyslipidemia in type 2 diabetes mellitus. Nat Clin Pract Endocrinol Metab. 2009;5(3):150–159. | |
Farmer JA. Diabetic dyslipidemia and atherosclerosis: evidence from clinical trials. Curr Diab Rep. 2008;8(1):71–77. | |
Valabhji J, Elkeles RS. Dyslipidemia in type 2 diabetes: epidemiology and biochemistry. Br J Diabetes Vasc Dis. 2003;3(3):184–189. | |
Mathura KC, Vaidya B, Gurbacharya DL. Study of serum lipid profile in type 2 diabetic patients attending KMCTH. Nepal Med Coll J. 2005; 7(2):97–100. | |
Barrett-Connor E, Grundy SM, Holdbrook MJ. Plasma lipids and diabetes mellitus in an adult community. Am J Epidemiol. 1982; 115(5):657–663. | |
Champe PC, Harvey RA. Lippincott’s Illustrated Reviews: Biochemistry. 3rd ed. Philadelphia, PA, USA: Lippincott Williams & Wilkins; 2005. | |
Ladeia AM, Adan L, Couto-Silva AC, Hiltner A, Guimaraes AC. Lipid profile correlates with glycemic control in young patients with type 1 diabetes mellitus. Prev Cardiol. 006;9(2):82–88. | |
Francisco G, Hernandez C, Chacon P, Mesa J, Simo R. [Factors influencing CRP levels in the diabetic population]. Med Clin (Barc). 2005;124(9):336–337. Spanish. | |
Pickup JC, Mattock MB, Chusney GD, Burt D. NIDDM as a disease of the innate immune system: association of acute-phase reactants and interleukin-6 with metabolic syndrome X. Diabetologia. 1997; 40(11):1286–1292. | |
Wen J, Liang Y, Wang F, et al. C-reactive protein, gamma-glutamyltransferase and type 2 diabetes in a Chinese population. Clin Chim Acta. 2010;411(3–4):198–203. | |
Li Z, Guo SQ, Liu WX, et al. [A case-control study on risk factors of type 2 diabetes mellitus related chronic complications in Baoding city]. Zhonghua Liu Xing Bing Xue Za Zhi. 2009;30(12):1292–1296. Chinese. |
Supplementary material
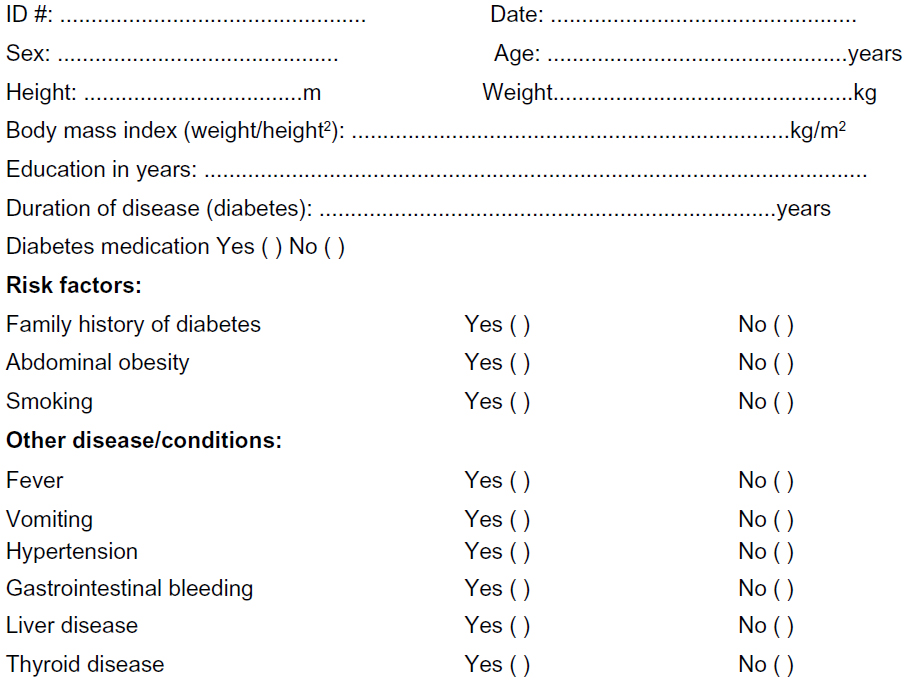 | Figure S1 Structured patient questionnaire. |
 © 2015 The Author(s). This work is published and licensed by Dove Medical Press Limited. The
full terms of this license are available at https://www.dovepress.com/terms
and incorporate the Creative Commons Attribution
- Non Commercial (unported, 3.0) License.
By accessing the work you hereby accept the Terms. Non-commercial uses of the work are permitted
without any further permission from Dove Medical Press Limited, provided the work is properly
attributed. For permission for commercial use of this work, please see paragraphs 4.2 and 5 of our Terms.
© 2015 The Author(s). This work is published and licensed by Dove Medical Press Limited. The
full terms of this license are available at https://www.dovepress.com/terms
and incorporate the Creative Commons Attribution
- Non Commercial (unported, 3.0) License.
By accessing the work you hereby accept the Terms. Non-commercial uses of the work are permitted
without any further permission from Dove Medical Press Limited, provided the work is properly
attributed. For permission for commercial use of this work, please see paragraphs 4.2 and 5 of our Terms.