Back to Journals » International Journal of Nanomedicine » Volume 13
Breath volatolomics for diagnosing chronic rhinosinusitis
Authors Broza YY, Braverman I, Haick H
Received 18 April 2018
Accepted for publication 25 May 2018
Published 14 August 2018 Volume 2018:13 Pages 4661—4670
DOI https://doi.org/10.2147/IJN.S171488
Checked for plagiarism Yes
Review by Single anonymous peer review
Peer reviewer comments 2
Editor who approved publication: Dr Thomas Webster
Yoav Y Broza,1,* Itzhak Braverman,2,* Hossam Haick1
1The Department of Chemical Engineering and Russell Berrie Nanotechnology Institute, Technion – Israel Institute of Technology, Haifa, Israel; 2The Otolaryngology – Head & Neck Surgery Unit, The Hillel Yaffe Medical Center, The Technion Faculty of Medicine, Hadera, Israel
*These authors contributed equally to this work
Purpose: Chronic rhinosinusitis (CRS) is one of the most common chronic diseases treated by primary care physicians. It is increasingly recognized that CRS and nasal polyposis (NP) comprise several disease processes with diverse causes. Hence, subgroups of sinusitis need to be differentiated so that patients can be screened appropriately and personalized medical treatment provided.
Patients and methods: To address this need, we use a cross-reactive nanoarray based on either molecularly modified gold nanoparticles or molecularly modified single-walled carbon nanotubes, combined with pattern recognition for analyzing breath samples. Breath samples were collected from three groups of volunteers (total 71) at the Hillel Yaffe Medical Center: CRS, NP, and control.
Results: Nanoarray results discriminated between patients with sinusitis and the control group with 87% sensitivity, 83% specificity, and 85% accuracy. The system also discriminated well between the subpopulations: 1) CRS vs control (76% sensitivity, 90% specificity); 2) CRS vs NP (82% sensitivity, 71% specificity); and 3) NP vs control (71% sensitivity, 90% specificity).
Conclusion: This preliminary study shows that a nanoarray-based breath test for screening population for sinusitis-related conditions is feasible.
Keywords: volatile organic compound, breath analysis, sensor, chronic sinusitis, nasal polyposis
Introduction
Sinusitis is one of the most common conditions treated by primary care physicians.1 Each year in the United States, sinusitis affects one in seven adults and has been diagnosed in 31 million patients.2 The direct costs of sinusitis, including medications, outpatient, and emergency department visits, are estimated at US$3 billion per year in the United States.2,3 The term “rhinosinusitis” is preferred because sinusitis is almost always accompanied by inflammation of the adjacent nasal cavity mucosa.4 Chronic rhinosinusitis (CRS) and nasal polyposis (NP) comprise several disease processes, and diagnosis and treatment differ significantly between CRS with and without nasal polyps.5 Hence, subgroups of sinusitis need to be differentiated so that patients can be screened appropriately and the best medical treatment provided.
In view of these unmet needs, we explore a promising approach to non-invasive, fast, and inexpensive CRS diagnostics. The approach relies on the so-called volatolomics, which deal with large-scale detection of volatile organic compounds (VOCs) emitted from different body sources6,7 and has previously shown clinical potential in other diseases.6,8–16
A chemical sensor using nanotechnology based materials as metal-nanoparticles, carbon-nanotubes, and conducting polymers could affect a direct transition from basic research to modern point-of-care practice,8,17–20 because chemical sensor formats are considerably smaller, simpler to use, and less costly than other sensing devices.
Here, we have conducted a small clinical trial and tested the possibility of diagnosing CRS via breath samples using a cross-reactive nanomaterial-based sensor array combined with pattern recognition (herein, nanoarray).
Patients and methods
The experimental setup is summarized in the flowchart in Figure 1.
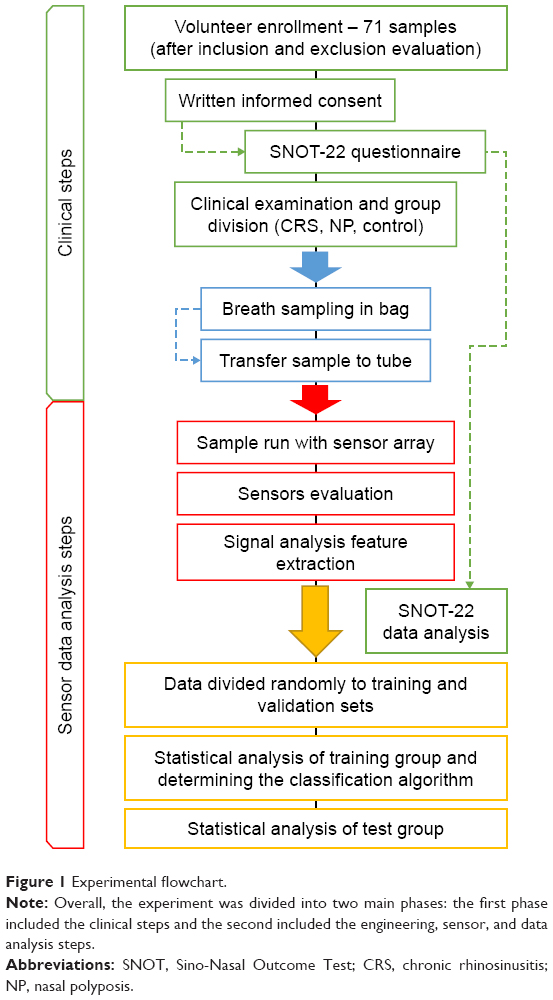 | Figure 1 Experimental flowchart. |
Patients
We planned a case–control study in which breath samples were collected from 71 volunteers at the Hillel Yaffe Medical Center (Hadera, Israel). The volunteers were enrolled after giving written informed consent and completing background and Sino-Nasal Outcome Test (SNOT-22) health condition questionnaires. The ethics committee of the Hillel Yaffe Medical Center (Hadera, Israel) approved volunteers’ enrollment (approval number 0037-14-HYMC) and the study protocol (NIH clinical registry NCT03379701). The study population consisted of two groups: sick (n=41) and control (n=30). The sick group comprised two main subgroups: CRS (n=17) and NP (n=24) (Table 1 and Supplementary material). Patients with NP were diagnosed by nasal examination rhinoscopy and nasal endoscopy. Some patients received medication (Supplementary material), and the influence of asthma on the results was assessed.
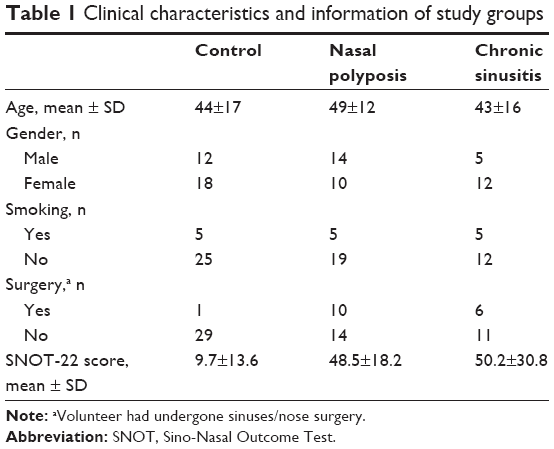 | Table 1 Clinical characteristics and information of study groups |
Breath samples
Exhaled breath was collected in a controlled, reproducible manner as reported previously.7 Briefly, inhaled air was cleared of ambient contaminants by passing through a mouthpiece connected to a charcoal-filter cartridge (Eco Medics AG, Duernten, Switzerland), and then, 750 mL of expired air was collected and trapped in two-bed Tenax®-TA/Carboxen®-1018 sorption tubes sealed with Swagelok® End-Fittings (Sigma-Aldrich Co., St Louis, MO, USA). We were also interested in the fraction of air arriving from the nasal compartment, so we collected a mixed breath sample (alveolar and dead space). The sealed tubes were stored at 4°C pending analysis.
Nanoarray analysis
VOCs trapped in the tubes were thermally desorbed using a TD-20 (Shimadzu Corporation, Kyoto, Japan ) and delivered into a stainless steel test chamber containing 37 nanomaterial-based sensors comprising either 1) molecularly modified gold nanoparticles or 2) molecularly modified single-walled carbon nanotubes. Subsequently, 11 different sensors were used for analysis. More details about the fabrication and modification of these sensors are provided in the Supplementary material and elsewhere.21–23 The interaction between the VOCs and the modified nanoparticle layers caused a reversible time-dependent change in electrical resistance, which was recorded and then normalized using a fixed standard daily calibration. The collected breath data were analyzed using the discriminant function analysis (DFA) method, and Student’s t-test was used to compare all breath samples using JMP 12.0.0 (SAS Institute Inc., Cary, NC, USA) (Supplementary material).
Results and discussion
Sino-nasal outcome test
The data were first examined using the accepted Sino-Nasal Outcome Test (SNOT-22), which was subsequently compared with our breath test. Analysis of the SNOT-22 questionnaire results revealed significant differences (using Student’s t-test) between the control group and both the CRS (P<0.0001) and the NP (P<0.0001) groups. However, there was no significant difference, as implied by the high P-value (P<0.6834), between the CRS and NP groups (Figure 2A). Analysis of each of the 22 questions in the form revealed the same difference between the control and the sick groups, and no question showed a meaningful difference between the two sick groups (Figure 2B). SNOT-22 is an effective tool for diagnosing sinus disease. However, our study shows it to be a poor predictor for differentiating between specific sinus diseases, in our case CRS and NP. These results stress the need of a better clinical test for evaluating sinusitis subgroups.
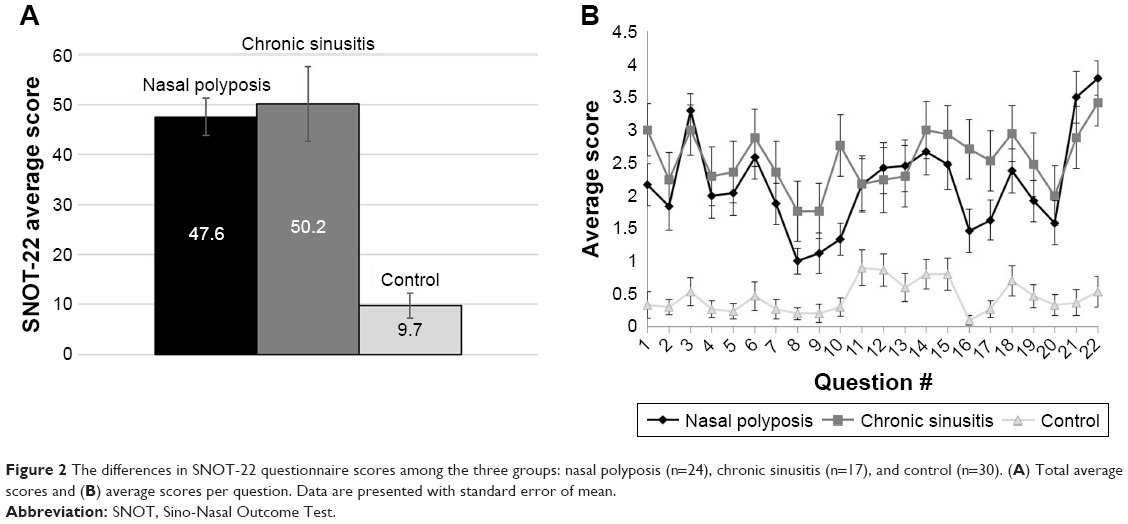 | Figure 2 The differences in SNOT-22 questionnaire scores among the three groups: nasal polyposis (n=24), chronic sinusitis (n=17), and control (n=30). (A) Total average scores and (B) average scores per question. Data are presented with standard error of mean. |
Nanoarray analysis
The output of the sensor array consists of a set of signals, each comprising “electrical resistance profile versus time”. These signals are automatically saved on a computation system and this is followed by feature extraction (see Methods and Supplementary material sections Description of the nanoarray and Statistical analysis). Four binary comparisons among the three groups were assessed and one comparison between total sick (CRS plus NP) and controls; the results are summarized in Figure 3A–D and Table 2. For each comparison, the software automatically excluded 30% of the samples, which served as a validation set (last four columns on each graph) and used 70% as a training set (first two columns on each graph). The DFA model on the training set receiver operating characteristic (ROC) curve was determined, and then analysis was performed and cutoff values were set accordingly. This allowed the validation set to be classified as true positive, false negative, true negative, or false positive. In each binary comparison, one group is defined as positive (condition group) and the other as negative (control group). Accuracy is defined as the percentage of all tested samples correctly identified in the model (true positive and true negative). The calculated accuracy of the VOC test is correlated with the categorization predefined by gold standard clinical practice (ie, medical history [anamnesis], clinical examination, endoscopic examination, and computed tomography). Sensitivity is the proportion of true-positive samples identified by the gold standard that are correctly identified as positive by the breath test. Specificity is the proportion of true-negative samples identified by the gold standard that are correctly identified as negative by breath test. Positive predictive value (PPV) is the proportion of samples predicted by the breath test to be positive that are identified as positive. Negative predictive value (NPV) is the proportion of samples predicted by the breath test to be negative that are identified as negative (additional equations for calculating parameters are defined in the footnotes of Table 2).
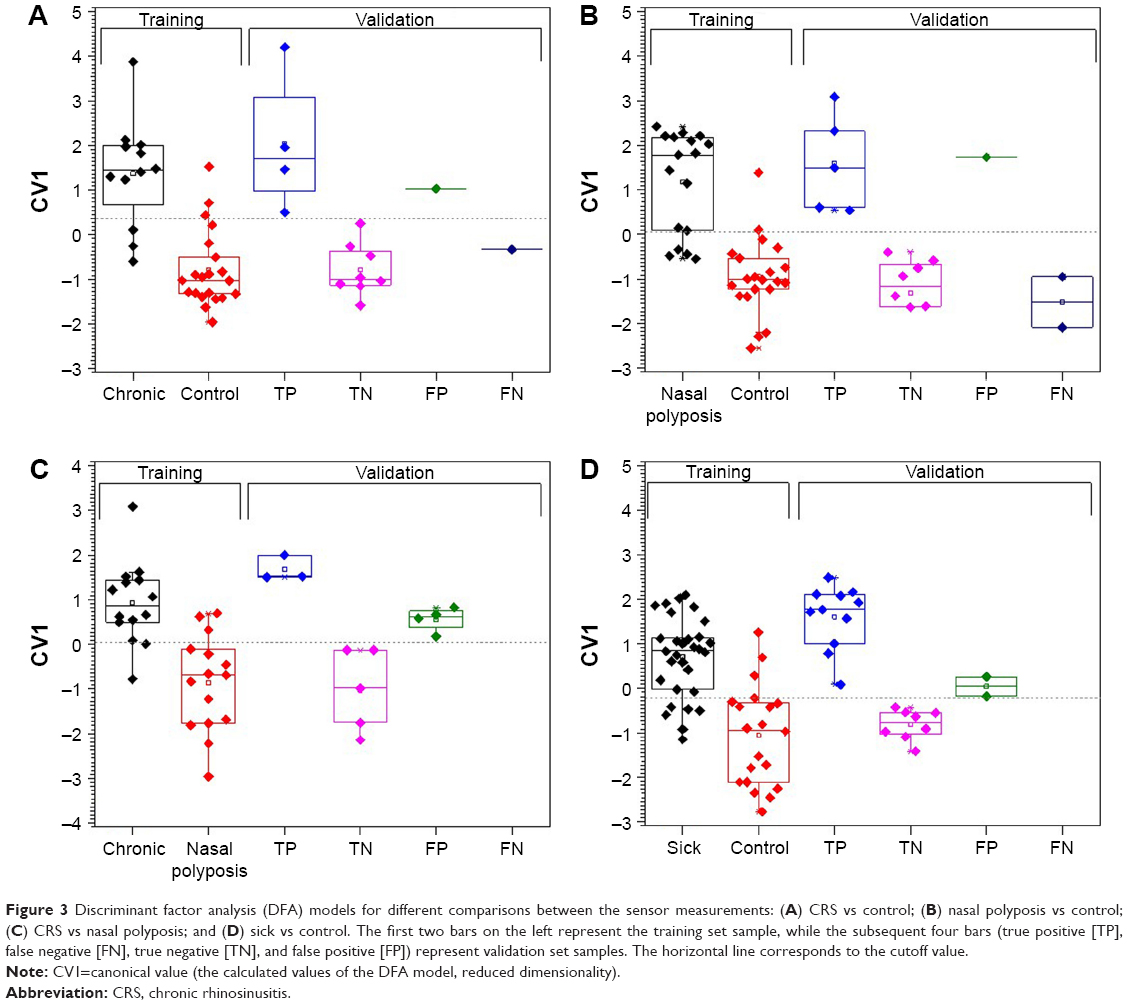 | Figure 3 Discriminant factor analysis (DFA) models for different comparisons between the sensor measurements: (A) CRS vs control; (B) nasal polyposis vs control; (C) CRS vs nasal polyposis; and (D) sick vs control. The first two bars on the left represent the training set sample, while the subsequent four bars (true positive [TP], false negative [FN], true negative [TN], and false positive [FP]) represent validation set samples. The horizontal line corresponds to the cutoff value. |
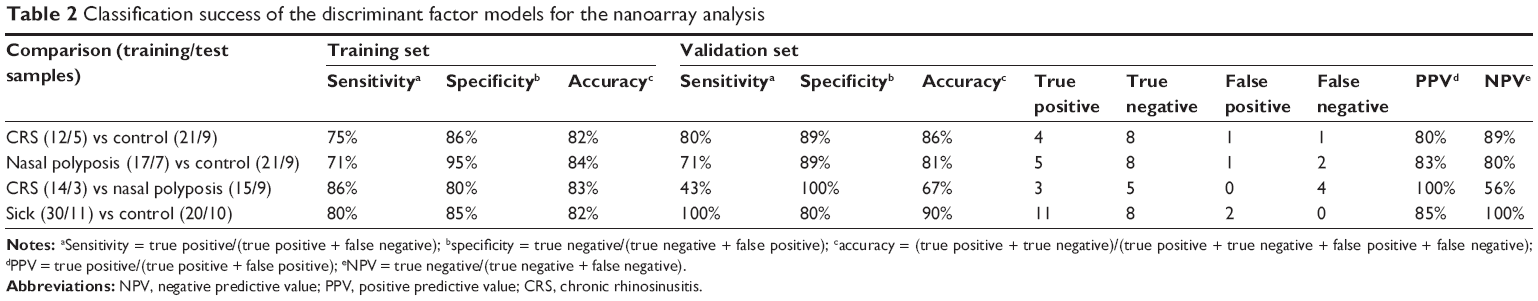 | Table 2 Classification success of the discriminant factor models for the nanoarray analysis |
Training set accuracy was in the range 82%–84%, with specificity up to 95% between NP and control and sensitivity up to 86% between CRS and NP groups. In the validation set, the highest accuracy was in sick vs control (90%) with 100% NPV, followed by 86% in CRS vs control, 81% in NP vs control, and 67% in CRS vs NP. Sensitivity of 100% was achieved for all sick vs control, and 100% specificity was achieved for CRS vs NP with 100% PPV (in this comparison the CRS group was defined as positive and the NP group as negative; therefore, 100% specificity means the model correctly predicted all samples that were positive for NP). Also, a non-binary analysis of all three groups together gave good results with 72% accuracy in the training set and 80% in the validation set.
We further tested confounding and clinically related factors (gender, smoking, ethnicity, and background asthma) to assess model validity. Comparison of confounding factors in sick vs control cases gave random or below the discrimination rate in the training and validation sets, supporting the validity of the sinusitis classification. Accuracies in the training and validation sets were as follows: smoking, 56% and 29%; gender, 60% and 38%; ethnicity, 50% and 24%; and asthma, 68% and 52% (Table 3). These results show that the model developed is not affected by most confounding factors, and the classification of the study populations is indeed attributable to clinical status (sick or control) and not, for example, to smoking. The training set for asthmatic patients showed 68% accuracy, which is above random and could relate to the influence of the sampling procedure on asthmatics. This possibility will need to be further examined in future studies, though the results in the validation set were scaled randomly (52%).
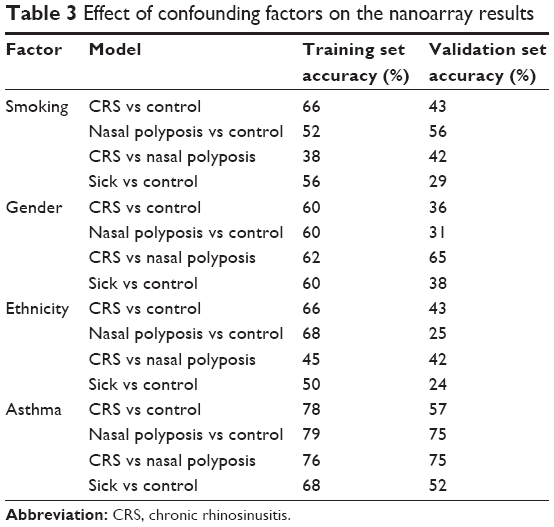 | Table 3 Effect of confounding factors on the nanoarray results |
Our study is a preliminary step forward in the diagnostics of sinusitis. We show that the nanoarray-based breath test is an effective predictive tool. The sinuses are part of the nasal cavity that is subject to continual airflow from the respiratory tract. This makes it clinically logical to try to detect sinusitis infections by VOC analysis using breath/nasal samples.
One cause of breath-VOC changes in CRS could be related to high prevalence of CRS in patients with metabolic syndrome who also suffer from extensive lipid peroxidation yielding volatile metabolic byproducts.24,25 However, nasal and paranasal sinus diseases have yet to be addressed by such an approach. One of our main goals was to discriminate between CRS and NP. In the validation set, our results showed 67% accuracy for this test, which is an average outcome. The accuracy in this case was lower because some CRS samples were incorrectly classified as NP. However, all NP samples were correctly identified by the breath test (100% specificity), and there were no false-positives for NP, resulting in 100% NPV, which are excellent outcomes. A possible explanation for these results is a partial overlap between CRS and NP owing to obstruction of the sinuses and nose by secondary infections in patients with nasal polyps.
The importance of such a diagnostic test is the ability to discriminate between the two diseases for targeted treatment at very early stages, even in subclinical conditions. This could lead to a change in clinic practice, and differentiation between CRS and NP could bring about a change in the management of the patients. CRS patients will receive antibiotics and NP patients will be treated with nasal steroids or a biological therapy such as dupilumab, a human monoclonal antibody against interleukins 4 and 13. For example, Bachert et al26 discussed the success of biological treatments (subcutaneous dupilumab) on the nasal polyp burden in patients with CRS and NP. They evaluated the effects of supplementary dupilumab for nasal polyps and chronic sinusitis, and it could be concluded that early differentiation between the subtypes of sinusitis could be important for improving the future outcomes of such biological treatments. The second goal was to screen between sick (sinusitis) and non-sick samples, and very good results were achieved for this. Therefore, an early-stage diagnostic test, such as the breath test, suggested here could contribute toward both objectives.
Study limitations
Our study had several limitations. We employed a case–control design, which could have led to overestimation of such parameters as specificity and sensitivity, so the results should be interpreted cautiously. Nonetheless, the design was appropriate for this preliminary stage. While we used different statistical tools to address the possible limitations, we are conscious of the limited sample size, and future large population studies are needed for statistical validation. Furthermore, while we investigated confounding factors including background conditions such as asthma, other conditions and medication, such as laryngopharyngeal reflux and anti-inflammatory therapies, could also affect the exhaled samples. These possibilities could not be subjected to statistical scrutiny here owing to the limited number of samples; they will need to be addressed in a larger cohort. Such future studies should include naïve, newly diagnosed patients who are sampled before any treatment. Lastly, additional chemical analysis using techniques, such as gas chromatography/mass spectrometry, will be needed for better understanding of the disease VOC profile and identification of possible biomarkers, currently not available.
Conclusion
In summary, our preliminary study demonstrates the feasibility of a nanoarray-based breath test for screening populations for sinusitis-related conditions. The results could open a new, simple, and promising avenue for diagnosing chronic sinusitis and distinguishing it from other related conditions such as NP. In view of the different clinical manifestations and agents causing the disease, a test of this kind could help toward the development of personalized medical treatment. Our experiments demonstrate that the novel “volatolomic” approach has the potential to lead the personalized diagnoses. Nevertheless, for “volatolomic” diagnostics to enter clinical practice, methods that enable point-of-care devices, such as chemosensory-based VOC detection to be realized should be embraced.
Acknowledgment
The authors thank Prof Dr Claus Bachert, Department of Oto-rhino-laryngology and Logopaedic-audiologic Sciences, for helpful discussions.
Disclosure
The authors report no conflicts of interest in this work.
References
Aring AM, Chan MM. Acute rhinosinusitis in adults. Am Fam Physician. 2011;83(9):1057–1063. | ||
Rosenfeld RM, Andes D, Bhattacharyya N, et al. Clinical practice guideline: adult sinusitis. Otolaryngol Head Neck Surg. 2007;137(3 Suppl):S1–S31. | ||
Anon JB, Jacobs MR, Poole MD, et al. Antimicrobial treatment guidelines for acute bacterial rhinosinusitis. Otolaryngol Head Neck Surg. 2004;130(1 Suppl):1–45. | ||
Bhattacharyya N. Chronic rhinosinusitis: is the nose really involved? Am J Rhinol. 2001;15(3):169–173. | ||
Bachert C, Pawankar R, Zhang L, et al. ICON: chronic rhinosinusitis. World Allergy Organ J. 2014;7(1):25. | ||
Broza YY, Mochalski P, Ruzsanyi V, Amann A, Haick H. Hybrid volatolomics and disease detection. Angew Chem Int Ed Engl. 2015;54(38):11036–11048. | ||
Broza YY, Zuri L, Haick H. Combined volatolomics for monitoring of human body chemistry. Sci Rep. 2014;4:4611. | ||
Broza YY, Haick H. Nanomaterial-based sensors for detection of disease by volatile organic compounds. Nanomedicine (Lond). 2013;8(5):785–806. | ||
Nakhleh MK, Amal H, Jeries R, et al. Diagnosis and classification of 17 diseases from 1404 subjects via pattern analysis of exhaled molecules. ACS Nano. 2017;11(1):112–125. | ||
Amal H, Leja M, Funka K, et al. Detection of precancerous gastric lesions and gastric cancer through exhaled breath. Gut. 2016;65(3):400–407. | ||
Broza YY, Har-Shai L, Jeries R, et al. Exhaled breath markers for nonimaging and noninvasive measures for detection of multiple sclerosis. ACS Chem Neurosci. 2017;8(11):2402–2413. | ||
Broza YY, Kremer R, Tisch U, et al. A nanomaterial-based breath test for short-term follow-up after lung tumor resection. Nanomedicine. 2013;9(1):15–21. | ||
Ionescu R, Broza Y, Shaltieli H, et al. Detection of multiple sclerosis from exhaled breath using bilayers of polycyclic aromatic hydrocarbons and single-wall carbon nanotubes. ACS Chem Neurosci. 2011;2(12):687–693. | ||
Nakhleh MK, Jeries R, Gharra A, et al. Detecting active pulmonary tuberculosis with a breath test using nanomaterial-based sensors. Eur Respir J. 2014;43(5):1522–1525. | ||
Xu ZQ, Broza YY, Ionsecu R, et al. A nanomaterial-based breath test for distinguishing gastric cancer from benign gastric conditions. Br J Cancer. 2013;108(4):941–950. | ||
Haick H, Broza YY, Mochalski P, Ruzsanyi V, Amann A. Assessment, origin, and implementation of breath volatile cancer markers. Chem Soc Rev. 2014;43(5):1423–1449. | ||
Nakhleh MK, Broza YY, Haick H. Monolayer-capped gold nanoparticles for disease detection from breath. Nanomedicine (Lond). 2014;9(13):1991–2002. | ||
Zhang YX, Gao G, Liu HJ, et al. Identification of volatile biomarkers of gastric cancer cells and ultrasensitive electrochemical detection based on sensing interface of Au-Ag alloy coated MWCNTs. Theranostics. 2014;4(2):154–162. | ||
Chen YS, Zhang YX, Pan F, et al. Breath analysis based on surface-enhanced Raman scattering sensors distinguishes early and advanced gastric cancer patients from healthy persons. ACS Nano. 2016;10(9):8169–8179. | ||
Konvalina G, Haick H. Sensors for breath testing: from nanomaterials to comprehensive disease detection. Acc Chem Res. 2014;47(1):66–76. | ||
Peng G, Tisch U, Adams O, et al. Diagnosing lung cancer in exhaled breath using gold nanoparticles. Nat Nanotechnol. 2009;4(10):669–673. | ||
Wang B, Sonar P, Manzhos S, Haick H. Diketopyrrolopyrrole copolymers based chemical sensors for the detection and discrimination of volatile organic compounds. Sens Actuators B Chem. 2017;251:49–56. | ||
Zilberman Y, Ionescu R, Feng X, Mullen K, Haick H. Nanoarray of polycyclic aromatic hydrocarbons and carbon nanotubes for accurate and predictive detection in real-world environmental humidity. ACS Nano. 2011;5(8):6743–6753. | ||
Domagala B, Hartwich J, Szczeklik A. Incides of lipid peroxidation in patients with hypercholesterolemia and hypertriglyceridemia. Wien Klin Wochenschr. 1989;101(12):425–428. | ||
Lee EJ, Hwang HJ, Jung CM, Kim MK, Kang MS, Kim KS. The relationship between chronic rhinosinusitis and metabolic syndrome. Am J Rhinol Allergy. 2017;31(4):222–227. | ||
Bachert C, Mannent L, Naclerio RM, et al. Effect of subcutaneous dupilumab on nasal polyp burden in patients with chronic sinusitis and nasal polyposis: a randomized clinical trial. JAMA. 2016;315(5):469–479. |
Supplementary materials
Methods
Volunteer enrollment
A heterogeneous group of 71 volunteers (aged 20–78 years, mixed gender, ethnicity, smoking habits) was enrolled in the study at the Medical Center Hillel Yaffe (Hadera, Israel). All volunteers were enrolled after giving written informed consent and completing a short questionnaire regarding general background information (eg, age, gender, and smoking status) and a Sino-Nasal Outcome Test (SNOT-22) health condition questionnaire in accordance with approved guidelines. The population tested comprised three groups: chronic sinusitis, nasal polyposis, and control. The population characteristics are summarized in Table 1. Chronic sinusitis cases had either a bacterial or an allergic source, and the sinusitis group was defined by clinical presentation (medical history [anamnesis], clinical examination, endoscopic examination, computed tomography) and not by microbiological samples. Exclusion criteria for this study were: patients aged 18 years or under; pregnant women; presence of HIV, hepatitis, or any other potentially severe infectious or serious diseases; cystic fibrosis; immunocompromised status; pulmonary disease; history of head and neck radiation therapy; and history of sinus surgery. These conditions could affect the basis of chronic sinusitis with or without polyposis and influence the exhaled samples owing to changes in the microflora.
Some of the patients were treated with medications including: 15 patients of the 24 nasal polyposis group used steroids, nasal steroid sprays (fluticasone furoate (Avamys) 27.5 μg/spray, nasal spray suspension, twice a day), statins, proton-pump inhibitor, bronchodilators, insulin, aspirin; and two patients took vitamins. One patient suffered proton-pump inhibitor because of reflux. Four patients used inhalers for asthma and allergic rhinitis and we considered this too. Six of the 17 patients in the chronic sinusitis group used antihypertensive drugs: elthroxin, Ritalin, or Coumadin. Six took vitamins; one patient used an inhaler for asthma. Thirteen of the 30 patients in the control group used antihypertensive drugs: elthroxin, aspirin, glucophage, statins, antianxiety drugs, methotrexate, or duretics. Three patients took vitamins. Patients on non-steroid immunosuppressive therapy were not included.
Food, beverages, and smoking were withheld less than 1 h prior to the test. The ethics committee (approval number 0037-14-HYMC) of the Hillel Yaffe Medical Center (Hadera, Israel) approved the volunteers’ enrollment and the study protocol.
Collection of breath samples
Exhaled breath was collected in a controlled, reproducible manner from all volunteers. Inhaled air was cleared of ambient contaminants by repeatedly inhaling to total lung capacity for 3 min through a mouthpiece connected to a scrubber cartridge set on the inlet port (Eco Medics, Duerten, Switzerland), which removed 99.99% of exogenous compounds from the room air during inspiration and reduced the concentration of any potential exogenous volatile organic compounds (VOCs). Immediately after the lung washout, subjects exhaled through the exhalation port of the mouthpiece. The exhaled breath consisted of alveolar air and respiratory dead space air. In this study, we were interested in the dead space air arriving from the nasal compartment, so a mixed sample was captured in a 750 mL Mylar bag (Quintron Instrument Co., Inc., Milwaukee, WI, USA). The breath collection described is a single-step process requiring no action from the volunteer except inhaling and exhaling through the mouthpiece. Immediately after the breath collection, the VOCs in the samples were trapped and pre-concentrated in two-bed Tenax® TA/Carboxen® 1,018 sorption tubes (glass thermal desorption (TD) tube, preconditioned, outer diameter × length 1/4 in × 31/2 in, sealed with Swagelok® End-Fittings from Sigma-Aldrich Co. [St Louis, MO, USA]) by pumping the content of each collection bag through a sorbent tube (flow rate: 100 mL/min). The sorbent tubes were stored at 4°C until they were analyzed.
Sample characterization
Breath samples were characterized by VOC analysis using nanoarray-based sensors. An array of 37 nanomaterial-based sensors, combined with a statistical multivariate data analysis algorithm (see Statistical analysis section), was used to identify VOC patterns specific for each participant. The sensors were based on gold nanoparticle (GNPs) layers with 11 different organic ligands and quasi-2D random networks of single-walled carbon nanotubes (RN-SWCNTs) capped with either two different organic overlayers1,2 or one of diketopyrrolopyrrole (DPP).3
The Tenax® TA/Carboxen™ 1018 glass TD tube for each volunteer was introduced into the sensor array chamber specially assembled to a TD system so that the TD tube content could be desorbed directly to the sensor chamber. For desorption, the TD tubes were heated for 10 min at 250°C, and the VOCs were trapped on a Tenax cold trap at 0°C using a TD-20 (Shimadzu Ltd.). The samples were injected into the columnless gas chromatography-system in direct (splitless) mode at a constant 3 mL/min total flow. The breath samples from the TD were then delivered via a six-way Valco™ valve equipped with a 10 mL stainless steel loop (VICI®; Valco Instruments Company Inc., Houston, TX, USA) into a stainless steel test chamber containing the array of 37 cross-reactive nanoarray described in the Description of the nanoarray section. The test chamber was evacuated between exposures to discharge any VOCs left over and adsorbed on the sensors’ organic layer. A Keithley 2,701 DMM data acquisition/data-logging system was used to measure the resistance of all the sensors as a function of time. The sensors’ baseline responses were recorded for 5 min in vacuum, 5 min under clean nitrogen (99.999%), 5 min in vacuum, 5 min under sample exposure, and then another 5 min in vacuum. To detect possible failures of the sensors and to neutralize slight drifts of their baseline conditions caused by aging and/or poisoning, the sensors were calibrated each run day by exposing the sensors to a known calibration gas mixture containing 1.2 ppm 2-ethylhexanol, 23.8 ppm isopropyl alcohol, and 6.3 ppm 1,2,4-trimethylbenzene during the experiment.
Exposure of the nanoparticle sensors to the VOC samples or the calibration compounds resulted in rapid and fully reversible changes in the electrical resistance. Two sensing features were read out from the time-dependent resistance response of each sensor that related to the normalized resistance change at the end of the exposure (with respect to the value of sensors’ resistance in vacuum prior to the exposure) and to the area beneath the time-dependent resistance response during the exposure period.
Each sensor responded to all (or a certain subset) of the VOCs found in the exhaled breath samples.
Description of the nanoarray
The nanomaterial-based sensor array used to analyze the VOC samples contained cross-reactive, chemically diverse chemiresistors based on two types of nanomaterials: 1) organically stabilized spherical GNPs (core diameter: 3–4 nm) and 2) RN-SWCNTs. The system was made chemically diverse by 37 different sensors with either similar or different basic organic functionalities (19 for the GNP sensors and six for the SWCNT sensors). The organic ligands of the GNPs provided broadly cross-selective absorption sites for the breath VOCs.1,4 The GNPs used were synthesized as described by Peng et al and Dovgolevsky et al,1,5 and generally dispersed in toluene. Chemiresistive layers were formed by drop-casting the solution on to semi-circular microelectronic transducers until a resistance of several MΩ was reached. The device was dried for 2 h at ambient temperature and then baked overnight at 50°C in a vacuum oven. The microelectronic transducers consisted of 10 pairs of circular interdigitated gold electrodes on silicon with 300 nm thermal oxide (Silicon Quest International, Reno, NV, USA). The outer diameter of the circular electrode area was 3 mm, and the gap between two adjacent electrodes and the width of each electrode were both 20 nm.
The RN-SWCNT sensors used were based on electrically continuous random networks of SWCNTs formed by drop-casting a solution of the SWCNTs in dimethylformamide (>98% purity; Sigma Aldrich Co.) on to the pre-prepared electrical transducers. After the deposition, the devices were slowly dried overnight under ambient conditions to enhance the self-assembly of the SWCNTs and evaporate the solvent. The procedure was repeated until a resistance of 100 KΩ to 10 MΩ was obtained. The microelectronic transducers for the SWCNT sensors consisted of 10 pairs of 4.5 mm wide, interdigitated Ti/Pd electrodes on silicon with 2 μm of thermal oxide (Silicon Quest International). The gap between two adjacent electrodes was 100 nm. The SWCNT sensors were organically functionalized with cap layers composed of two polycyclic aromatic hydrocarbon (PAH, aka HBC) derivatives. HBC-C12 and PAH-3 contain hydrophobic mesogens that are terminated with alkyl chains and functionalized with ester.2 Alternatively, the SWCNTs were topped with an organic polymer layer DPP. Here, an ambipolar copolymer PDPP–TBT constituted using DPP and benzothidiazole acceptor in the main chain was used. After SWCNT drop casting, the polymer (8 mg/mL in chloroform) was applied by spin coating on the CNT at 5,000 rpm. Complete data on the polymer preparation are previously published.3 The GNP and SWCNT sensors used in this study responded rapidly and reversibly when exposed to typical VOCs in the sample.2 We also confirmed that they had a very low response to water.1,2,6 Subsequently, 11 different sensors were used for analysis: nine GNP, one PAH, and one DPP.
Statistical analysis (sensor array)
The array originally consisted of 40 sensors. After running the samples and testing the electrical signals received, that is, the resistance of the various sensors, it was decided to remove three sensors that showed either no responses, or irregular signal responses, or noise readings. All remaining 37 sensors in the array responded to all (or a certain subset) of the VOCs found in the exhaled breath samples. Specific patterns and predictive models for the volatile print of each volunteer were studied and derived from the sensor array output using discriminant function analysis (DFA), and Student’s t-test was used for comparisons of all breath samples. Subsequently, 11 different sensors were used for analysis. For the DFA analysis, the data were randomly divided into a training set (70% of samples) and validation set (30%). The model was then built using the DFA algorithm, and the resulting classifier was assessed on the basis of the validation set using receiver operating characteristic (ROC) curve analysis. The validation set was categorized according to the ROC curve-derived Youden’s cutoff point, allowing it to be classified (true positive, false negative, true negative, and false positive). The sensitivity, specificity, accuracy, positive predictive value, and negative predictive value were calculated for the training and validation sets. All statistical analysis was done using JMP, version 12.0.0 (SAS Institute Inc., Cary, NC, USA, 1989–2005).
References
Peng G, Tisch U, Adams O, et al. Diagnosing lung cancer in exhaled breath using gold nanoparticles. Nat Nanotechnol. 2009;4(10):669–673. | ||
Zilberman Y, Ionescu R, Feng X, Mullen K, Haick H. Nanoarray of polycyclic aromatic hydrocarbons and carbon nanotubes for accurate and predictive detection in real-world environmental humidity. ACS Nano. 2011;5(8):6743–6753. | ||
Wang B, Sonar P, Manzhos S, Haick H. Diketopyrrolopyrrole copolymers based chemical sensors for the detection and discrimination of volatile organic compounds. Sens Actuators B Chem. 2017;251:49–56. | ||
Peng G, Hakim M, Broza YY, et al. Detection of lung, breast, colorectal, and prostate cancers from exhaled breath using a single array of nanosensors. Br J Cancer. 2010;103(4):542–551. | ||
Dovgolevsky E, Tisch U, Haick H. Chemically sensitive resistors based on monolayer-capped cubic nanoparticles: towards configurable nanoporous sensors. Small. 2009;5(10):1158–1161. | ||
Bachar N, Mintz L, Zilberman Y, et al. Polycyclic aromatic hydrocarbon for the detection of nonpolar analytes under counteracting humidity conditions. ACS Appl Mater Interfaces. 2012;4(9):4960–4965. |
 © 2018 The Author(s). This work is published and licensed by Dove Medical Press Limited. The
full terms of this license are available at https://www.dovepress.com/terms
and incorporate the Creative Commons Attribution
- Non Commercial (unported, 3.0) License.
By accessing the work you hereby accept the Terms. Non-commercial uses of the work are permitted
without any further permission from Dove Medical Press Limited, provided the work is properly
attributed. For permission for commercial use of this work, please see paragraphs 4.2 and 5 of our Terms.
© 2018 The Author(s). This work is published and licensed by Dove Medical Press Limited. The
full terms of this license are available at https://www.dovepress.com/terms
and incorporate the Creative Commons Attribution
- Non Commercial (unported, 3.0) License.
By accessing the work you hereby accept the Terms. Non-commercial uses of the work are permitted
without any further permission from Dove Medical Press Limited, provided the work is properly
attributed. For permission for commercial use of this work, please see paragraphs 4.2 and 5 of our Terms.