Back to Journals » International Journal of Nephrology and Renovascular Disease » Volume 11
BOLD magnetic resonance imaging in nephrology
Authors Hall ME, Jordan JH, Juncos LA, Hundley WG, Hall JE
Received 15 August 2017
Accepted for publication 20 December 2017
Published 13 March 2018 Volume 2018:11 Pages 103—112
DOI https://doi.org/10.2147/IJNRD.S112299
Checked for plagiarism Yes
Review by Single anonymous peer review
Peer reviewer comments 2
Editor who approved publication: Professor Pravin Singhal
Michael E Hall,1,2 Jennifer H Jordan,3 Luis A Juncos,1,2 W Gregory Hundley,3 John E Hall2
1Department of Medicine, University of Mississippi Medical Center, Jackson, MS, USA; 2Department of Physiology and Biophysics, University of Mississippi Medical Center, Jackson, MS, USA; 3Department of Internal Medicine, Section on Cardiovascular Medicine, Wake Forest University School of Medicine, Winston-Salem, NC, USA
Abstract: Magnetic resonance (MR) imaging, a non-invasive modality that provides anatomic and physiologic information, is increasingly used for diagnosis of pathophysiologic conditions and for understanding renal physiology in humans. Although functional MR imaging methods were pioneered to investigate the brain, they also offer powerful techniques for investigation of other organ systems such as the kidneys. However, imaging the kidneys provides unique challenges due to potential complications from contrast agents. Therefore, development of non-contrast techniques to study kidney anatomy and physiology is important. Blood oxygen level-dependent (BOLD) MR is a non-contrast imaging technique that provides functional information related to renal tissue oxygenation in various pathophysiologic conditions. Here we discuss technical considerations, clinical uses and future directions for use of BOLD MR as well as complementary MR techniques to better understand renal pathophysiology. Our intent is to summarize kidney BOLD MR applications for the clinician rather than focusing on the complex physical challenges that functional MR imaging encompasses; however, we briefly discuss some of those issues.
Keywords: functional MRI, kidney, oxygenation, chronic kidney disease
Introduction
In the early 1990s, Ogawa et al noted intra-voxel dephasing of the water signals of blood and the surrounding tissues due to magnetic field susceptibility from paramagnetic deoxyhemoglobin of anoxic rodent brains.1 The paramagnetic deoxyhemoglobin in venous blood was used as an intrinsic contrast agent to initially track changes in brain blood oxygenation due to anesthetic gases and insulin-induced hypoglycemia in rodents under high magnetic field strengths (i.e., 4.7–7.0 T).2 Over the next few years, brain blood oxygen level-dependent (BOLD) imaging was integrated at lower field strengths such as 1.5 T. In 1995, Karni et al reported use of BOLD magnetic resonance (MR) to evaluate neural changes involved in primary motor cortex activity in response to motor practice sessions.3 Subsequently, BOLD MR has been used to study brain responses to many stimuli in experimental animals and humans.
BOLD MR has also been used to study oxygenation of the kidneys and, by inference, renal blood flow and tubular transport functions, which are difficult to study non-invasively in humans. BOLD MR has been especially useful for studying the renal medulla, which is known to function under hypoxic conditions due to high metabolic activity of the thick ascending loop of Henle and low medullary blood flow. The low oxygen levels in the renal medulla are believed to make this region of the kidney especially susceptible to acute injury during ischemia or other insults.4
Since much of the metabolic activity of the renal medulla is indirectly linked to transport of sodium chloride (NaCl) in the thick ascending loop of Henle, inhibitors of loop transport have been used in combination with measurements of renal medullary oxygenation to assess renal medullary function in various pathophysiologic conditions. Invasive experiments using glass microelectrodes to directly measure renal cortical and medullary oxygenation were performed in rodent models during administration of the loop diuretic furosemide, which blocks sodium-potassium-2 chloride (Na-K-2Cl) transport in the thick ascending loop of Henle, ultimately decreasing basolateral membrane NaCl transport and oxygen consumption and increasing renal medullary tissue oxygenation. Similarly, administration of the proximal tubular diuretic acetazolamide increases renal cortical oxygenation. Although the changes in oxygenation were partly due to increased renal blood flow, improvements in renal tissue oxygenation were largely mediated by reduced oxygen consumption due to the diuretics.
In 1997, Prasad et al conducted seminal studies using BOLD MR to monitor changes in intrarenal oxygenation in humans.5 Similar to the rodent models using microelectrode measures of oxygenation, they found that furosemide administration increased renal medullary tissue oxygenation in young, healthy humans. Since this work, functional imaging of the kidneys using BOLD MR has been implemented in several human studies of renal pathophysiology.
Technical considerations
BOLD MR signal intensity employs measurement of R2*, the transverse magnetization decay time that is proportional to the tissue content of deoxyhemoglobin. Tissue deoxyhemoglobin increases field inhomogeneity and therefore signal decay. Hemoglobin oxygenation is proportional to the partial pressure of oxygen (PO2) of blood and in equilibrium with tissue PO2. Therefore, R2* is an indicator of tissue hypoxia (i.e., higher R2* signal intensity ≈ more tissue hypoxia). Conversely, T2* (= 1/R2*) is a measure of tissue oxygenation (i.e., higher T2* signal intensity ≈ higher tissue oxygenation).
Use of BOLD signal intensity is based on the assumption that blood oxygenation and tissue oxygenation are in equilibrium. Supporting this assumption is the finding that there was a linear correlation between cortical and medullary R2* levels and renal tissue PO2 measured invasively in pigs with microelectrodes.6 This study and others suggest that BOLD MR offers a reliable non-invasive method to assess dynamic and regional changes in renal tissue oxygenation.
Spatial resolution should be considered, particularly when comparing quantitative R2* or T2* values across studies. Rossi et al nicely detailed the effects of spatial resolution and non-BOLD effects on the R2* signal.7 Their study of 17 healthy volunteers compared parametric R2* values at 1.5T and 3T with variable resolutions and demonstrated a dependence of the apparent R2* relaxation rate on spatial resolution. Reductions of in-plane resolution from 1.2 × 1.2 mm to 3.0 × 3.0 mm (constant slice thickness of 4 mm) yielded an increase in renal R2* values for 1.5T (15%) and 3T (12%) field strengths, albeit less of an increase in the 3T magnet. Similarly, increasing slice thickness from 3 mm to 8 mm with a constant in-plane resolution of 1.5 × 1.5 mm resulted in a maximal increase of the R2* of 30% at 1.5T and 26% at 3T. Therefore, increasing spatial resolution attenuates the effect of field inhomogeneity. Other factors such as signal-to-noise ratio also appear to be important. Magnetic field imperfections or the interface between tissues with differing magnetic properties can cause magnetic field inhomogeneity and subsequently overestimation of R2* values.7
BOLD MR imaging has been utilized to assess renal oxygenation during administration of a loop diuretic challenge in several pathophysiologic conditions. Renal medullary tissue oxygenation is obviously more sensitive to a loop diuretic challenge compared with the cortex because furosemide inhibits the Na-K-2Cl transporter in the thick ascending loop of Henle in the outer medulla. To better delineate tissue corticomedullary oxygenation, higher field strengths and therefore higher resolution are advantageous, even though magnetic field inhomogeneity may be worse due to bowel gas or other factors. Studies using 1.5T showed similarities in R2* values for both the cortex and medulla, whereas use of higher field strengths, smaller voxel sizes and smaller regions of interest (ROIs) allow for more precise determinations of renal cortical versus medullary tissue oxygenation. Use of larger ROIs is also subject to the effects of partial volume effects. Overall, larger absolute and relative differences between cortical and medullary R2* are greater at 3T, suggestive of better discrimination of deoxyhemoglobin differences and tissue oxygenation between the two regions.8
Corticomedullary differentiation can be a challenging but important issue when using BOLD MR, particularly in patients with chronic kidney disease (CKD). This is an important limitation when comparing BOLD results across studies performed at different imaging centers. Many centers have utilized a strategy of manually drawing ROIs in several cortical and medullary segments (Figure 1). This can be performed in any imaging plane but the coronal and axial views are most commonly reported. Regardless of the imaging plane chosen, clear delineation of the cortical and medullary segments is important. Smaller ROIs allow for more precise measurements, especially in regions with thin segments of cortex near the medullary segments. Smaller ROIs may also reduce partial volume artifacts, which may be problematic when performing serial measures at different time points (i.e., after administration of a stimulus such as furosemide). Most of these analyses determine a mean R2* or T2* value after defining several cortical and medullary ROIs in each region. However, even within the medulla (inner versus outer), there is some nonuniformity of oxygenation. Therefore, some groups have incorporated analyses of larger ROIs, including entire cortical or medullary segments, although these are more susceptible to partial volume averaging and may not reflect heterogeneity in oxygenation particularly within the renal medulla.8,9 Therefore, a new technique, “fractional kidney hypoxia”, assumes that the kidney is divided into two compartments (cortical and medullary) and then divides segments into distinct distributions by histogram R2* data.10 This method demonstrates practical advantages as well as increased sensitivity for detecting renal tissue hypoxia in human subjects with flow-limiting renal artery stenosis (RAS). This technique also reduces dependence on manual selection of small ROIs, which can vary in size and potentially cause overlapping in the cortical and medullary segments within a single ROI, thus underestimating renal medullary hypoxia and overestimating renal cortical hypoxia. Of note, this technique applies an R2* threshold of 30 s−1 and assumes distinct distributions (Gaussian for cortex and gamma for medulla) to determine whether a voxel belongs to the cortex or medulla.11 Precision and reproducibility can be affected by the location and the size of the ROI.
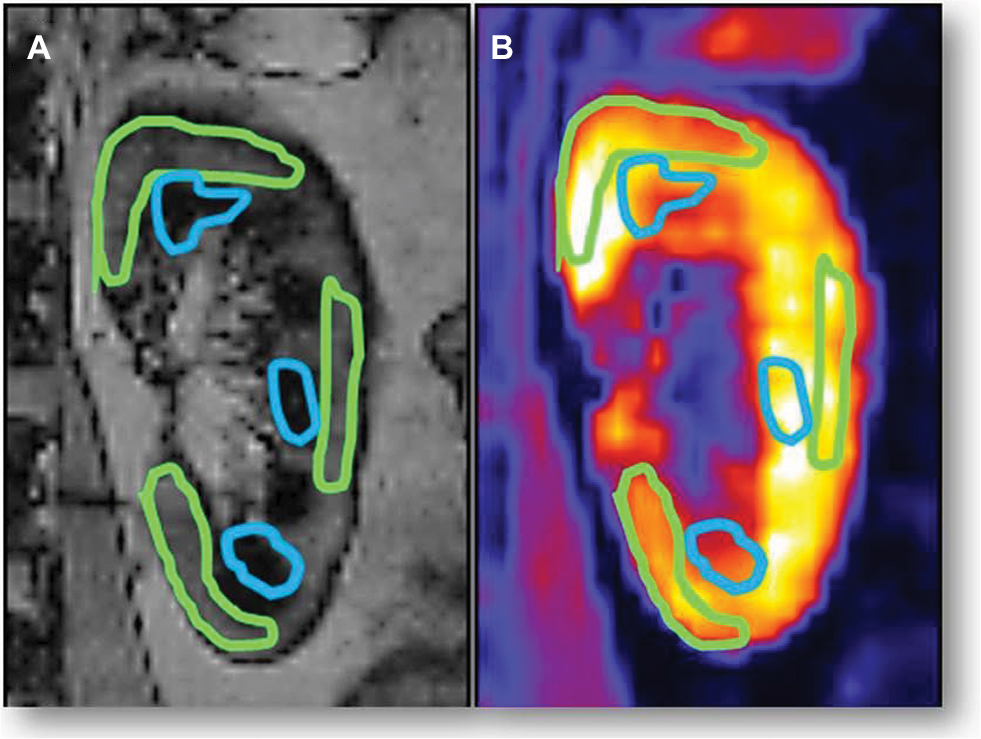 | Figure 1 (A) Anatomic coronal middle left kidney image used to co-register superior middle and inferior cortical and medullary regions of interest. (B) T2* weighted image of the same slice position and regions of interest. |
Manual circular ROIs have been associated with increased interobserver variability in patients with CKD due to loss of corticomedullary differentiation; therefore, a novel semi-automatic technique called “concentric objects” or the “onion peel” was developed. This technique divides the kidney parenchyma into multiple equal thickness layers (6–12).12 The twelve layer concentric objects (TLCO) method demonstrated small interobserver variability even in cases of severe CKD. Milani et al also showed reproducibility between furosemide-induced R2* changes and suggested that the rate of change in R2* from the outer to inner kidney layers may be a novel way to evaluate renal function; they demonstrated a strong positive correlation between the slope and estimated glomerular filtration rate (eGFR): the higher the eGFR, the steeper the slope of the R2* change.12 However, a major limitation to the TLCO method is the inability to differentiate between cortex and medulla.
There are several potential confounding factors that should be considered when utilizing BOLD MR imaging in the kidney (Table 1). Importantly, it should be reiterated that renal tissue oxygenation and blood oxygenation are assumed to be in equilibrium. Several factors including hematocrit, conditions that affect the oxygen/hemoglobin dissociation curve, vascular volume fraction, and sodium and water balance should be considered. A comprehensive summary of the relationship between renal T2* and several of these parameters has been discussed in a review by Niendorf et al.13 As pointed out in their review, T2* is related to the absolute amount of deoxyhemoglobin in the tissue being imaged. Although T2* is sensitive to blood oxygenation, it is also influenced by the tissue fraction of blood vessels and the local hematocrit. Differences in the hematocrit may also be influenced by water content in the tissue. Of course, tissue oxygenation is dependent on renal perfusion and blood flow.
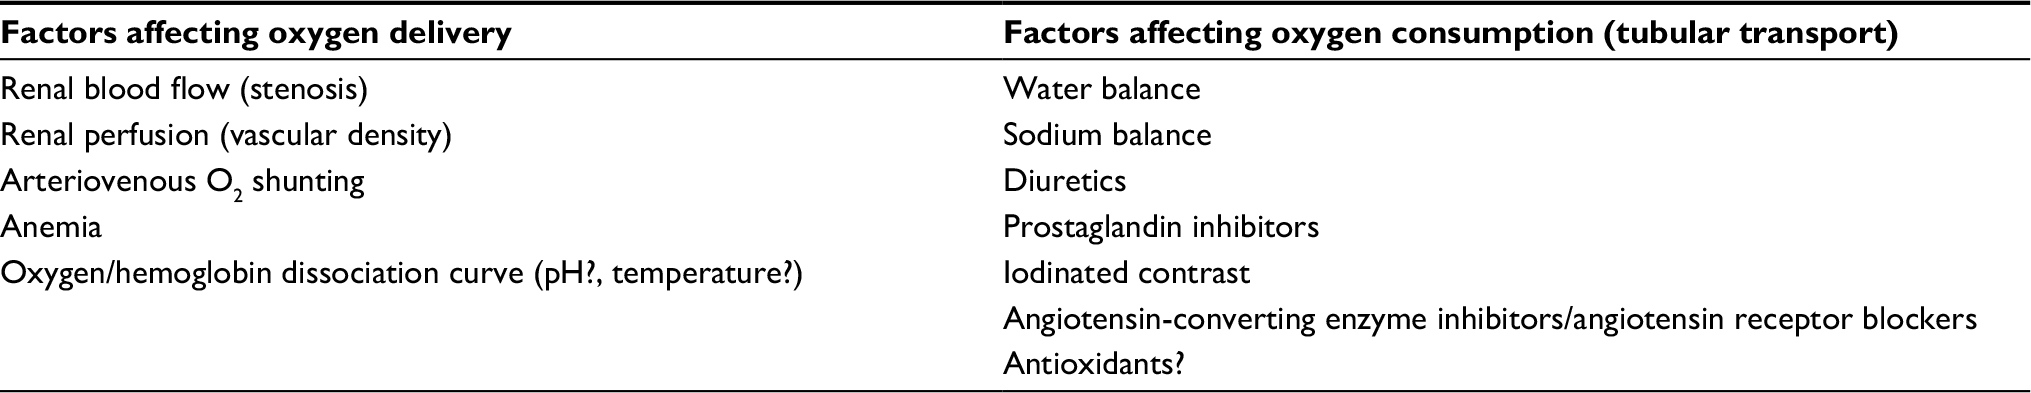 | Table 1 Factors that may influence BOLD MR measures Abbreviation: BOLD MR, blood oxygen level-dependent magnetic resonance. |
Comprehensive MR studies of hyperoxia as well as aortic occlusion/hypoxia in combination with near-infrared spectroscopy techniques to assess hemoglobin concentration (per tissue volume) have examined the delicate balance between renal oxygen delivery and tissue oxygenation.13–15 As we discuss later, it is important to account for changes in renal blood flow/renal tissue perfusion and optimally other local factors when measuring renal oxygenation using BOLD MR techniques. Oxygen content, renal blood flow (delivery) and renal oxygen consumption are important determinants of renal oxygenation and all of these factors should be considered when interpreting renal BOLD MR results.
Other factors that may be important considerations for renal BOLD imaging are related to salt and water balance. In a renal BOLD study of sodium handling and renal oxygenation in normotensive and hypertensive participants after 1 week of high or low sodium diet, no changes in cortical R2* were observed. However, medullary R2* was significantly lower when sodium intake was low (compared to high sodium intake) in hypertensive and non-hypertensive participants, suggesting higher medullary oxygenation under low sodium conditions.16 Urinary sodium excretion, a proxy for dietary sodium intake, has been positively associated with medullary R2* levels suggesting lower renal medullary oxygenation in participants with high urinary sodium excretion.17
Experiments evaluating BOLD responses to water loading have yielded variable results suggesting indirect physiologic effects that may be related to stimulation of prostaglandins.18 There appears to be significant variability in BOLD responses to water loading in individuals imaged at different time points.19 One additional consideration when using a furosemide stimulus is the dose of furosemide and whether patients are chronically receiving a loop diuretic. We found that patients chronically receiving loop diuretics had blunted responses (less of an increase in T2*) to an acute furosemide stimulus.20
Renal tissue oxygenation is dependent on renal oxygen delivery
A major limitation of BOLD MR is that it cannot distinguish between alterations in renal oxygen supply and alterations in renal oxygen consumption.21 Therefore, it is important to also measure renal blood flow and/or regional renal perfusion, major determinants of oxygen delivery and therefore renal tissue oxygenation. Several MR techniques have been utilized to evaluate renal blood flow or perfusion including contrast and non-contrast techniques (Table 2).
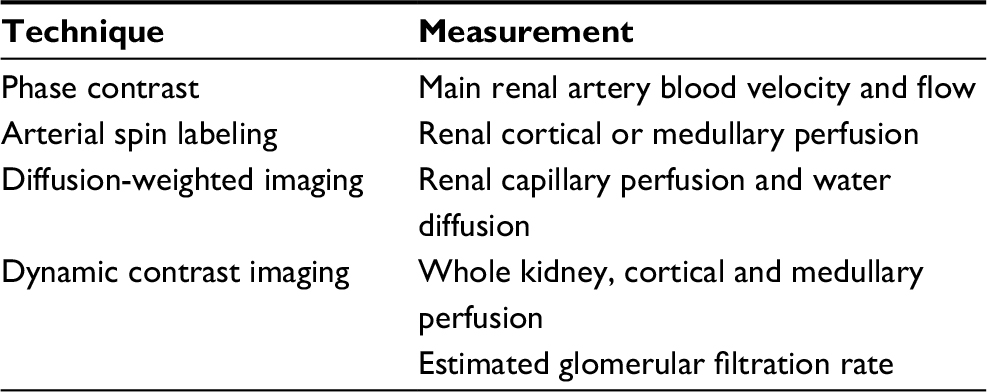 | Table 2 Complementary magnetic resonance techniques to assess renal blood flow or perfusion |
Contrast imaging
Contrast-enhanced MR has been used to assess renal anatomy and physiology. In addition to use for angiography and assessment of RAS, contrast imaging has been utilized for assessment of renal perfusion. Gadolinium-based MR contrast agents affect the T1-weighted signal, which increases with higher tissue gadolinium concentrations. Most of these agents are almost entirely excreted by the kidneys, and dynamic contrast MR has been used to assess (GFR).22 Furthermore, assessment of both renal cortical and medullary blood flow is also possible using contrast techniques.23 However, use of gadolinium-based contrast agents has been limited in patients with advanced kidney disease due to the association with nephrogenic systemic fibrosis (NSF). NSF is a systemic condition that is accompanied by diffuse skin and organ fibrosis and injury, which has been described in patients with advanced renal dysfunction. Therefore, non-contrast techniques have been developed to further evaluate renal function and perfusion without risks associated with use of gadolinium or iodinated contrast agents (used in computed tomography or invasive angiography).
Arterial spin labeling (ASL)
Non-contrast functional MR techniques such as ASL show promise for quantitating renal perfusion. ASL uses water in the blood as an endogenous contrast agent, obviating the need for administration of gadolinium or other contrast agents. This technique selectively “tags” or labels the inflowing blood using inversion techniques and then perfusion can be quantified via the differences in the “tagged” and unlabeled images.24 ASL techniques have been utilized to evaluate cortical and medullary perfusion in native and transplanted kidneys as well for estimating renal cortical and medullary blood flow before and after a furosemide stimulus.25 When compared to dynamic contrast-enhanced MR perfusion measures in rabbit models, ASL provided similar measures of renal cortical perfusion.26 ASL techniques also appear to be reproducible for measurement of renal cortical perfusion across a wide range of renal functions; however, estimates of medullary perfusion using ASL demonstrated moderate to poor reproducibility (both intra- and inter-visit measures).27
Diffusion-weighted imaging (DWI)
DWI is a non-contrast MR technique that characterizes the Brownian motion of water molecules to assess renal structure and function. Diffusion is quantitated using the apparent diffusion coefficient (ADC) that provides information on renal capillary perfusion and water diffusion in the extracellular space.28 DWI has been utilized to study renal maturation in children and neonates and has been evaluated for the early detection of renal insufficiency. Decreases in ADC have been noted in several renal pathologic conditions including acute and chronic renal failure, RAS and ureteral obstruction.28 DWI does not require gadolinium contrast, therefore increasing its potential application for studying CKDs. DWI has also been correlated to histological measures of renal fibrosis and there is a negative correlation with eGFR in patients with CKD.29
Phase contrast imaging
Phase contrast MR is a non-gadolinium contrast technique using gradient magnetic pulses to induce phase shifts in moving protons that are proportional to their velocity along the direction of the gradient.30 Phase contrast MR images are acquired with a single breathhold in an orthogonal plane to the main renal artery (usually middle segment) using cardiac gating. Renal blood flow assessed non-invasively with phase contrast methods correlated well with renal blood flow calculated from clearance of para-aminohippuric acid and hematocrit and were highly reproducible with low variation in normal healthy volunteers.31 In a larger study of 127 participants of the Consortium for Radiologic Imaging Studies of Polycystic Kidney Disease Study, renal blood flow estimates from phase contrast techniques were significantly correlated to GFR (measured via iothalamate clearance).32 In a recent study validating phase contrast renal blood flow techniques with phantoms simulating renal artery hemodynamics, the authors observed high correlations, but noted that this technique may be somewhat limited in subjects with a lower eGFR.32 In multivariable models, only age and phase contrast-measured renal blood flow (not kidney volumes, cyst volumes or diagnosis of hypertension) were independent predictors of GFR, suggesting that renal blood flow measured with MR may warrant consideration as an outcome measure in renal clinical studies.33
Clinical applications of BOLD MR in nephrology
CKD
CKD is associated with renal injury, hypoxia and worsening fibrosis, which creates a vicious cycle of progressive renal injury and fibrosis ultimately leading to end-stage renal disease (ESRD). Renal fibrosis has long been recognized as a hallmark of CKD in several renal pathophysiologic conditions. Glomerulosclerosis and tubulointerstitial fibrosis are common in CKD, regardless of etiology. Chronic hypoxia has recently been viewed as a “final common pathway” to ESRD.34 It is hypothesized that as CKD progresses, microvascular changes limit renal tissue oxygen delivery and drive inefficient use of oxygen. Inflammation, oxidative stress, mitochondrial dysfunction, endothelial cell proliferation and dysfunction and capillary rarefaction may all contribute to renal tissue hypoxia and represent potential therapeutic targets to prevent irreversible kidney injury.35
A key point of the chronic hypoxia hypothesis of CKD is that reduced renal tissue oxygenation may precede progression of kidney disease. This was demonstrated using the remnant kidney model in rats in which tubulointerstitial hypoxia measured by the hypoxia probe pimonidazole preceded progressive pathologic renal changes suggesting a pathogenic role of ischemia at early time points.36 Although oxygen microelectrodes are considered the gold standard for oxygen tension measurement, they are invasive and not a viable option for clinical applications. Therefore, BOLD MR has a role to assess renal oxygenation in human studies of CKD.
BOLD MR has been used to assess CKD of several etiologies, resulting in differential findings. In a study of 142 patients with either diabetic nephropathy (n=43), CKD without diabetes (n=76), or acute kidney injury (AKI) (n=23), BOLD MR was correlated with eGFR. T2* levels were positively correlated with eGFR in CKD patients without diabetes, while no significant correlations were observed in patients with diabetic nephropathy or AKI.37 In a subset of patients with CKD without diabetes who also underwent renal tissue biopsy, T2* values negatively correlated with interstitial fibrosis by Masson’s trichrome staining. Based on the finding that associations were observed in non-diabetic CKD patients and not in diabetic nephropathy patients, Inoue et al concluded that renal tissue oxygenation depends on the etiology and not just the severity of CKD.37
In a study of 400 patients who underwent BOLD MR imaging at both 1.5 T and 3T field strengths, no differences in R2* were observed between different stages of CKD.38 Furthermore, in this study R2* was not affected by age or sex. These findings are directly opposite of findings from several previous studies that included smaller numbers of participants.
Michaely et al suggest that renal BOLD MR may not be suitable for broad application “as the level of intrarenal oxygenation seems to be kept constant over time and a broad range of renal function”.38 This conclusion directly challenges the chronic hypoxia hypothesis.39 Several limitations were noted in this study including technical issues such as shorter echo times. Importantly, clinical information related to the use of medications, which may alter tissue oxygenation (either by changing oxygen delivery or consumption), such as angiotensin-converting enzyme inhibitors or angiotensin receptor blockers, beta blockers, diuretics or antioxidants, was missing. Also, information regarding sodium balance and hydration status was not reported. The group of patients imaged was heterogeneous and it is possible that renal tissue oxygenation may depend not only on severity of CKD but also on etiology of kidney disease.39
Hypertension
Kidney BOLD MR has been used to evaluate renal physiology in patients with hypertension as well as the effect of specific antihypertensive medications. It has also been utilized in animal models to study mechanisms of experimental hypertension including responses to angiotensin II.40 In a randomized study of type 2 diabetic patients with microalbuminuria, blockade of the renin-angiotensin system with enalapril or candesartan failed to modify renal cortical or medullary R2* levels, although medullary R2* levels were positively correlated with urinary sodium excretion and systemic arterial blood pressure suggesting lower renal oxygenation at higher dietary sodium intake and blood pressure.41 In a large study of CKD and hypertensive patients, renal cortical and medullary R2* values were not significantly different at baseline when compared to healthy controls.42 However, after administration of furosemide, the usual decrease in R2* values was blunted in patients with hypertension suggesting early metabolic renal maladaptations in this group.
BOLD MR has been incorporated as an outcome measure in studies of antihypertensive medications. In a small randomized prospective study of 24 hypertensive patients comparing the renin inhibitor aliskiren to hydrochlorothiazide therapy for 8 weeks, BOLD MR demonstrated slightly increased cortical and medullary tissue oxygenation in the group treated with aliskiren.43
In addition to evaluating renal oxygenation in response to antihypertensive medications, BOLD MR has been used to evaluate the response to renal denervation. In a study of 46 hypertensive patients who underwent renal denervation with a mean reduction in 24-hour blood pressure of ~9 mmHg, BOLD MR showed no significant changes in renal tissue oxygenation.44 Of note, eGFR did not change after renal denervation, and the lack of a change in renal oxygenation was attributed to autoregulation of renal blood flow and GFR associated with the reduction in blood pressure.
RAS
One of the most studied uses of BOLD MR is in renovascular hypertension/RAS. From early models of RAS using swine models of renal artery ischemia, BOLD MR demonstrated increases in renal R2* after renal artery occlusion, which resolved with correction of the stenosis.45 Textor et al then studied the BOLD MR response in patients with normal renal arteries as well as with high-grade RAS.46 In kidneys with normal angiograms (no stenosis), an appropriate 20% reduction in renal medullary R2* was observed in response to furosemide. In normal size kidneys downstream from a severe stenosis, R2* was elevated (suggesting less oxygenation) at baseline but decreased after furosemide administration. However, in atrophic kidneys beyond stenotic renal arteries, they observed low levels of R2* that did not change after furosemide administration. This study led to the concept that renal BOLD coupled with furosemide suppression of renal medullary oxygen consumption may serve as a kidney “stress test” in patients with RAS.47 Renal BOLD has been used in several human and animal experimental models of RAS to demonstrate that this method may be able to distinguish between underperfused kidneys with preserved tubular function and those with tubular dysfunction as well as to evaluate risk of acute kidney injury in response to contrast administration.48,49
In patients suspected of RAS, we observed that receipt of beta blockers was associated with improved renal cortical and medullary oxygenation measured with BOLD MR.50 These changes were independent of renal artery blood flow suggesting that beta blockers may reduce renal oxygen consumption.
Ebrahimi et al demonstrated that administration of mesenchymal stem cells in addition to percutaneous renal angioplasty in pigs with experimental RAS reduced inflammation, fibrinogenesis and vascular remodeling, ultimately restoring the renal tubular response to furosemide as measured with BOLD MR.51 BOLD MR, particularly when coupled with other physiologic measures including renal perfusion or blood flow, may provide important insights into changes in renal function prior to the onset of irreversible kidney damage.47
Randomized controlled trials of renal artery revascularization procedures have failed to demonstrate uniform improvement in renal outcomes or blood pressure responses when compared to antihypertensive therapy alone.52 It is possible that measures such as renal BOLD MR (Figure 2) may be able to distinguish which patients with RAS are most likely to respond to these procedures to improve renal tissue oxygenation; however, additional prospective studies are warranted.
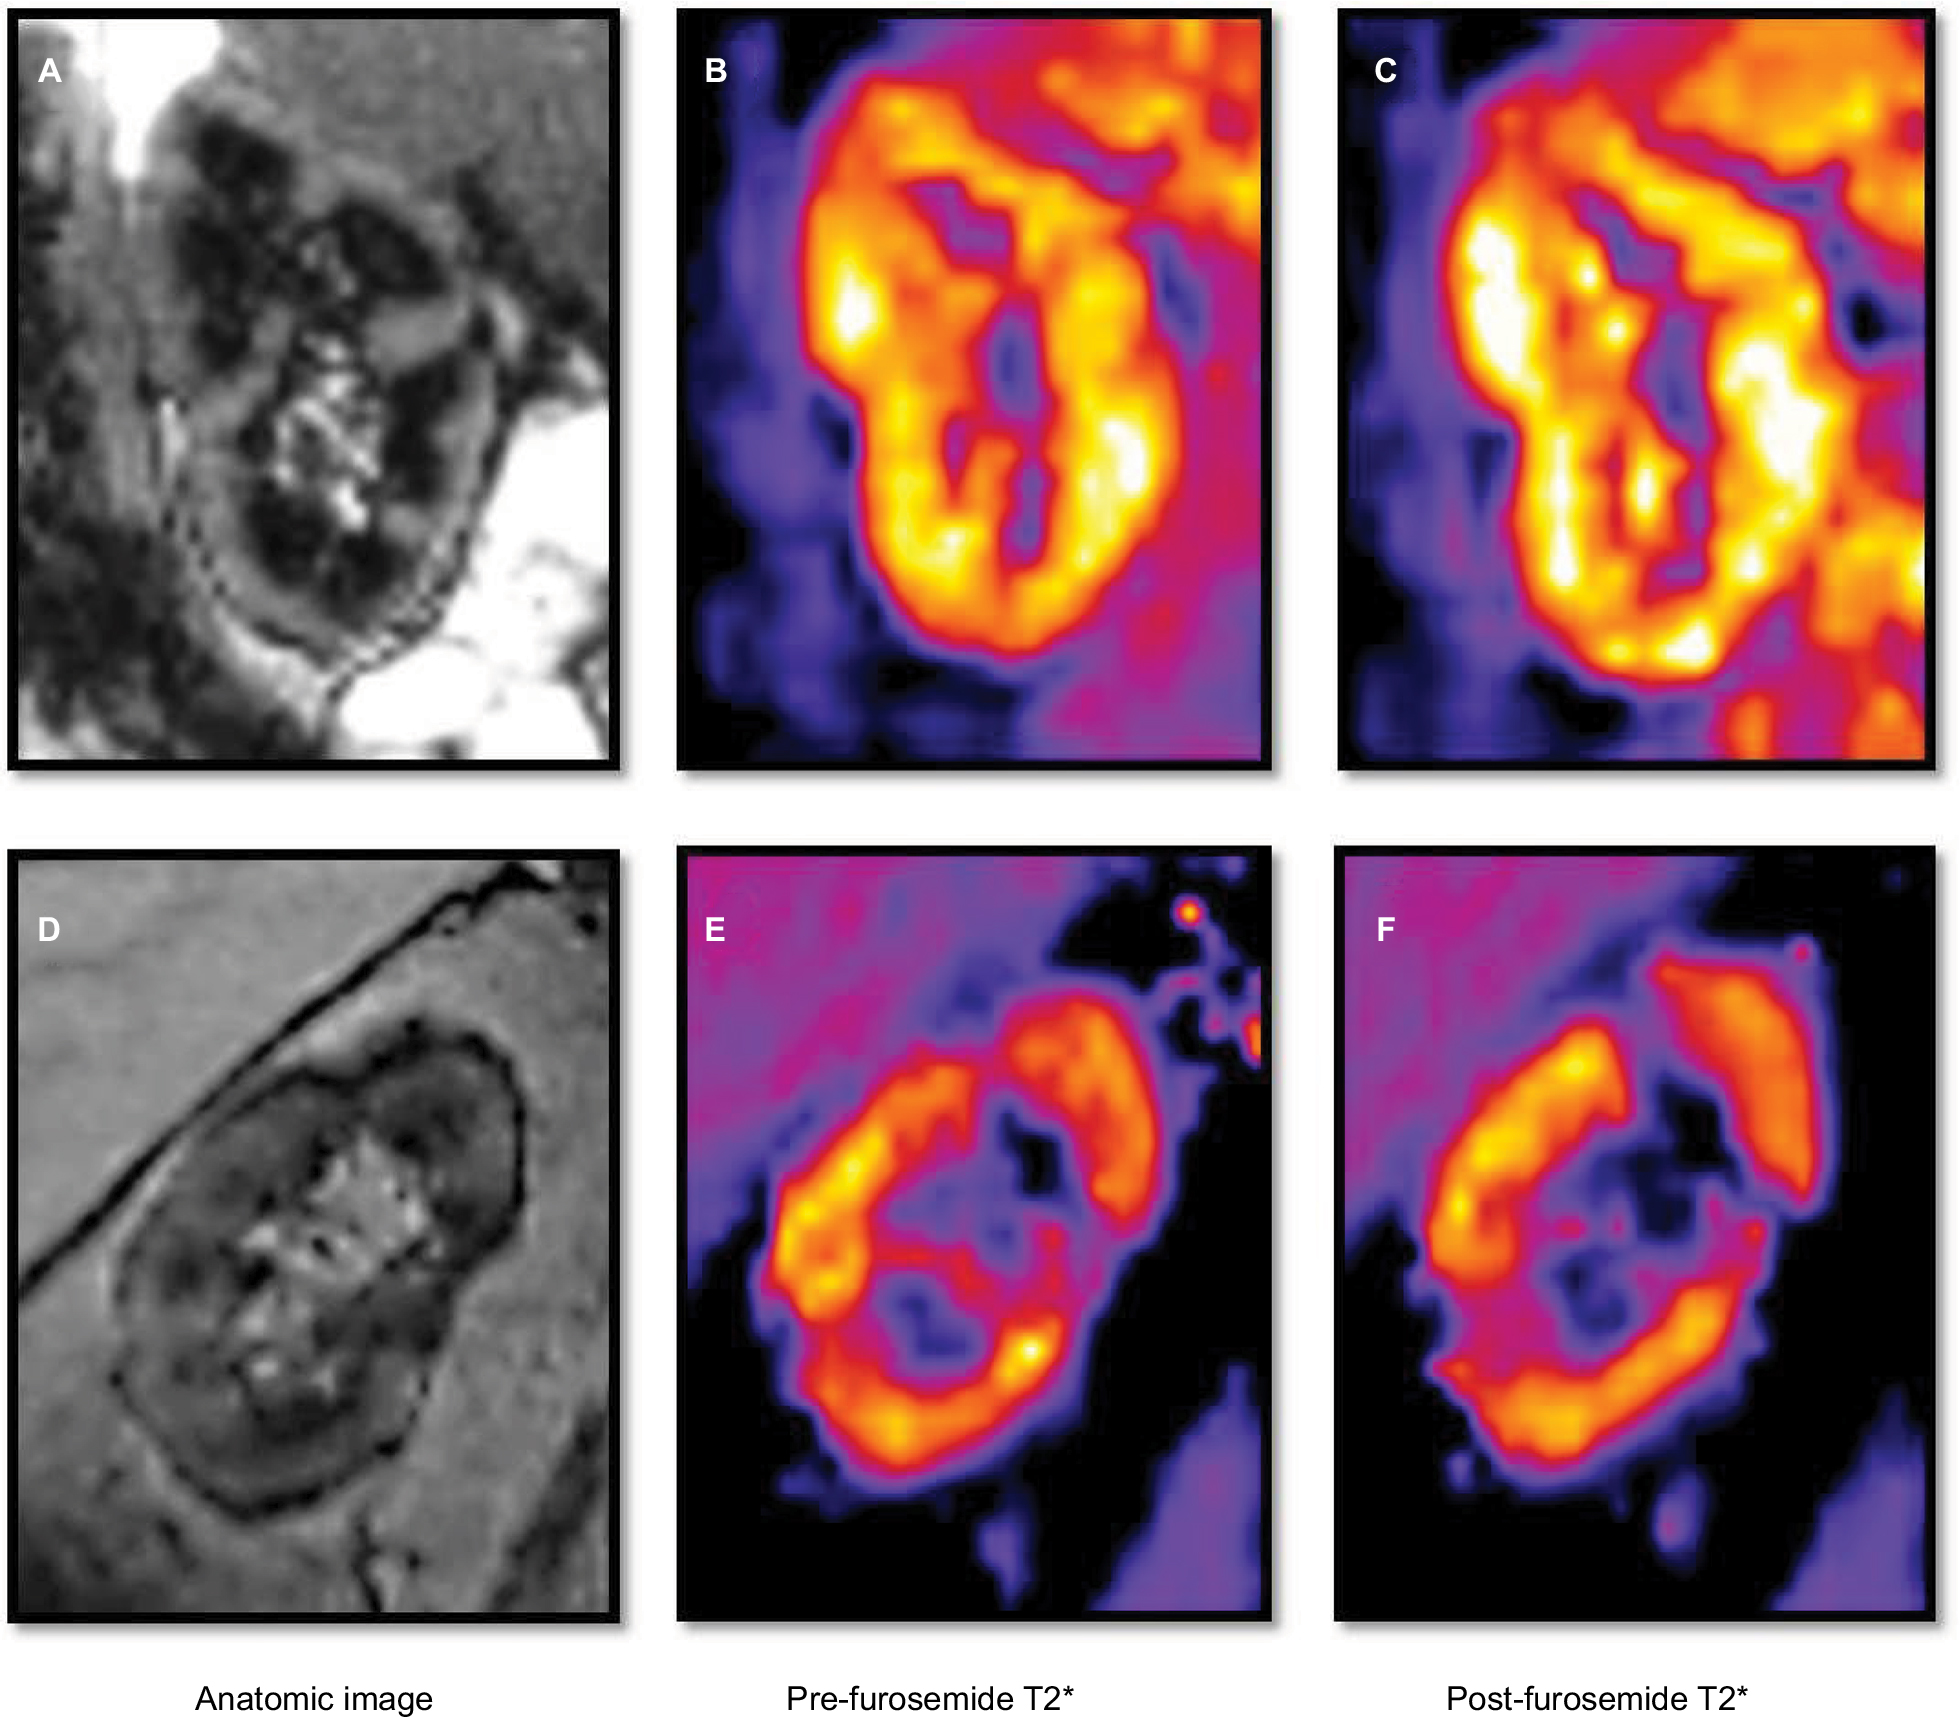 | Figure 2 Anatomic image (A) of the left kidney of a 77-year-old woman with hypertension and renal artery stenosis. The pre- (B) and post- (C) furosemide T2* images of the same kidney demonstrate a normal response and increase in post-T2* image intensity. Anatomic image (D) of the right kidney of a 75-year-old man with hypertension, diabetes and chronic kidney disease with an estimated glomerular filtration rate of 37 ml/min/1.73 m2. The pre- (E) and post- (F) furosemide T2* images of the same kidney demonstrate an abnormal response and decrease in post-T2* intensity. |
Contrast nephropathy
Acute kidney injury due to administration of iodinated contrast for medical imaging exams is of concern in patients with underlying renal dysfunction, although the pathogenesis and even the existence of contrast-induced nephropathy (CIN) is debated. Regardless, the potential mechanisms have been studied in humans and experimental models, and renal BOLD MR has been utilized to investigate whether iodinated contrast affects renal oxygenation. In rodent models, pharmacologic inhibition of nitric oxide (L-NAME) or prostaglandin synthesis (indomethacin) and administration of radiocontrast (sodium iothalamate) reduced renal medullary tissue oxygenation assessed by BOLD.53 In a swine model, administration of the iso-osmolar contrast iodixanol increased inner medullary R2* values suggesting a hypoxic role in the pathogenesis of CIN.54 BOLD MR studies of changes in renal medullary R2* suggest that the viscosity of radiocontrast may be more detrimental to renal oxygenation compared with osmolality.55 Increases in kidney R2* with a marker of acute kidney injury (urinary neutrophil gelatinase-associated lipocalin) have been correlated in rodent models, and pretreatment with furosemide but not the antioxidant N-acetylcysteine significantly blunted the increase in medullary R2* in response to iodixanol suggesting a potential renoprotective effect.56 Additional studies using BOLD in combination with other MR imaging techniques such as diffusion tensor imaging have suggested that contrast viscosity may have renal pathologic effects, and illustrate the flexibility and comprehensive capabilities of MR to assess renal pathophysiology.57
Acute transplant rejection
BOLD MR has been utilized to study kidney function after transplantation. BOLD MR was studied in 20 patients who had recently undergone renal transplantation (6 normally functioning transplants, 8 with acute biopsy-proven acute rejection and 6 with biopsy-proven acute tubular necrosis [ATN]), and lower medullary R2* values were observed in acute rejection compared with normally functioning kidneys or those with ATN suggesting changes in intrarenal oxygenation in acute transplant rejection.58 A larger study confirmed these findings of lower medullary R2* in the transplant rejection group compared to the ATN group, suggesting that BOLD MR may be a useful way to discriminate between the two pathologic states.59 Sadowski et al evaluated BOLD MR with MR perfusion techniques to study acute transplant rejection and observed significantly lower medullary perfusion but lower R2* in patients with rejection compared to ATN, suggesting increased medullary oxygen bioavailability in rejecting allografts despite a reduction in blood flow.60
BOLD and diffusion-weighted MR demonstrated stable parameters in well-functioning allografts over nearly a 30-year period of follow-up, suggesting that these techniques may be useful for monitoring renal allograft function.61 BOLD MR coupled with non-contrast perfusion techniques such as ASL have been evaluated as strategies to assess renal allograft function over time and demonstrated that treatment with the ARB losartan may have beneficial effects of increased cortical perfusion in transplanted kidneys.62
Conclusion
Functional renal MR imaging has a broad range of potential applications in several renal pathophysiologic states. Renal BOLD MR is a non-invasive and reproducible technique for assessing renal tissue oxygenation in patients with kidney diseases or precursors of CKD including hypertension and may serve as a potential renal biomarker in clinical studies. As oxygenation is dependent on perfusion, studies of renal blood flow or tissue perfusion are useful for understanding renal pathophysiology. Due to the potential risk of contrast-induced renal injury or gadolinium-related problems in patients with advanced kidney disease, non-contrast techniques including BOLD MR may provide important opportunities to better assess renal function longitudinally in these patients. MR imaging allows for comprehensive assessment of both renal anatomy and physiology and is a versatile modality with growing clinical applications. Further assessment of these techniques in clinical studies is warranted.
Acknowledgments
The authors were supported by grants from the National Heart, Lung and Blood Institute (PO1 HL51971), the National Institute of General Medical Sciences (P20 GM104357 and U54 GM115428) and the National Institute of Diabetes and Digestive and Kidney Diseases (1K08DK099415-01A1).
Disclosure
The authors report no conflicts of interest in this work
References
Ogawa S, Lee TM, Nayak AS, Glynn P. Oxygenation-sensitive contrast in magnetic resonance image of rodent brain at high magnetic fields. Magn Reson Med. 1990;14(1):68–78. | ||
Ogawa S, Lee TM, Kay AR, Tank DW. Brain magnetic resonance imaging with contrast dependent on blood oxygenation. Proc Natl Acad Sci U S A. 1990;87(24):9868–9872. | ||
Karni A, Meyer G, Jezzard P, Adams MM, Turner R, Ungerleider LG. Functional MRI evidence for adult motor cortex plasticity during motor skill learning. Nature. 1995;377(6545):155–158. | ||
Brezis ML, Rosen S. Hypoxia of the renal medulla—its implications for disease. N Engl J Med. 1995;332(10):647–655. | ||
Prasad PV, Edelman RR, Epstein FH. Noninvasive evaluation of intrarenal oxygenation with BOLD MRI. Circulation. 1996;94(12):3271–3275. | ||
Pedersen M, Dissing TH, Mørkenborg J, et al. Validation of quantitative BOLD MRI measurements in kidney: application to unilateral ureteral obstruction. Kidney Int. 2005;67(6):2305–2312. | ||
Rossi C, Sharma P, Pazahr S, Alkadhi H, Nanz D, Boss A. Blood oxygen level-dependent magnetic resonance imaging of the kidneys: influence of spatial resolution on the apparent R2* transverse relaxation rate of renal tissue. Invest Radiol. 2013;48(9):671–677. | ||
Gloviczki ML, Glockner J, Gomez SI, et al. Comparison of 1.5 and 3 T BOLD MR to study oxygenation of kidney cortex and medulla in human renovascular disease. Invest Radiol. 2009;44(9):566–571. | ||
Lübbers DW, Baumgärtl H. Heterogeneities and profiles of oxygen pressure in brain and kidney as examples of the pO2 distribution in the living tissue. Kidney Int. 1997;51(2):372–380. | ||
Saad A, Crane J, Glockner JF, et al. Human renovascular disease: estimating fractional tissue hypoxia to analyze blood oxygen level-dependent MR. Radiology. 2013;268(3):770–778. | ||
Ebrahimi B, Gloviczki M, Woollard JR, Crane JA, Textor SC, Lerman LO. Compartmental analysis of renal BOLD MRI data: introduction and validation. Invest Radiol. 2012;47(3):175–182. | ||
Milani B, Ansaloni A, Sousa-Guimaraes S, et al. Reduction of cortical oxygenation in chronic kidney disease: evidence obtained with a new analysis method of blood oxygenation level-dependent magnetic resonance imaging. Nephrol Dial Transplant. 2017;32(12):2097–2105. | ||
Niendorf T, Pohlmann A, Arakelyan K, et al. How bold is blood oxygenation level-dependent (BOLD) magnetic resonance imaging of the kidney? Opportunities, challenges and future directions. Acta Physiol (Oxf). 2015;213(1):19–38. | ||
Pohlmann A, Arakelyan K, Hentschel J, et al. Detailing the relation between renal T2* and renal tissue pO2 using an integrated approach of parametric magnetic resonance imaging and invasive physiological measurements. Invest Radiol. 2014;49(8):547–560. | ||
Grosenick D, Cantow K, Arakelyan K, et al. Detailing renal hemodynamics and oxygenation in rats by a combined near-infrared spectroscopy and invasive probe approach. Biomed Opt Express. 2015;6(2):309–323. | ||
Pruijm M, Hofmann L, Maillard M, et al. Effect of sodium loading/depletion on renal oxygenation in young normotensive and hypertensive men. Hypertension. 2010;55(5):1116–1122. | ||
Pruijm M, Hofmann L, Zanchi A, et al. Blockade of the renin–angiotensin system and renal tissue oxygenation as measured with BOLD-MRI in patients with type 2 diabetes. Diabetes Res Clin Pract. 2013;99(2):136–144. | ||
Prasad PV, Epstein FH. Changes in renal medullary pO2 during water diuresis as evaluated by blood oxygenation level-dependent magnetic resonance imaging: effects of aging and cyclooxygenase inhibition. Kidney Int. 1999;55(1):294–298. | ||
Li LP, Storey P, Pierchala L, Li W, Polzin J, Prasad P. Evaluation of the reproducibility of intrarenal R2* and DeltaR2* measurements following administration of furosemide and during waterload. J Magn Reson Imaging. 2004;19(5):610–616. | ||
Hall ME, Rocco MV, Morgan TM, et al. Chronic diuretic therapy attenuates renal BOLD magnetic resonance response to an acute furosemide stimulus. J Cardiovasc Magn Reson. 2014;16:17. | ||
Attenberger UI, Morelli J, Budjan J, et al. Fifty years of technological innovation: potential and limitations of current technologies in abdominal magnetic resonance imaging and computed tomography. Invest Radiol. 2015;50(9):584–593. | ||
Lüdemann L, Nafz B, Elsner F, et al. Absolute quantification of regional renal blood flow in swine by dynamic contrast-enhanced magnetic resonance imaging using a blood pool contrast agent. Invest Radiol. 2009;44(3):125–124. | ||
Artz NS, Sadowski EA, Wentland AL, et al. Arterial spin labeling MRI for assessment of perfusion in native and transplanted kidneys. Magn Reson Imaging. 2011;29(1):74–82. | ||
Wang J, Zhang Y, Yang X, et al. Hemodynamic effects of furosemide on renal perfusion as evaluated by ASL-MRI. Acad Radiol. 2012;19(10):1194–1200. | ||
Winter JD, St Lawrence KS, Cheng HL. Quantification of renal perfusion: comparison of arterial spin labeling and dynamic contrast-enhanced MRI. J Magn Reson Imaging. 2011;34(3):608–615. | ||
Artz NS, Sadowski EA, Wentland AL, et al. Reproducibility of renal perfusion MR imaging in native and transplanted kidneys using non-contrast arterial spin labeling. J Magn Reson Imaging. 2011;33(6):1414–1421. | ||
Thoeny HC, De Keyzer F. Diffusion-weighted MR imaging of native and transplanted kidneys. Radiology. 2011;259(1):25–38. | ||
Zhao J, Wang ZJ, Liu M, et al. Assessment of renal fibrosis in chronic kidney disease using diffusion-weighted MRI. Clin Radiol. 2014;69(11):1117–1122. | ||
Srichai MB, Lim RP, Wong S, Lee VS. Cardiovascular applications of phase-contrast MRI. AJR Am J Roentgenol. 2009;192(3):662–675. | ||
Sommer G, Noorbehesht B, Pelc N, et al. Normal renal blood flow measurement using phase-contrast cine magnetic resonance imaging. Invest Radiol. 1992;27(6):465–470. | ||
Spithoven EM, Meijer E, Borns C, et al. Feasibility of measuring renal blood flow by phase-contrast magnetic resonance imaging in patients with autosomal dominant polycystic kidney disease. Eur Radiol. 2016;26(3):683–692. | ||
King BF, Torres VE, Brummer ME, et al; Consortium for Radiologic Imaging Studies of Polycystic Kidney Disease (CRISP). Magnetic resonance measurements of renal blood flow as a marker of disease severity in autosomal-dominant polycystic kidney disease. Kidney Int. 2003;64(6):2214–2221. | ||
Fine LG, Orphanides C, Norman JT. Progressive renal disease: the chronic hypoxia hypothesis. Kidney Int. 1998;53 (Suppl 65):S74–S78. | ||
Evan RG, O’Connor PM. Initiation and progression of chronic kidney disease: can we definitely test the chronic hypoxia hypothesis? Hypertension. 2013; 62:827–828. | ||
Manotham K, Tanaka T, Matsumoto M, et al. Evidence of tubular hypoxia in the early phase in the remnant kidney model. J Am Soc Nephrol. 2004;15(5):1277–1288. | ||
Inoue T, Kozawa E, Okada H, et al. Noninvasive evaluation of kidney hypoxia and fibrosis using magnetic resonance imaging. J Am Soc Nephrol. 2011;22(8):1429–1434. | ||
Michaely HJ, Metzger L, Haneder S, Hansmann J, Schoenberg SO, Attenberger UI. Renal BOLD-MRI does not reflect renal function in chronic kidney disease. Kidney Int. 2012;81(7):684–689. | ||
Neugarten J. Renal BOLD-MRI and assessment for renal hypoxia. Kidney Int. 2012;81:613–614. | ||
Schachinger H, Klarhöfer M, Linder L, Drewe J, Scheffler K. Angiotensin II decreases the renal MRI blood oxygenation level-dependent signal. Hypertension. 2006;47(6):1062–1066. | ||
Pruijm M, Hofmann L, Piskunowicz M, et al. Determinants of renal tissue oxygenation as measured with BOLD-MRI in chronic kidney disease and hypertension in humans. PLoS One. 2014;9(4):e95895. | ||
Vakilzadeh N, Muller ME, Forni V, et al. Comparative effect of a renin inhibitor and a thiazide diuretic on renal tissue oxygenation in hypertensive patients. Kidney Blood Press Res. 2015;40(5):542–554. | ||
Vink EE, de Boer A, Verloop WL, et al. The effect of renal denervation on kidney oxygenation as determined by BOLD MRI in patients with hypertension. Eur Radiol. 2015;25(7):1984–1992. | ||
Juillard L, Lerman LO, Kruger DG, et al. Blood oxygen level-dependent measurement of acute intra-renal ischemia. Kidney Int. 2004;65(3):944–950. | ||
Textor SC, Glockner JF, Lerman LO, et al. The use of magnetic resonance to evaluate tissue oxygenation in renal artery stenosis. J Am Soc Nephrol. 2008;19(4):780–788. | ||
Gloviczki ML, Saad A, Textor SC. Blood oxygen level-dependent (BOLD) MRI analysis in atherosclerotic renal artery stenosis. Curr Opin Nephrol Hypertens. 2013;22(5):519–524. | ||
Gomez SI, Warner L, Haas JA, et al. Increased hypoxia and reduced renal tubular response to furosemide detected by BOLD magnetic resonance imaging in swine renovascular hypertension. Am J Physiol Renal Physiol. 2009;297(4):F981–F986. | ||
Saad A, Wang W, Herrmann SM, et al. Atherosclerotic renal artery stenosis is associated with elevated cell cycle arrest markers related to reduced renal blood flow and postcontrast hypoxia. Nephrol Dial Transplant. 2016;31(11):1855–1863. | ||
Hall ME, Rocco MV, Morgan TM, et al. Beta-blocker use is associated with higher renal tissue oxygenation in hypertensive patients suspected of renal artery stenosis. Cardiorenal Med. 2016;6(4):261–268. | ||
Ebrahimi B, Eirin A, Li Z, et al. Mesenchymal stem cells improve medullary inflammation and fibrosis after revascularization of swine atherosclerotic renal artery stenosis. PLoS One. 2013;8(7):e67474. | ||
Tuttle KR, Dworkin LD, Henrich W, et al. Effects of stenting for atherosclerotic renal artery stenosis on eGFR and predictors of clinical events in the CORAL trial. Clin J Am Soc Nephrol. 2016;11(7):1180–1188. | ||
Prasad PV, Priatna A, Spokes K, Epstein FH. Changes in intrarenal oxygenation as evaluated by BOLD MRI in a rat kidney model for radiocontrast nephropathy. J Magn Reson Imaging. 2001;13(5):744–747. | ||
Haneder S, Augustin J, Jost G, et al. Impact of iso- and low-osmolar iodinated contrast agents on BOLD and diffusion MRI in swine kidneys. Invest Radiol. 2012;47(5):299–305. | ||
Li LP, Franklin T, Du H, et al. Intrarenal oxygenation by blood oxygenation level-dependent MRI in contrast nephropathy model: effect of the viscosity and dose. J Magn Reson Imaging. 2012;36(5):1162–1167. | ||
Li LP, Thacker J, Lu J, et al. Efficacy of preventive interventions for iodinated contrast-induced acute kidney injury evaluated by intrarenal oxygenation as an early marker. Invest Radiol. 2014;49(10):647–652. | ||
Wang Y, Ren K, Liu Y, et al. Application of BOLD MRI and DTI for the evaluation of renal effect related to viscosity of iodinated contrast agent in a rat model. J Magn Reson Imaging. 2017;46(5):1320–1331. | ||
Sadowski EA, Fain SB, Alford SK, et al. Assessment of acute renal transplant rejection with blood oxygen level-dependent MR imaging: initial experience. Radiology. 2005;236(3):911–919. | ||
Han F, Xiao W, Xu Y, et al. The significance of BOLD MRI in differentiation between renal transplant rejection and acute tubular necrosis. Nephrol Dial Transplant. 2008;23(8):2666–2672. | ||
Sadowski EA, Djamali A, Wentland AL, et al. Blood oxygen level-dependent and perfusion magnetic resonance imaging: detecting differences in oxygen bioavailability and blood flow in transplanted kidneys. Magn Reson Imaging. 2010;28(1):56–64. | ||
Vermathen P, Binser T, Boesch C, Eisenberger U, Thoeny HC. Three-year follow-up of human transplanted kidneys by diffusion-weighted MRI and blood oxygenation level-dependent imaging. J Magn Reson Imaging. 2012;35(5):1133–1138. | ||
Niles DJ, Artz NS, Djamali A, Sadowski EA, Grist TM, Fain SB. Longitudinal assessment of renal perfusion and oxygenation in transplant donor-recipient pairs using arterial spin labeling and blood oxygen level-dependent magnetic resonance imaging. Invest Radiol. 2016;51(2):113–120. |
 © 2018 The Author(s). This work is published and licensed by Dove Medical Press Limited. The
full terms of this license are available at https://www.dovepress.com/terms
and incorporate the Creative Commons Attribution
- Non Commercial (unported, 3.0) License.
By accessing the work you hereby accept the Terms. Non-commercial uses of the work are permitted
without any further permission from Dove Medical Press Limited, provided the work is properly
attributed. For permission for commercial use of this work, please see paragraphs 4.2 and 5 of our Terms.
© 2018 The Author(s). This work is published and licensed by Dove Medical Press Limited. The
full terms of this license are available at https://www.dovepress.com/terms
and incorporate the Creative Commons Attribution
- Non Commercial (unported, 3.0) License.
By accessing the work you hereby accept the Terms. Non-commercial uses of the work are permitted
without any further permission from Dove Medical Press Limited, provided the work is properly
attributed. For permission for commercial use of this work, please see paragraphs 4.2 and 5 of our Terms.