Back to Journals » International Journal of Women's Health » Volume 17
Body Roundness Index and Risk of Gestational Diabetes Mellitus in Women of Reproductive Age: NHANES 2007–2018
Authors Shi S, Xie C, Xiao J ![]() , Liu Y, Cai S
, Liu Y, Cai S
Received 4 July 2025
Accepted for publication 10 September 2025
Published 20 September 2025 Volume 2025:17 Pages 3107—3118
DOI https://doi.org/10.2147/IJWH.S551553
Checked for plagiarism Yes
Review by Single anonymous peer review
Peer reviewer comments 3
Editor who approved publication: Dr Matteo Frigerio
Siqi Shi,1 Chunying Xie,1 Jingjing Xiao,2 Yanling Liu,3 Shu Cai1
1School of Nursing, Guangdong Pharmaceutical University, Guangzhou, Guangdong, People’s Republic of China; 2Department of Nursing, Guangdong Women and Children Hospital, Guangzhou, Guangdong, People’s Republic of China; 3Department of Obstetrics, Guangdong Women and Children Hospital, Guangzhou, Guangdong, People’s Republic of China
Correspondence: Shu Cai, School of Nursing, Guangdong Pharmaceutical University, 283 Jianghai Avenue, Haizhu District, Guangzhou, Guangdong, 510310, People’s Republic of China, Email [email protected]
Objective: Gestational diabetes mellitus (GDM) is closely related to obesity. This study investigated whether Body Roundness Index (BRI) is independently associated with GDM and compared its discriminative performance with BMI.
Methods: We conducted a cross-sectional analysis using data from the 2007– 2018 National Health and Nutrition Examination Survey (NHANES). The study included 3,343 women aged 20– 44 years who had available data on BRI and GDM. Weighted logistic regression and restricted cubic spline (RCS) models were used to examine the association between BRI and GDM. Subgroup and receiver operating characteristic (ROC) curve analyses were performed to evaluate discriminative performance.
Results: Among the 3,343 women, 377 (11.3%) reported GDM. Adjusted weighted multivariate logistic regression showed a 39% increase in GDM risk per BRI unit rise (OR = 1.39; 95% CI: 1.19– 1.62; P < 0.0001). Subgroup analysis confirmed consistent correlation. RCS analysis revealed a nonlinear relationship at BRI = 3.55, significant below and above (P < 0.05). Based on ROC curve analysis, BRI (AUC = 0.608) was more effective in discriminating between women with and without GDM compared to BMI (AUC = 0.573).
Conclusion: This study demonstrates that elevated BRI is independently associated with GDM risk among US reproductive-aged women and shows superior discriminative performance to BMI. These findings highlight the potential value of BRI as an anthropometric indicator associated with GDM risk.
Keywords: body roundness index, gestational diabetes mellitus, abdominal obesity, cross-sectional study, NHANES
Introduction
Pregnancy-induced glucose metabolism disorder is known as gestational diabetes mellitus (GDM) and is among the most prevalent obstetric complications globally.1 The epidemiological burden of GDM has escalated in tandem with rising obesity rates worldwide. The prevalence of GDM in the US nearly doubled, from 4.6% in 2006 to 8.2% in 2016.2 However, heterogeneous diagnostic criteria across regions hinder cross-study comparability. To address this, the International Diabetes Federation (IDF) adopted the IADPSG criteria in 2021, which reported a standardized global GDM prevalence of 14.0%.3 GDM is linked not only to adverse perinatal outcomes (eg, macrosomia, preeclampsia),4 but also to long-term maternal risks, including postpartum type 2 diabetes mellitus (T2DM) and cardiovascular disorders.5,6 The escalating prevalence of GDM imposes substantial economic burdens on healthcare systems and societies. Consequently, early identification of modifiable risk factors is imperative for effective prevention.
The rising incidence of GDM is strongly linked to increasing obesity rates among reproductive-aged women,7 particularly visceral obesity, which confers a higher risk of GDM than other obesity subtypes.8 Visceral adiposity drives GDM pathogenesis through mechanisms, such as elevated inflammatory cytokines, metabolic dysregulation, and insulin resistance.9 However, BMI cannot indicate body fat distribution or distinguish fat from lean mass, leading to the introduction of alternative anthropometric indicators. Measures such as waist circumference (WC) and waist-to-hip ratio (WHR) have been proposed as substitutes for BMI.10 However, these measures also have limitations: WC and WHR primarily capture central obesity but cannot differentiate between subcutaneous and visceral fat, which are more strongly linked to metabolic risk.11 The Body Roundness Index (BRI), derived from these newer indicators, was proposed by Thomas et al in 2013. Based on an elliptical model of body shape, BRI estimates visceral adiposity and total body fat percentage through body eccentricity,12 representing a novel anthropometric tool. Compared with BMI, BRI has been shown to better reflect cardiometabolic status.13 A recent study by Tutar et al recruited 80 pregnant women (40 with GDM) and found that BRI is closely associated with obesity in women with GDM. It may serve as a reliable alternative to BMI for assessing maternal adiposity and predicting cardiometabolic outcomes.14 A growing body of evidence suggests that BRI has greater predictive value than conventional indices such as BMI or WC in predicting chronic conditions. Notably, BRI shows stronger predictive value for metabolic syndrome compared with WHR,15 is more strongly associated with impaired renal function than BMI in large cohorts,16 and remains an independent predictor of type 2 diabetes risk.17
Nevertheless, these observations, evidence regarding the association between BRI and GDM in women of reproductive age remains insufficient, and it is unclear whether BRI provides additional discriminative value beyond BMI. Therefore, this study used data from the NHANES to investigate the association between BRI and GDM, aiming to provide evidence for global early screening and intervention strategies for GDM.
Methods
Study Participants
The research incorporated data gathered during the 2007–2018 cycles of NHANES, a nationally representative health and nutrition survey, managed by the National Center for Health Statistics (NCHS) under the Centers for Disease Control and Prevention (CDC).18 NHANES employs a multistage probability sampling design with stratification and oversampling of specific demographic groups to ensure statistically robust national estimates. Prior to data collection, participants’ written informed consent was secured, and the study protocol achieved ethical approval from the NCHS Institutional Review Board.
Our analysis utilized six NHANES survey cycles (2007–2018) including 59,842 participants. From this population, we identified 7,528 women aged 20–44 years who met initial age criteria. Eligibility required participants to self-report their definitive GDM status with explicit “yes” or “no” responses, yielding 4,554 eligible candidates. We implemented sequential exclusions based on the following criteria: missing BRI measurements (n = 122), incomplete socioeconomic or clinical covariate data (n = 643), and current pregnancy or indeterminate gestational status (n = 446). The final analytical cohort comprised 3,343 participants (Figure 1).
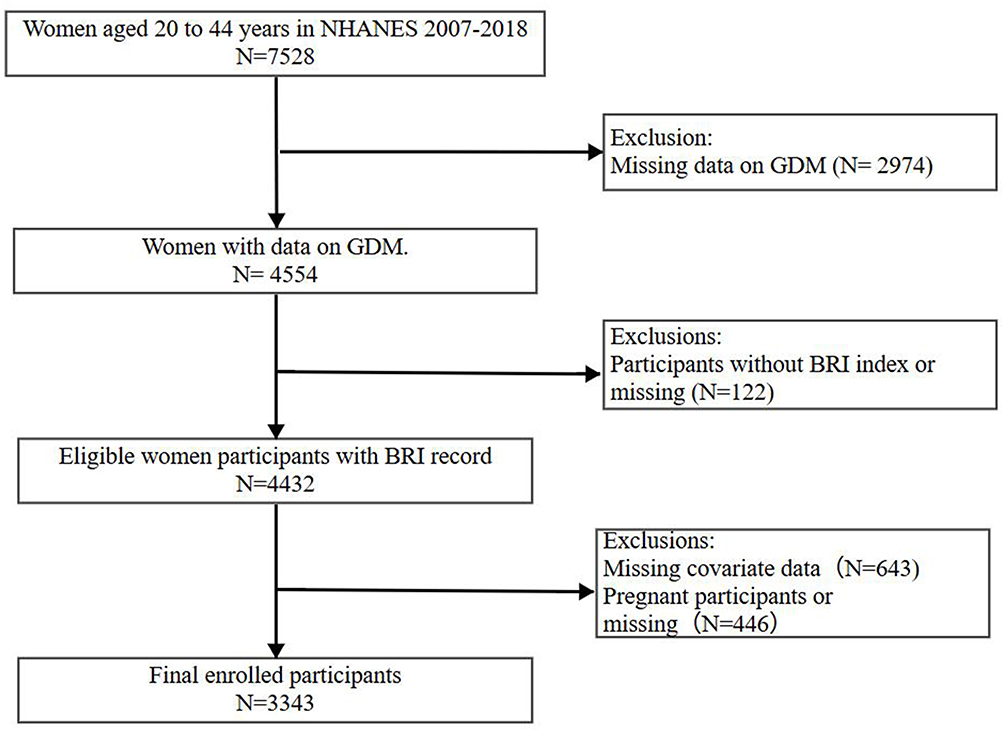 |
Figure 1 Flowchart of participant selection. The diagram shows the number of women included and excluded at each stage of the study, with reasons for exclusion. |
GDM
The researchers utilized the Reproductive Health Questionnaire from the 2007–2018 NHANES cycle to determine the history of GDM. Consistent with prior methodologies,19 this study used the variable name “RHQ162” from the database, along with a related question from the questionnaire, to determine whether participants were diagnosed with GDM during pregnancy. Only those who answered “yes” or “no” were included in the analysis. Responses such as “borderline” “refused” or “don’t know” led to exclusion from the analysis. The question was not posed to women without a history of pregnancy. This method has been widely used to identify GDM cases and assess its prevalence in NHANES-based epidemiological studies.20
Definition of BRI
Participants’ height and WC data were recorded in their medical examination documents. These measurements were collected by professional health technicians at Mobile Health Screening Center and recorded to ensure the accuracy of the data for each individual. Participants’ height and WC were both measured while standing. The exposure variable is the BRI, calculated with the subsequent equation: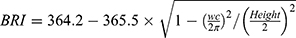 .To aid interpretation, in our cohort a 1-unit increase in BRI corresponded to approximately a 6 cm greater waist circumference, representing a clinically meaningful change in central adiposity.
Covariates
Covariates were systematically assessed in three domains: The first domain covered demographic characteristics, including age, race/ethnicity, marital status, education level, and poverty-income ratio (PIR). The second domain included factors related to lifestyle, such as smoking status (current smoker/non-smoker), alcohol intake (non-drinker [0 g/d], moderate [0–15 g/d], or heavy [≥15 g/d]), physical activity (self-reported sedentary time, hours/day), and healthcare accessibility (if the participant has a regular place of care rather than being limited to the emergency room), the types of health insurance involved include private, uninsured, and government insurance. The third domain included health-related parameters, such as obesity (BMI ≥30 kg/m²), history of hypertension, personal history of diabetes (diagnosed by a healthcare provider or self-reported), and parity (total pregnancies, ascertained from the Reproductive Health Questionnaire).
Statistical Analysis
Statistical analyses incorporated the NHANES complex sampling design by applying sampling weights, strata, and primary sampling units. Weighted percentages were used for categorical variables and weighted means with standard errors for continuous variables. Three sequential survey-weighted multivariable logistic regression models were constructed: Model 1 unadjusted; Model 2 adjusted for age, parity, marital status, BMI, and physical activity; and Model 3 further adjusted for smoking status, alcohol intake, race/ethnicity, citizenship, poverty–income ratio (PIR), education, health insurance coverage, and healthcare access.
To examine potential effect modification, subgroup analyses were performed according to age (<35 vs ≥35 years), race/ethnicity (non-Hispanic White, non-Hispanic Black, Mexican American, and other), and BMI (<25, 25–29.9, ≥30 kg/m²). Multiplicative interaction terms between BRI and these stratification variables were included in Model 3, with P values for interaction derived from likelihood ratio tests. Restricted cubic spline (RCS) regression was applied to model potential non-linear associations between BRI and GDM, with four knots placed at the 5th, 35th, 65th, and 95th percentiles of BRI distribution. Non-linearity was tested by comparing spline and linear models.21 Threshold effects were further examined using two-piecewise linear regression.
Model diagnostics confirmed no evidence of severe multicollinearity (all variance inflation factors <5) and adequate goodness-of-fit (Hosmer-Lemeshow test, P = 0.081). Discriminative performance of anthropometric indices (BRI, BMI, WC, and height) was compared using ROC curves; the area under the curve (AUC) with 95% confidence intervals was calculated, and differences between AUCs were compared using DeLong’s test.
All analyses were performed in R version 4.4.2 (R Foundation for Statistical Computing, Vienna, Austria) using the survey, rms, splines, and pROC packages. Two-sided P values <0.05 were considered statistically significant.
Results
Baseline Characteristics of Participants
The total number of participants was 3,343, including 2,966 women without a history of GDM and 377 women having a history. Compared to women without GDM, women who have had GDM exhibited significantly higher mean values for age, BMI, waist circumference, BRI, total cholesterol, and glycated hemoglobin (HbA1c) (P<0.05 for all). Demographically, the GDM group exhibited a larger proportion of married/cohabiting individuals (P<0.05) and differed significantly in racial/ethnic distribution, with increased representation of Mexican Americans and reduced representation of non-Hispanic Black women (P<0.05). Additionally, women with prior GDM reported a higher proportion of diabetes (P<0.05) and reduced access to healthcare resources (P<0.05). However, no significant differences were found between the groups for variables such as education level, hypertension status, health insurance coverage, smoking status, and PIR (P>0.05 for all) (Table 1).
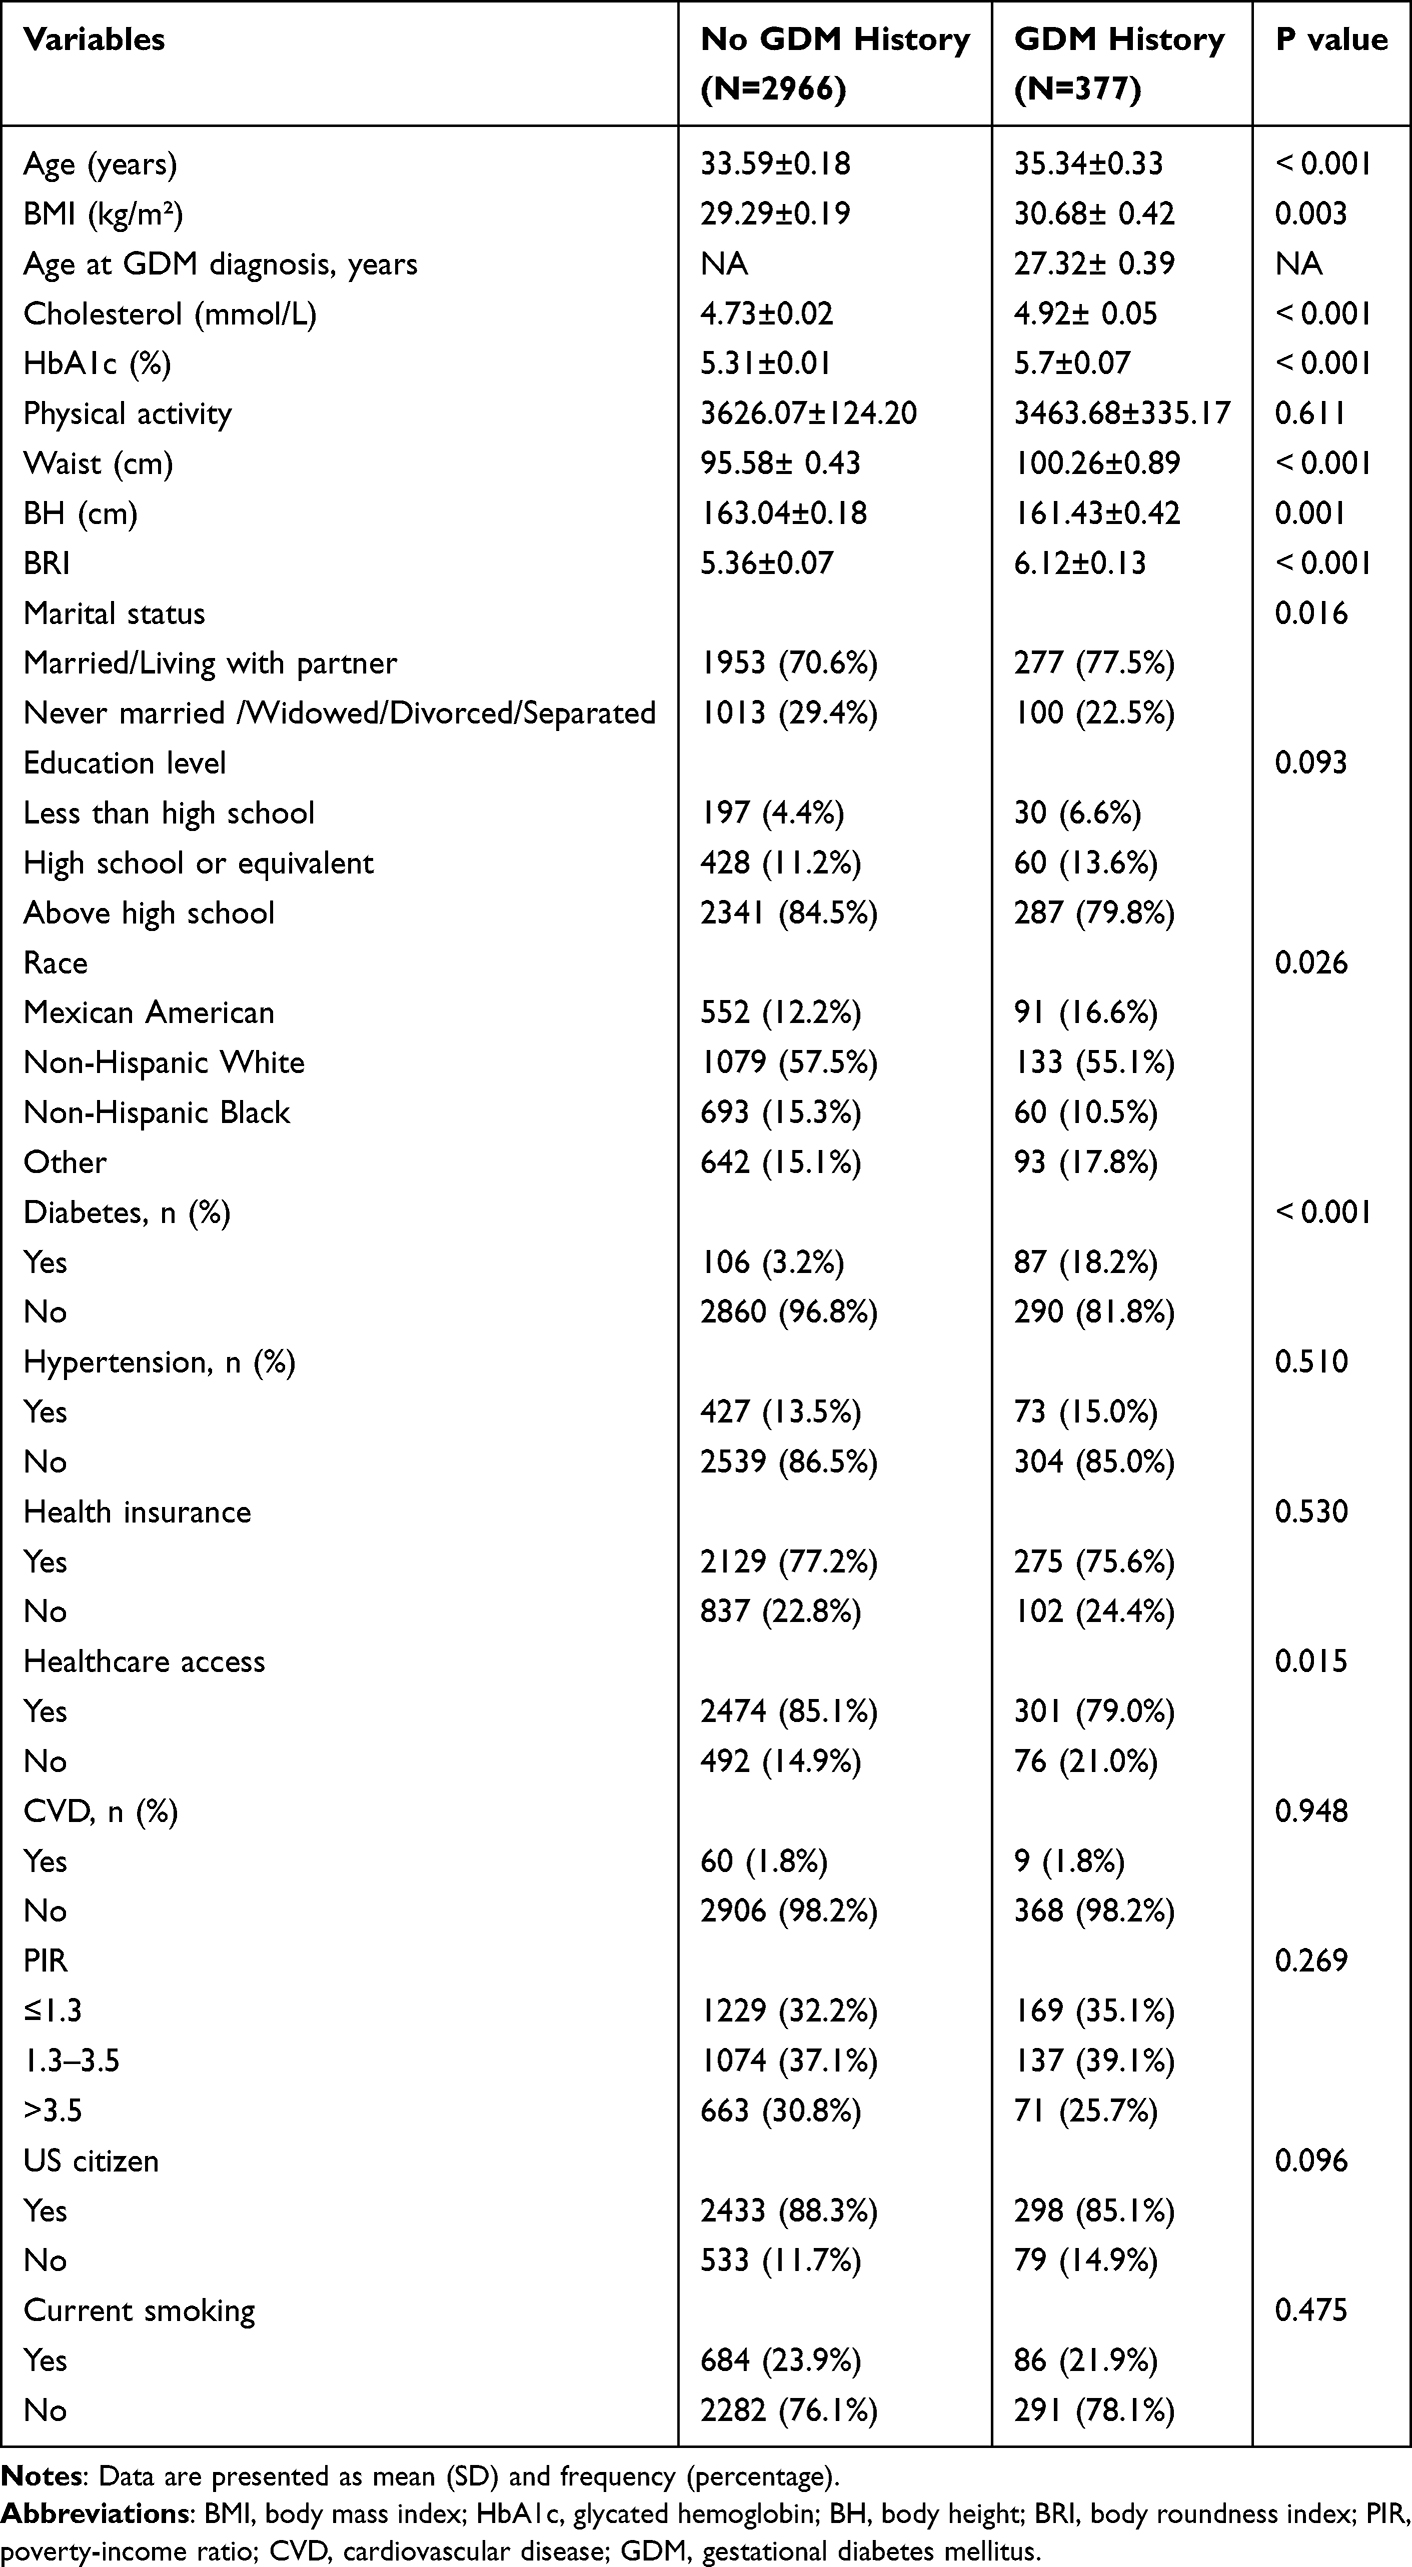 |
Table 1 Baseline Characteristics of the Weighted Population by GDM Status |
Association Between BRI and the Risk of GDM
In this study, a survey-weighted multivariate logistic regression analysis was conducted to examine the association between BRI and GDM. A significant positive association was observed and remained consistent across all adjustment models. In the unadjusted model, the probability of GDM rose by 10% for every unit increase in BRI (OR = 1.10, 95% CI: 1.06–1.14; P < 0.0001). The association became stronger after adjusting for age, parity, marital status, BMI, and physical activity (OR = 1.44, 95% CI: 1.24–1.66; P < 0.0001). In Model 3, additional adjustments were made for smoking status, alcohol consumption, race/ethnicity, citizenship, PIR, education level, health insurance status, and healthcare access. The relationship retained statistical significance (OR = 1.39, 95% CI: 1.19–1.62; P < 0.0001). As part of the sensitivity analyses, BRI was also evaluated as a categorical variable with quartiles. Participants in Model 3 in the top quartile (Q4) showed a 7.35-fold greater risk of GDM compared to those in the lowest quartile (Q1) (OR = 7.35, 95% CI: 3.33–16.21; P < 0.0001) (Table 2).
 |
Table 2 Association Between BRI and the Risk of GDM |
RCS and Threshold Effect Analyses
We performed an RCS analysis in Model 3 (Figure 2). The results revealed a significant nonlinear relationship between BRI and GDM (P for nonlinearity < 0.001), with an overall significant trend (P-overall = 0.0112). A subsequent threshold analysis identified an inflection point at BRI = 3.55. A segmented linear regression model demonstrated differential associations across BRI strata. Below the threshold of 3.55, the probabilities of GDM rose by 195% for every BRI unit rise (OR = 2.95; 95% CI: 1.28–6.80).Conversely, above this threshold (BRI > 3.55), the association weakened substantially (OR = 1.51; 95% CI: 1.24–1.84).Complete analytical results are presented in Table 3.
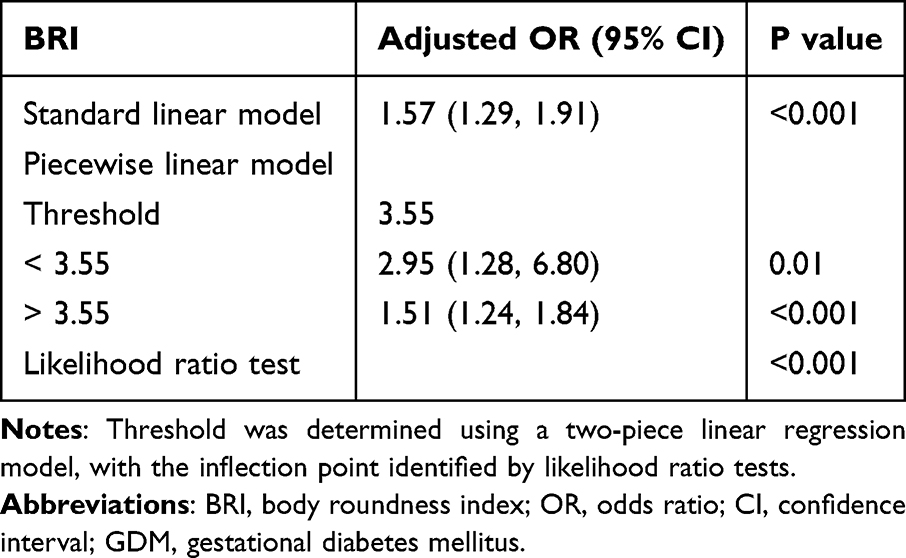 |
Table 3 Threshold Effect of BRI on GDM Analyzed Using a Two-Piece Linear Regression Model |
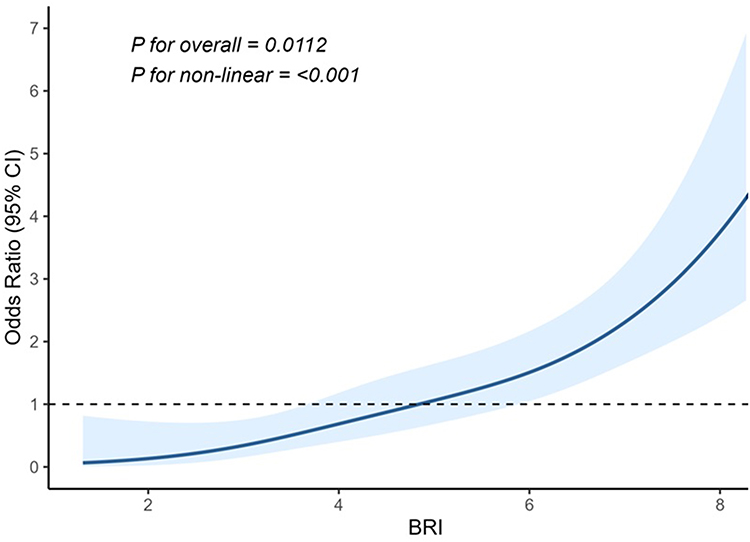 |
Figure 2 Restricted cubic spline (RCS) curve showing the nonlinear association between body roundness index (BRI) and gestational diabetes mellitus (GDM). The line represents the odds ratio (OR), and the shaded area indicates the 95% confidence interval (CI). Annotations denote the results of the regression nonlinearity test. |
Subgroup Analyses
Figure 3 displays the outcomes of the stratified analysis combined with Model 3. In most subgroups, BRI was positively associated with GDM risk. However, the association was not statistically significant in some groups, such as women with BMI 25–30, parity of 1, certain racial/ethnic groups, or those with a diabetes history. Interaction analyses revealed that the association between BRI and GDM was significantly modified by age, BMI, and diabetes history (all P for interaction <0.05). No significant interaction effects were observed for other variables (all P for interaction > 0.05).
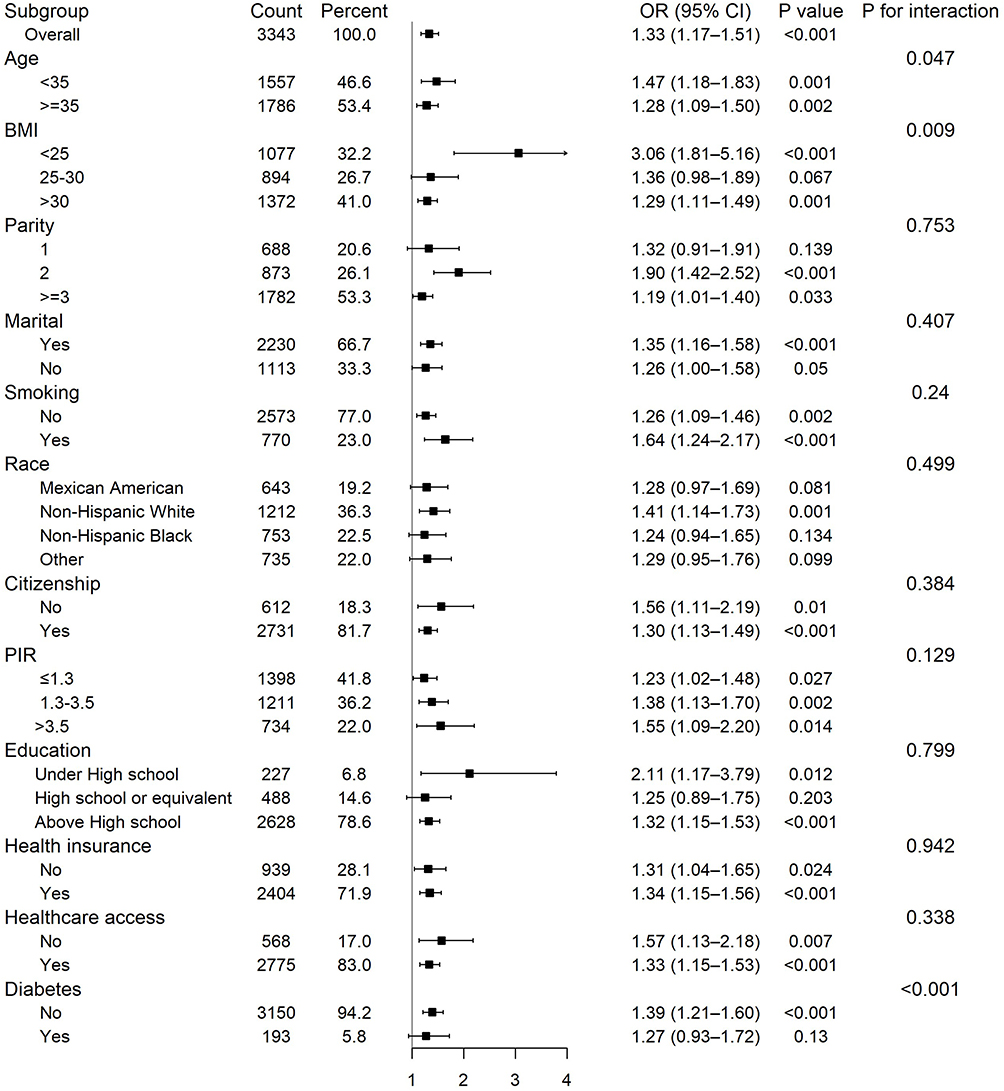 |
Figure 3 Subgroup analysis of the association between BRI and GDM, adjusted for covariates in Model 3. |
Comparison of BRI and BMI in Predicting GDM
As shown in Figure 4 and Table 4, WC, height, BRI, and BMI demonstrated statistically significant discriminative capacity for GDM screening (all AUC > 0.5, P < 0.05). Among these indices, BRI demonstrated modest but relatively better discriminative performance, with an AUC of 0.608 (95% CI: 0.579–0.637). The optimal cutoff value for BRI is 4.9233.
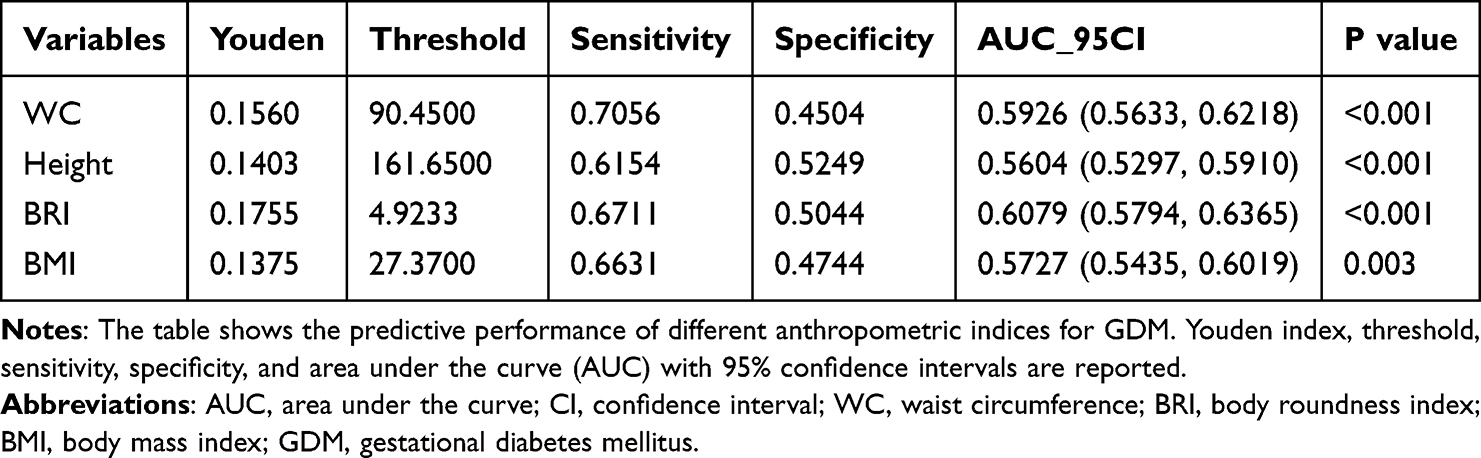 |
Table 4 Statistics of GDM Prediction by Different Variables |
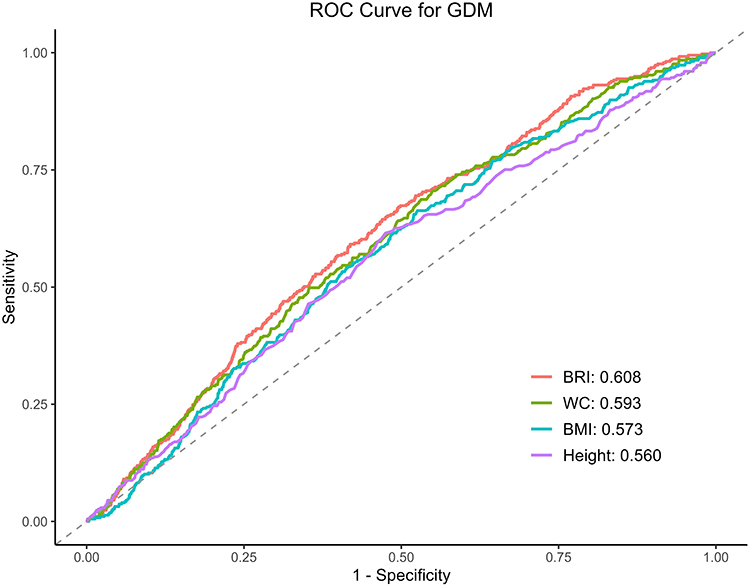 |
Figure 4 Receiver operating characteristic (ROC) curves of BRI, BMI, waist circumference (WC), and height in predicting GDM. The red line represents BRI, the green line represents BMI, the blue line represents WC, and the purple line represents height. The gray dashed line indicates the reference line (AUC = 0.5). The corresponding AUC values are presented in Table 4. |
Discussion
This cross-sectional analysis included 3,343 US women from the NHANES 2007–2018 data. The prevalence of GDM was 11.28% (n = 377). GDM and BRI had a substantial positive correlation, the probabilities of GDM rose by 39% for each unit rise in BRI (P < 0.0001).Subgroup analyses indicated significant effect modification by age, BMI, and diabetes history (P < 0.05). In ROC analyses, BRI demonstrated modest but superior discriminative capacity for GDM compared to BMI, WC, and height (P < 0.001 for all). Despite the overall limited accuracy (AUC ~0.6), BRI showed relatively better discrimination than these traditional indices, suggesting its potential utility as a supportive screening marker. One of the main risk factors for GDM is obesity, as supported by numerous epidemiological studies.22,23 Recent evidence also indicates that abdominal subcutaneous fat thickness (ASFT), another anthropometric parameter, may improve the prediction of GDM when combined with GCT.24 Among various fat depots, compared to subcutaneous fat, visceral adipose tissue (VAT) is more strongly associated with insulin resistance and the risk of diabetes.25,26 Although BMI is the most commonly used anthropometric indicator, a recent meta-analysis reported its low sensitivity in identifying excessive adiposity, failing to detect over half of individuals with elevated body fat.27 This limitation stems from BMI’s inability to assess fat distribution. Alternative measures such as WC and WHtR have been proposed to capture central adiposity, with studies suggesting their incremental value in predicting GDM.28 However, these indicators do not distinguish between subcutaneous and visceral fat, whereas early-pregnancy VAT depth has emerged as a potential predictor of GDM.29 Martin et al demonstrated that deeper VAT in early gestation was closely correlated with hyperglycemia between 24 and 28 weeks of pregnancy.30 Although dual-energy X-ray absorptiometry (DXA) and computed tomography (CT) are regarded as gold standards for VAT quantification, their clinical utility during pregnancy is limited due to changes in fluid distribution, radiation exposure risks to the fetus, and high cost.31 In contrast, BRI—a geometry-based index reflecting height-adjusted body shape—has shown promise in estimating visceral fat more accurately than conventional anthropometric measures. BRI has been reported to correlate strongly with CT-derived VAT volumes.32 Our findings confirm that BRI is an effective predictor of GDM and outperforms traditional metrics such as BMI and WC in risk estimation. This aligns with previous cross-sectional evidence identifying BRI as a separate risk factor for GDM, given a close relationship with obesity.14 Moreover, results from prospective cohort studies suggest that increased VAT depth in early pregnancy is an independent predictor of later gestational hyperglycemia.33 Accordingly, some researchers advocate measuring BRI preconceptionally to identify obese women vulnerable to GDM and other complications during pregnancy.34
Subgroup analyses revealed notable heterogeneity in the association between BRI and GDM. Specifically, the association suggests that BRI may be more sensitive in detecting early-stage metabolic risk in younger women (aged 20–34 years), potentially due to heightened metabolic activity in early reproductive age.35 The metabolic activity of VAT is higher than that of subcutaneous fat, playing a crucial role in lipid turnover and insulin regulation.36 Its distribution may have a stronger impact on glucose metabolism in younger populations. This may explain the stronger predictive performance of BRI in this group. In BMI-stratified analyses, the association between BRI and GDM was strongest in women with BMI < 25 kg/m². Unlike BMI, which reflects general body mass but not fat distribution, BRI is more sensitive to abdominal adiposity, a key factor in insulin resistance.37 Therefore, even among lean women, BRI may help identify those with excess visceral fat and higher GDM risk.38 Moreover, the significant association between BRI and GDM among individuals without a history of diabetes suggests that visceral adiposity, as estimated by BRI, may contribute to GDM risk even in metabolically normal populations. BRI may help identify high-risk individuals with excess abdominal fat who, despite not having developed diabetes, remain vulnerable to GDM due to underlying lipid dysregulation, insulin resistance, and chronic low-grade inflammation.39,40 These outcomes reveal the independent forecasting importance of BRI in this subgroup. However, the association between BRI and GDM did not reach statistical significance in participants with a history of diabetes (P= 0.13), probably because of the small sample size (n = 193), which reduced statistical power and resulted in a wide confidence interval.
Several biological mechanisms may explain the relationship between BRI and GDM. BRI is considered a reliable surrogate for visceral adiposity, which plays a central role in metabolic dysfunction. Visceral adipocytes actively secrete pro-inflammatory cytokines and adipokines, such as adiponectin and leptin, which can disrupt insulin signaling pathways through multiple mechanisms.41 Additionally, visceral fat serves as a primary source of free fatty acids (FFAs), which are directly transported to the liver, promoting fat buildup and contributing to insulin resistance in the liver.42 Disruptions in key transcription factors involved in insulin signaling and adipocyte differentiation—particularly the phosphoinositide 3-kinase (PI3K) pathway—have also been implicated.43,44 These molecular alterations may further impair insulin sensitivity in obese women. Notably, Rancourt et al reported that reduced expression of the PI3K subunit p110α in visceral adipose tissue may contribute to the pathophysiology of GDM.45
There are several notable strengths in this study. First, the data were drawn from NHANES, a survey that is nationally representative, with a large sample size and stringent quality control. Second, our analyses incorporated appropriate sampling weights, enhancing the generalizability of the findings. Third, we performed subgroup analyses after adjusting for confounders to assess the robustness of associations across diverse population strata. Finally, by focusing on the correlation of BRI with GDM, this study contributes novel insight into the discriminative capacity of a relatively new anthropometric index in metabolic risk assessment.
The findings of this study may have important clinical and public health implications. BRI is an inexpensive, simple, and non-invasive index that requires only height and waist circumference, making it feasible for use in primary care and resource-limited settings. Compared with traditional anthropometric measures, BRI may be a preferable alternative to traditional indices for assessing GDM risk in epidemiological studies. Moreover, BRI could be incorporated into routine health assessments as an auxiliary measure to support early risk stratification and targeted prevention strategies. From a public health perspective, the use of BRI may help improve early identification of high-risk populations and inform timely interventions, thereby contributing to the reduction of the GDM burden.
This study has several limitations. First, its cross-sectional design precludes causal inference between BRI and GDM. Second, the diagnosis of GDM was based on self-reported history, which may introduce recall and misclassification bias. However, a study using data from the New York State Pregnancy Risk Assessment Monitoring System (PRAMS) has validated studies in US women, demonstrating good agreement between self-reported and medical record data for GDM,46 supporting the feasibility of this approach in large-scale epidemiological surveys. Moreover, the prevalence of self-reported GDM in our study (11.3%) was consistent with national estimates,47 further supporting the plausibility of our findings. Third, although we considered multiple relevant variables, complete elimination of confounders is a major challenge. For example, certain GDM-specific risk factors such as family history of diabetes, gestational weight gain, and PCOS status were not available in NHANES and thus could not be adjusted for, which may have influenced our results. Finally, as the study population was limited to US women, generalizability to other regions should be interpreted with caution.
Conclusions
This study demonstrates that BRI is independently associated with GDM in US women of reproductive age. BRI shows a statistically superior discriminative performance compared to BMI and WC. The observed non-linear association highlights its potential value in identifying high-risk subgroups. BRI may represent a promising and easily obtainable metric that warrants further investigation. Future prospective and interventional studies are needed to clarify its potential role in clinical and public health prevention strategies. These studies should include cost-effectiveness evaluations and validation against clinical diagnostic standards.
Ethics Statement
The data for this study were sourced from the publicly accessible and de-identified NHANES database. The NCHS Institutional Review Board approved the survey protocol, and all participants provided informed consent. In line with the Measures for Ethical Review of Life Science and Medical Research Involving Human Subjects (China, effective February 18, 2023), Article 32 outlines exemptions from additional ethical review for (1) research based on lawfully obtained public datasets or data collected through non-intrusive observation, and (2) studies using anonymized information. As our analysis relied solely on de-identified, publicly available data, our study qualifies for exemption from additional ethical approval.
Acknowledgments
The authors express their gratitude to the NHANES database participants.
Author Contributions
All authors made a significant contribution to the work reported, whether that is in the conception, study design, execution, acquisition of data, analysis and interpretation, or in all these areas; took part in drafting, revising or critically reviewing the article; gave final approval of the version to be published; have agreed on the journal to which the article has been submitted; and agree to be accountable for all aspects of the work.
Disclosure
The authors report no conflicts of interest in this work.
References
1. Simmons D, Sweeting A. Defining gestational diabetes: not just about cutoffs. Lancet Diabetes Endocrinol. 2023;11(5):303–304. doi:10.1016/S2213-8587(23)00092-X
2. Zhou T, Du S, Sun D, et al. Prevalence and trends in gestational diabetes mellitus among women in the United States, 2006-2017: a population-based study. Front Endocrinol. 2022;13:868094. doi:10.3389/fendo.2022.868094
3. Wang H, Li N, Chivese T, et al. IDF diabetes atlas: estimation of global and regional gestational diabetes mellitus prevalence for 2021 by international association of diabetes in pregnancy study group’s criteria. Diabet Res Clin Pract. 2022;183:109050. doi:10.1016/j.diabres.2021.109050
4. Wendland EM, Torloni MR, Falavigna M, et al. Gestational diabetes and pregnancy outcomes--a systematic review of the World Health Organization (WHO) and the International Association of Diabetes in Pregnancy Study Groups (IADPSG) diagnostic criteria. BMC Pregnancy Childbirth. 2012;12:23. doi:10.1186/1471-2393-12-23
5. You H, Hu J, Liu Y, Luo B, Lei A. Risk of type 2 diabetes mellitus after gestational diabetes mellitus: a systematic review & meta-analysis. Indian J Med Res. 2021;154(1):62–77. doi:10.4103/ijmr.IJMR_852_18
6. Tobias DK, Stuart JJ, Li S, et al. Association of history of gestational diabetes with long-term cardiovascular disease risk in a large prospective cohort of US women. JAMA Intern Med. 2017;177(12):1735–1742. doi:10.1001/jamainternmed.2017.2790
7. Wang L, Zhou B, Zhao Z, et al. Body-mass index and obesity in urban and rural China: findings from consecutive nationally representative surveys during 2004-18. Lancet. 2021;398(10294):53–63. doi:10.1016/S0140-6736(21)00798-4
8. Alwash SM, McIntyre HD, Mamun A. The association of general obesity, central obesity and visceral body fat with the risk of gestational diabetes mellitus: evidence from a systematic review and meta-analysis. Obes Res Clin Pract. 2021;15(5):425–430. doi:10.1016/j.orcp.2021.07.005
9. Bartha JL, Marín-Segura P, González-González NL, Wagner F, Aguilar-Diosdado M, Hervias-Vivancos B. Ultrasound evaluation of visceral fat and metabolic risk factors during early pregnancy. Obesity. 2007;15(9):2233–2239. doi:10.1038/oby.2007.265
10. Gadekar T, Dudeja P, Basu I, Vashisht S, Mukherji S. Correlation of visceral body fat with waist-Hip ratio, waist circumference and body mass index in healthy adults: a cross sectional study. Med J Armed Forces India. 2020;76(1):41–46. doi:10.1016/j.mjafi.2017.12.001
11. Bradshaw PT. Body composition and cancer survival: a narrative review. Br J Cancer. 2024;130(2):176–183. doi:10.1038/s41416-023-02470-0
12. Thomas DM, Bredlau C, Bosy-Westphal A, et al. Relationships between body roundness with body fat and visceral adipose tissue emerging from a new geometrical model. Obesity. 2013;21(11):2264–2271. doi:10.1002/oby.20408
13. Tian S, Zhang X, Xu Y, Dong H. Feasibility of body roundness index for identifying a clustering of cardiometabolic abnormalities compared to BMI, waist circumference and other anthropometric indices: the China health and nutrition survey, 2008 to 2009. Medicine. 2016;95(34):e4642. doi:10.1097/MD.0000000000004642
14. Tutar D, Çintesun FNİ, Günenç O, Çetinkaya ÇD. The association of interleukin-6, interleukin-27, and body roundness index with gestational diabetes mellitus. J Obstet Gynaecol. 2022;42(6):1728–1733. doi:10.1080/01443615.2022.2036956
15. Rico-Martín S, Calderón-García JF, Sánchez-Rey P, Franco-Antonio C, Martínez Alvarez M, Sánchez Muñoz-Torrero JF. Effectiveness of body roundness index in predicting metabolic syndrome: a systematic review and meta-analysis. Obes Rev. 2020;21(7):e13023. doi:10.1111/obr.13023
16. Zhang Y, Gao W, Ren R, et al. Body roundness index is related to the low estimated glomerular filtration rate in Chinese population: a cross-sectional study. Front Endocrinol. 2023;14:1148662. doi:10.3389/fendo.2023.1148662
17. Yang T, Zhao B, Pei D. Evaluation of the association between obesity markers and type 2 diabetes: a cohort study based on a physical examination population. J Diabetes Res. 2021;2021:6503339. doi:10.1155/2021/6503339
18. Fain JA. NHANES: use of a free public data set. Diabetes Educ. 2017;43(2):151. doi:10.1177/0145721717698651
19. Sadiq R, Bukhari MH, Brown TT, Bennett WL, Retnakaran R, Echouffo-Tcheugui JB. Association of cumulative social risk and gestational diabetes mellitus in the US, 2007-2018. Diabet Res Clin Pract. 2023;203:110840. doi:10.1016/j.diabres.2023.110840
20. Sadiq R, Broni EK, Levine LD, Retnakaran R, Echouffo-Tcheugui JB. Association of ideal cardiovascular health and history of gestational diabetes mellitus in NHANES 2007-2018. Diabet Res Clin Pract. 2024;217:111857. doi:10.1016/j.diabres.2024.111857
21. Discacciati A, Palazzolo MG, Park JG, Melloni GEM, Murphy SA, Bellavia A. Estimating and presenting non-linear associations with restricted cubic splines. Int. J Epidemiol. 2025;54(4):dyaf088. doi:10.1093/ije/dyaf088
22. Wang Y, Wu P, Huang Y, et al. BMI and lipidomic biomarkers with risk of gestational diabetes in pregnant women. Obesity. 2022;30(10):2044–2054. doi:10.1002/oby.23517
23. Read SH, Rosella LC, Berger H, et al. BMI and risk of gestational diabetes among women of South Asian and Chinese ethnicity: a population-based study. Diabetologia. 2021;64(4):805–813. doi:10.1007/s00125-020-05356-5
24. Oğlak SC, Yılmaz EZ, Budak MŞ. Abdominal subcutaneous fat thickness combined with a 50-g glucose challenge test at 24-28 weeks of pregnancy in predicting gestational diabetes mellitus. J Obstet Gynaecol. 2024;44(1):2329880. doi:10.1080/01443615.2024.2329880
25. Huang H, Zheng X, Wen X, Zhong J, Zhou Y, Xu L. Visceral fat correlates with insulin secretion and sensitivity independent of BMI and subcutaneous fat in Chinese with type 2 diabetes. Front Endocrinol. 2023;14:1144834. doi:10.3389/fendo.2023.1144834
26. Casanueva FF, Moreno B, Rodríguez-Azeredo R, et al. Relationship of abdominal obesity with cardiovascular disease, diabetes and hyperlipidaemia in Spain. Clin Endocrinol. 2010;73(1):35–40. doi:10.1111/j.1365-2265.2009.03727.x
27. Okorodudu DO, Jumean MF, Montori VM, et al. Diagnostic performance of body mass index to identify obesity as defined by body adiposity: a systematic review and meta-analysis. Int J Obes. 2010;34(5):791–799. doi:10.1038/ijo.2010.5
28. Zhu Y, Hedderson MM, Quesenberry CP, Feng J, Ferrara A. Central obesity increases the risk of gestational diabetes partially through increasing insulin resistance. Obesity. 2019;27(1):152–160. doi:10.1002/oby.22339
29. Li W, Jiang Y, Feng L, Yu J. Visceral adipose tissue depth as a novel predictor for gestational diabetes mellitus: a comprehensive meta-analysis and systematic review. Medicina. 2024;60(4):557. doi:10.3390/medicina60040557
30. Martin AM, Berger H, Nisenbaum R, et al. Abdominal visceral adiposity in the first trimester predicts glucose intolerance in later pregnancy. Diabetes Care. 2009;32(7):1308–1310. doi:10.2337/dc09-0290
31. Most J, Marlatt KL, Altazan AD, Redman LM. Advances in assessing body composition during pregnancy. Eur J Clin Nutr. 2018;72(5):645–656. doi:10.1038/s41430-018-0152-8
32. Ishida A, Taira H, Shinzato T, Ohya Y. Association between visceral fat mass and arterial stiffness among community-based screening participants. Hypertens Res. 2023;46(11):2488–2496. doi:10.1038/s41440-023-01350-7
33. De Souza LR, Berger H, Retnakaran R, et al. First-trimester maternal abdominal adiposity predicts dysglycemia and gestational diabetes mellitus in midpregnancy. Diabetes Care. 2016;39(1):61–64. doi:10.2337/dc15-2027
34. Ozler S, Kozanhan B, Bardak O, Arıkan MN. Are body roundness index and a body shape index in the first trimester related to foetal macrosomia? J Obstet Gynaecol. 2022;42(3):396–402. doi:10.1080/01443615.2021.1907565
35. Sellami M, Almuraikhy S, Naja K, et al. Eight weeks of aerobic exercise, but not four, improves insulin sensitivity and cardiovascular performance in young women. Sci Rep. 2025;15(1):1991. doi:10.1038/s41598-025-86306-2
36. Patel P, Abate N. Body fat distribution and insulin resistance. Nutrients. 2013;5(6):2019–2027. PMID: 23739143; PMCID: PMC3725490. doi:10.3390/nu5062019
37. Pokharel DR, Maskey A, Kathayat G, Manandhar B, Kafle R, Das Manandhar K. Evaluation of novel and traditional anthropometric indices for predicting metabolic syndrome and its components: a cross-sectional study of the Nepali adult population. Sci Rep. 2025;15(1):12065. doi:10.1038/s41598-025-86489-8
38. Robitaille J. Excessive gestational weight gain and gestational diabetes: importance of the first weeks of pregnancy. Diabetologia. 2015;58(10):2203–2205. doi:10.1007/s00125-015-3725-2
39. Dhokte S, Czaja K. Visceral adipose tissue: the hidden culprit for type 2 diabetes. Nutrients. 2024;16(7):1015. doi:10.3390/nu16071015
40. Longo M, Zatterale F, Naderi J, et al. Adipose tissue dysfunction as determinant of obesity-associated metabolic complications. Int J Mol Sci. 2019;20(9):2358. doi:10.3390/ijms20092358
41. Ouchi N, Parker JL, Lugus JJ, Walsh K. Adipokines in inflammation and metabolic disease. Nat Rev Immunol. 2011;11(2):85–97. doi:10.1038/nri2921
42. Xiang M, Tian X, Wang H, Gan P, Zhang Q. Inappropriate diet exacerbates metabolic dysfunction-associated steatotic liver disease via abdominal obesity. Nutrients. 2024;16(23):4208. doi:10.3390/nu16234208
43. Booth AD, Magnuson AM, Fouts J, et al. Subcutaneous adipose tissue accumulation protects systemic glucose tolerance and muscle metabolism. Adipocyte. 2018;7(4):261–272. doi:10.1080/21623945.2018.1525252
44. Ghaben AL, Scherer PE. Adipogenesis and metabolic health. Nat Rev Mol Cell Biol. 2019;20(4):242–258. doi:10.1038/s41580-018-0093-z
45. Rancourt RC, Ott R, Schellong K, et al. Visceral adipose tissue alteration of PI3KR1 expression is associated with gestational diabetes but not promoter DNA methylation. Adipocyte. 2019;8(1):339–346. doi:10.1080/21623945.2019.1675239
46. Hosler AS, Nayak SG, Radigan AM. Agreement between self-report and birth certificate for gestational diabetes mellitus: new York State PRAMS. Matern Child Health J. 2010;14(5):786–789. doi:10.1007/s10995-009-0529-3
47. Bolduc MLF, Mercado CI, Zhang Y, et al. Gestational diabetes prevalence estimates from three data sources, 2018. Matern Child Health J. 2024;28(8):1308–1314. doi:10.1007/s10995-024-03935-1
 © 2025 The Author(s). This work is published and licensed by Dove Medical Press Limited. The
full terms of this license are available at https://www.dovepress.com/terms
and incorporate the Creative Commons Attribution
- Non Commercial (unported, 4.0) License.
By accessing the work you hereby accept the Terms. Non-commercial uses of the work are permitted
without any further permission from Dove Medical Press Limited, provided the work is properly
attributed. For permission for commercial use of this work, please see paragraphs 4.2 and 5 of our Terms.
© 2025 The Author(s). This work is published and licensed by Dove Medical Press Limited. The
full terms of this license are available at https://www.dovepress.com/terms
and incorporate the Creative Commons Attribution
- Non Commercial (unported, 4.0) License.
By accessing the work you hereby accept the Terms. Non-commercial uses of the work are permitted
without any further permission from Dove Medical Press Limited, provided the work is properly
attributed. For permission for commercial use of this work, please see paragraphs 4.2 and 5 of our Terms.