Back to Journals » International Journal of Chronic Obstructive Pulmonary Disease » Volume 13
Blood MCP-1 levels are increased in chronic obstructive pulmonary disease patients with prevalent emphysema
Authors Di Stefano A, Coccini T, Roda E, Signorini C ![]() , Balbi B, Brunetti G, Ceriana P
, Balbi B, Brunetti G, Ceriana P
Received 14 December 2017
Accepted for publication 12 March 2018
Published 24 May 2018 Volume 2018:13 Pages 1691—1700
DOI https://doi.org/10.2147/COPD.S159915
Checked for plagiarism Yes
Review by Single anonymous peer review
Peer reviewer comments 4
Editor who approved publication: Prof. Dr. Richard Russell
Antonino Di Stefano,1 Teresa Coccini,2 Elisa Roda,2 Cinzia Signorini,3 Bruno Balbi,1 Giuseppe Brunetti,4 Piero Ceriana4
1Pulmonary Rehabilitation Unit and Laboratory of Cytoimmunopathology of the Heart and Lung, Istituti Clinici Scientifici Maugeri SpA Società Benefit, Istituto di Ricovero e Cura a Carattere Scientifico (IRCCS), Veruno, Italy; 2Laboratory of Experimental and Clinical Toxicology, Toxicology Unit, ICS Maugeri SpA Società Benefit, Istituto di Ricovero e Cura a Carattere Scientifico, Pavia, Italy; 3Department of Molecular and Developmental Medicine, University of Siena, Siena, Italy; 4Pulmonary Rehabilitation Unit, Istituti Clinici Scientifici Maugeri SpA Società Benefit, Istituto di Ricovero e Cura a Carattere Scientifico, Pavia, Italy
Background and aims: Chronic obstructive pulmonary disease (COPD) is a heterogeneous disease characterized by different phenotypes with either bronchial airways alterations or emphysema prevailing. As blood biomarkers could be clinically useful for COPD stratification, we aimed at investigating the levels of blood biomarkers in COPD patients differentiated by phenotype: prevalent chronic airway disease versus emphysema.
Methods: In 23 COPD patients with prevalent airway disease (COPD-B), 22 COPD patients with prevalent emphysema (COPD-E), 9 control smokers (CSs), and 18 control nonsmokers (CNSs), we analyzed the expression levels of interleukin (IL)-1α, IL-1β, IL-2, IL-4, IL-6, IL-8, IL-10, tumor necrosis factor (TNF)-α, interferon (IFN)-γ, epidermal growth factor (EGF), monocyte chemotactic protein (MCP)-1, and vascular endothelial growth factor by enzyme-linked immunosorbent assay in plasma/serum; glutathione peroxidase and superoxide dismutase (SOD)-1 by immunochemical kits in plasma; and free F2-isoprostanes (F2-IsoPs) by gas chromatography in plasma.
Results: F2-IsoPs level was increased in COPD-B and COPD-E compared with CSs and CNSs; in addition, CS showed higher levels than CNSs; SOD1 level was lower in COPD-B and COPD-E than that in CNSs. Interestingly, MCP-1 level was higher only in COPD-E versus CSs and CNSs; EGF and IL-8 levels were higher in COPD-B and COPD-E versus CNSs; IL-6 level was increased in all three smoking groups (COPD-B, COPD-E, and CSs) versus CNS; IFN-γ and IL-1α levels were higher in CSs than in CNSs; and IL-1α level was also higher in CSs versus COPD-B and COPD-E. In all subjects, F2-IsoPs level correlated positively and significantly with MCP-1, IL-2, IL-1β, IFN-γ, and TNF-α and negatively with SOD1. When correlations were restricted to COPD-E and COPD-B groups, F2-IsoPs maintained the positive associations with IFN-γ, TNF-α, and IL-2.
Conclusion: We did not find any specific blood biomarkers that could differentiate COPD patients with prevalent airway disease from those with prevalent emphysema. The MCP-1 increase in COPD-E, associated with the imbalance of oxidant/antioxidant markers, may play a role in inducing emphysema.
Keywords: serum, phenotypes, endotypes, biomarkers, asthma, airway inflammation
Introduction
Chronic obstructive pulmonary disease (COPD) is characterized by poor reversible airflow limitation caused by varying combinations of bronchial airway disease and lung parenchymal emphysema.1 The identification of blood biomarkers, particularly for emphysema, which could assess this heterogeneity may help to manage and treat patients with COPD.1 The analysis of peripheral blood samples is considered a valid method for monitoring inflammatory biomarkers,2 in addition to being easily available.
Smoking induces a significant increase of monocyte chemotactic protein (MCP)-1 levels in the bronchoalveolar lavage (BAL) fluid of both healthy smokers3 and patients with chronic bronchitis,4 and COPD patients show higher plasma MCP-1 levels compared with healthy controls.5 However, MCP-1 plasma levels have not been analyzed according to the different COPD phenotypes. Both interleukin (IL)-1α and IL-1β are proinflammatory cytokines produced mainly by monocytes, macrophages, and fibroblasts.6,7 There are increased levels of IL-1β in serum, sputum, and BAL in patients with stable COPD.8,9 There is evidence that inflammation in COPD is characterized by an increase in the levels of IL-6, IL-8, and tumor necrosis factor (TNF)-α in the peripheral blood.10 IL-8 is a chemotactic factor for neutrophils. Levels increase in induced sputum of COPD patients as the number of exacerbations increases.11 The proinflammatory cytokine IL-6 may play an important role in the progression of COPD severity,12 and increased serum levels of IL-6 during COPD exacerbations have been described.13 However, comorbidities may influence the IL-6 plasma level increase.14 TNF-α is an important chemotactic protein for neutrophils, and its increase in the blood of COPD patients may induce an increased expression of adhesion molecules. Increased circulating TNF-α might also be the cause of skeletal muscle cell apoptosis (muscle cachexia) in COPD patients.15,16 IL-2 is necessary for the differentiation and expansion of T lymphocytes. Its serum levels were higher in patients with stable disease compared with patients with progressive COPD.17 IL-4, a pleiotropic cytokine, produced by activated T cells, can facilitate the differentiation of both mucus-secreting tissue18,19 and B lymphocytes.20 Interferon (IFN)-γ is produced by Th1 lymphocytes and is an essential component of the host immune responses to pathogens.21 All COPD exacerbations are characterized by increased plasma levels of vascular endothelial growth factor (VEGF), which is a signal protein that stimulates vasculogenesis and angiogenesis. Increased plasma levels of IL-10, an anti-inflammatory cytokine, are found when COPD exacerbations are induced by virus.22 Epidermal growth factor (EGF) stimulates human airway smooth muscle proliferation.23 An increased EGF expression is reported in the epithelium and submucosal cells of patients with chronic bronchitis.24
Among the oxidant and antioxidant markers, the superoxide dismutase (SOD)-1 family contains enzymes that catalyze the dismutation (or partitioning) of the superoxide (O2−) radical into either ordinary molecular oxygen (O2) or hydrogen peroxide (H2O2). Glutathione peroxidase (GPx) reduces lipid hydroperoxides to their corresponding alcohols and reduces free H2O2 to water. An increase in GPx and SOD activities has been found during exacerbations of COPD compared with stable disease.25 In addition, there are F2-isoprostanes (F2-IsoPs), which are prostaglandin-like compounds formed by the free radical-mediated oxidation of arachidonic acid.26 They are a fundamental marker for measuring oxidative stress in the body. F2-IsoPs also have potent biological effects associated with inflammation and therefore may mediate chronic disease initiation and progression. In particular, 8-iso prostaglandin F2 (PGF2),27 an isomer of the PGF2 family (F2-IsoPs) also known as iPF2α-III, is a stimulating factor for pulmonary vascular and bronchial smooth muscle contraction.28,29 This suggests that this isoprostane may be a local marker of airway inflammation caused by oxidant injury. Again, a comparison of these oxidant and antioxidant markers between different phenotypes of COPD has not yet been performed.
The aim of this study was, therefore, to analyze some relevant inflammatory, oxidant, and antioxidant molecules present in different phenotypes of COPD patients showing prevalent airway disease versus prevalent emphysema.
Patients and methods
Subjects
All COPD and healthy control subjects included in this study were recruited from the Respiratory Medicine Unit of Istituti Clinici Scientifici Maugeri (Pavia, Italy). In COPD patients, the severity of the airflow obstruction was staged using the current Global Initiative for Chronic Obstructive Lung Disease criteria.1 All former smokers had stopped smoking for at least 1 year prior to the study. The phenotypic attribution of each patient (prevalent airway disease versus prevalent emphysema) was based on clinical and instrumental data.30,31 According to this model, a score >0.56 corresponded to the emphysema phenotype and <0.56 corresponded to the prevalent airway disease phenotype. The group of patients with prevalent airway disease also suffered from chronic bronchitis. Chronic bronchitis was defined by the presence of cough and sputum production for at least 3 months in each of the 2 years prior to enrollment.1 By definition, chronic bronchitis was not present in the group of COPD patients with prevalent emphysema. Control smokers (CSs) and control nonsmokers (CNSs) were recruited as volunteers. None of the patients were treated with theophylline, roflumilast, antibiotics, antioxidants, mucolytics, and/or glucocorticoids in the month prior to the collection of blood samples. All the patients were in a stable phase of the disease and had been free from any episode of exacerbation for at least 3 months. They were all on regular treatment with bronchodilators according to the prescription of the referring physician. Table 1 summarizes the clinical details and functional data of the subjects.
 | Table 1 Clinical characteristics of COPD patients by phenotype and control subjects who provided blood samples |
Ethical approval
Written informed consent was obtained from each participant prior to the study. The study was carried out in conformity with the 1975 Declaration of Helsinki, according to the local ethics committee guidelines, and it was approved by the Ethics Committee of the Istituti Clinici Scientifici Maugeri of Pavia (formerly, Fondazione Salvatore Maugeri, Istituto di Ricovero e Cura a Carattere Scientifico [IRCCS]; ethical committee number: 966).
Lung function tests and volumes
Pulmonary function tests were performed as previously described32 according to the guideline recommendations.33 Pulmonary function tests included measurements of forced expiratory volume in 1 second (FEV1; L), FEV1%, FEV1/forced vital capacity (FVC; %), residual volume (RV), RV%, diffusing capacity of the lungs for carbon monoxide (DLCO), DLCO%, and the number of exacerbations/year under baseline conditions in all the subjects examined (V6200 Autobox Pulmonary Function Laboratory; SensorMedics, Yorba Linda, CA, USA; Table 1).
Blood/serum collection and analysis
Blood samples were collected in Vacutainer® tubes (Becton Dickinson, Plymouth, UK) within 1 week after the diagnosis and spirometry evaluations. For serum preparation, venous blood was immediately centrifuged at 3,000 g for 15 minutes at 4°C. Serum was separated and stored in aliquots at −20°C until analysis.
Measurement of blood biomarkers
Serum cytokines and growth factors
The following cytokines and growth factors were determined: IL-1α, IL-1β, IL-2, IL-4, IL-6, IL-8, IL-10, TNF-α, INF-γ, EGF, MCP-1, and VEGF. All these analyses were included in a single panel analyzed and quantified with Evidence Investigator, a high-throughput automated biochip immunoassay system (Randox Laboratories, Crumlin, UK). The biochip used consisted of a 9×9 mm substrate on which discrete test regions have been constructed. The binding ligands (antibodies) were attached to predefined sites on the chemically modified surface of the biochip. After the enzyme-linked immunosorbent assay procedure, each spot is imaged to capture the chemiluminescent signals generated at them on the array. The light signal is captured by a charge-coupled device camera as part of an imaging station and converted by image-processing software to provide results compared with calibration curves for each location on the biochip. The use of this protein array technology34 has advantages over conventional assay methods that include simultaneous detection of multiple analyses from a minute plasma sample within a single assay.
Blood antioxidant enzymes – GPx1 and SOD1
The quantitative determination of GPx1 in whole blood was performed using a commercial immunochemical kit (RANSEL; Randox Laboratories). Briefly, the heparinized whole blood was diluted with 1 mL of diluting agent and incubated for 5 minutes. After incubation, 1 mL of hemoglobin reagent (cyanide) was added in order to avoid falsely elevated results due to the presence of endogenous peroxidases. Finally, the samples were assayed within 20 minutes using an automated analyzer (BT2000; Biotecnica Instruments, Limena, Italy). The quantitative determination of SOD1 in whole blood was performed using a commercial immunochemical kit (RANSOD; Randox Laboratories). Briefly, 0.5 mL of heparinized whole blood samples was centrifuged for 10 minutes at 3,000 rpm in order to carefully wash the erythrocytes. Then, the erythrocytes were washed four times with 0.9% NaCl solution and centrifuged for 10 minutes at 3,000 rpm after each wash. Subsequently, the erythrocytes were made up to 2.0 mL with cold redistilled water, mixed, and left to stand at +4°C for 15 minutes. Finally, the lysate was diluted with sample diluent and assayed immediately using an automated analyzer (BT2000; Biotecnica Instruments) according to the manufacturer’s instructions.
Plasma oxidative stress markers – free F2-IsoPs
Blood was collected in heparinized tubes, and then blood samples were centrifuged at 2,400 g for 15 minutes at 4°C; the platelet-poor plasma was saved, and the buffy coat was removed by aspiration. Plasma samples were stored at −20°C until analyzed. Free F2-IsoPs were determined by gas chromatography/negative-ion chemical ionization tandem mass spectrometry (GC/NICI-MS/MS) in samples, as described by Signorini et al.35,36 In previous studies,35–39 GC/NICI-MS/MS has proved to be a reliable procedure (in terms of specificity, repeatability, and accuracy) to assess F2-IsoPs as an indicator of free radical-induced lipid peroxidation. For plasma-free F2-IsoPs determination, butylated hydroxytoluene (90 μM) was added to the plasma as an antioxidant. An aliquot of plasma (1 mL) was spiked with tetradeuterated PGF2α (PGF2α-d4. 500 pg in 50 μL of ethanol; Cayman, Ann Arbor, MI, USA), as an internal standard. After acidification, by the addition of 2 mL of acidified water (pH =3), the extraction and purification procedure was carried out. It consisted of two solid-phase separation steps: an octadecylsilane (C18) cartridge followed by an aminopropyl (NH2) cartridge (Waters, Milford, MA, USA).35 A derivatization step followed the solid-phase extraction. The carboxylic group was derived as the pentafluorobenzyl ester, whereas the hydroxyl groups were converted to trimethylsilyl ethers. In the GC/NICI-MS/MS analysis, the measured ions were the product ions at m/z of 299 and 303 derived from the [M-181]-precursor ions (m/z =569 and m/z =573) produced from 15-F2t-IsoPs, the most represented F2-IsoP isomer, and the tetradeuterated derivative of the PGF2α-d4, respectively.35 Plasma-free F2-IsoPs were expressed as picograms per milliliter. The calibration curve correlations were adequate (r2=0.994); accuracy was 97.8%, and the variability coefficient was 2.5. The minimum detection limit was 5 pg/mL.
Statistical analysis
Continuous data were expressed as mean ± standard deviation (SD). Biomarkers were expressed as median (range). Analysis of variance (ANOVA) and unpaired t-tests were applied for functional data. The Kruskal–Wallis test followed by Mann–Whitney U tests was applied for nonparametric parameters to compare all groups; p-values <0.05 were considered as significant. All calculations were performed using the StatView® (1992–1998 Version 5.0.1; SAS Institute Inc., Cary, NC, USA).
Results
Clinical characteristics of subjects
We studied blood serum biomarkers from 72 subjects: 45 with stable COPD, 9 CSs with normal lung function, and 18 nonsmokers with normal lung function (Table 1). COPD patients were divided into two groups by phenotype: COPD patients with prevalent airway disease (COPD-B group; n=23) and COPD patients with prevalent emphysema (COPD-E group; n=22) as stated in the “Methods” section, following cutoff values previously defined.30 The smoking history did not differ significantly between the three smoking groups. COPD-B and COPD-E groups had similar age (mean ± SD: 73.78±5.87 and 71.77±5.56, respectively), and both differed from CSs (54.85±8.29, p<0.01) and CNSs (49.28±7.56, p<0.01). Values of FEV1, RVs (L and %), and FEV1/FVC (%) in each COPD group differed significantly from both control groups (healthy smokers and healthy nonsmokers). No significant differences were observed for functional parameters (FEV1, FEV1/FVC (%), RV, and DLCO), 6-minute walking test (6MWD), or numbers of exacerbations/year between the two COPD groups (B and E; Table 1).
Cytokines, growth factors, antioxidant enzymes, and oxidative stress markers in the blood
Serum levels of IL-1β, IL-2, IL-4, IL-10, TNF-α, VEGF, and GPx1 did not differ significantly in the four groups (Table 2). IL-1α was significantly lower in COPD-B (p=0.0119), COPD-E (p=0.0408), and CNSs (p=0.0064) compared with CSs (Tables 1 and 2). IL-6 levels were significantly higher in COPD-B (p<0.0001), COPD-E (p<0.0001), and CSs (p=0.0064) compared with CNSs (Tables 1 and 2; Figure 1A). IL-8 was significantly higher in COPD-B (p=0.0292) and COPD-E (p=0.0047) compared with CNSs (Tables 1 and 2; Figure 1B). IFN-γ levels were significantly higher in CSs (p=0.0206) compared with CNSs (Tables 1 and 2). EGF levels were significantly higher in COPD-B (p=0.0459) and COPD-E (p=0.0036) than in CNSs (Tables 1 and 2; Figure 1C). Interestingly, MCP-1 levels were significantly increased only in COPD-E compared with CSs and CNSs (p=0.0453 and 0.0023, respectively; Tables 1 and 2; Figure 1D). SOD1 levels were significantly lower in COPD-B (p=0.0121) and COPD-E (p=0.0122) compared with CNSs (Tables 2 and 3; Figure 1E). F2-IsoPs levels were significantly increased in COPD-B (p=0.0081 and <0.0001, respectively) and COPD-E (p=0.0385 and <0.0001, respectively) compared with both CSs and CNSs; CSs (p=0.0122) also showed increased F2-IsoPs levels compared with CNSs (Tables 2 and 3; Figure 1F).
 | Figure 1 IL-6 is significantly increased in the blood of COPD patients with prevalent emphysema (E group), prevalent airway disease (B group), and CSs compared with CNSs (A); IL-8 is significantly increased in COPD-E and COPD-B compared with CNSs (B); EGF is significantly increased in COPD patients from COPD-E and COPD-B groups compared with CNSs (C); MCP-1 is significantly increased in COPD-E compared with CSs and CNSs (D); SOD-1 is significantly decreased in COPD-E and COPD-B compared with CNSs (E); F2-IsoPs is significantly increased in both COPD-B and COPD-E groups compared with CSs and CNSs, and CSs also showed higher levels compared with CNSs (F). Bar lines represent median values. |
 | Table 2 Quantification of molecules related to oxidative stress and cytokines in the blood |
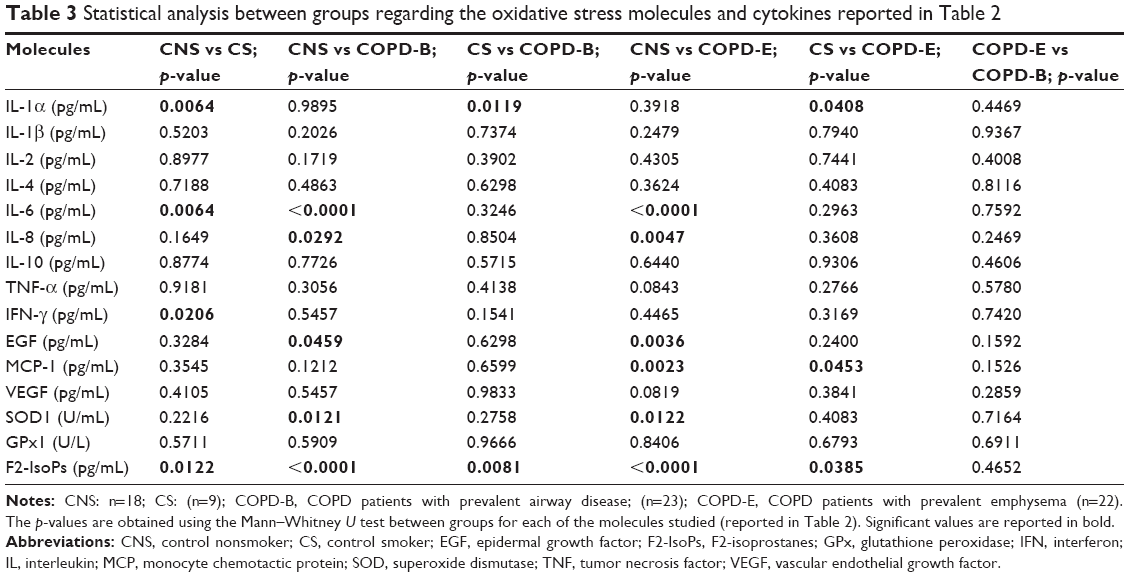 | Table 3 Statistical analysis between groups regarding the oxidative stress molecules and cytokines reported in Table 2 |
Correlations between oxidative stress markers and markers of inflammation or functional parameters
In the overall study population (patients and control subjects), the levels of F2-IsoPs oxidant marker correlated significantly and positively with the levels of circulating MCP-1 (R=0.30, p=0.014), IL-2 (R=0.33, p=0.008), IL-1β (R=0.34, p=0.005), IFN-γ (R=0.48, p=0.0001), and TNF-α (R=0.44, p=0.0004; Figure 2A–E, respectively). Interestingly, F2-IsoPs levels also correlated inversely with SOD1 levels in the blood (R=−0.41, p=0.0001; Figure 2F). Considering the COPD patients alone (B+E), F2-IsoPs levels in the blood correlated significantly and positively with IFN-γ levels (R=0.70, p<0.0001), TNF-α (R=0.39, p=0.015), and IL-2 (R=0.49, p=0.002; Figure 3A–C, respectively). All the R and p-values were maintained after exclusion of the outlier case: Figure 2D, R=0.459, p=0.0003; Figure 2E, R=0.413, p=0.0010; Figure 2F, R=−0.394, p=0.0019; Figure 3A, R=0.679, p<0.0001; Figure 3B, R=0.344, p=0.0338. No other significant correlations were observed between blood–blood biomarkers or blood versus functional data.
 | Figure 2 Regression analysis performed in all COPD patients (COPD-E and COPD-B groups) and CS and CNS groups showing correlations between F2-IsoPs and MCP-1 (A), IL-2 (B), IL-1β (C), IFN-γ (D), TNF-α (E), and SOD1 (F). All inflammatory molecules correlated positively and significantly with the oxidative stress marker F2-IsoPs. SOD1 correlated inversely and significantly with the oxidative stress marker F2-IsoPs. |
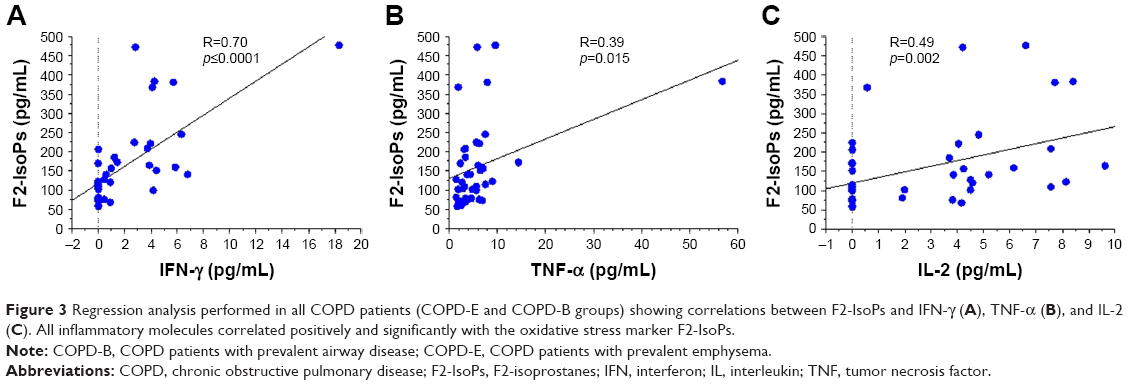 | Figure 3 Regression analysis performed in all COPD patients (COPD-E and COPD-B groups) showing correlations between F2-IsoPs and IFN-γ (A), TNF-α (B), and IL-2 (C). All inflammatory molecules correlated positively and significantly with the oxidative stress marker F2-IsoPs. |
Discussion
We have shown in this study that there is an increase in the oxidative stress marker F2-IsoPs and that there is a decrease in the antioxidant SOD1 in the blood of COPD patients, including those with prevalent airway disease and those with prevalent emphysema, compared with CNSs. A parallel increase in the inflammatory IL-6 and IL-8 and an increase in the remodeling marker EGF were also observed in these patients. MCP-1 selectively increased in the subgroup of patients with prevalent emphysema when compared to CNSs. In COPD patients, F2-IsoPs correlated positively with selected inflammatory markers.
Previous studies have shown higher plasma MCP-1 levels in COPD patients compared with healthy controls4 and greater concentrations of inflammatory cells together with higher levels of IL-1β, IL-6, IL-8, and MCP-1 in smokers compared with nonsmokers.2 However, these studies are only partially comparable with ours since we studied MCP-1 blood levels and inflammatory cytokines in two different phenotypes of COPD and compared them with both CSs and CNSs. Furthermore, 69% of our COPD patients were ex-smokers (quit smoking since at least 1 year). Interestingly, as an extension of a previous study,4 we observed that the MCP-1 level in the blood was significantly increased in the subgroup of COPD patients with prevalent emphysema, suggesting a potential role for this molecule underlying the lung alterations related to this phenotype of COPD. In line with this notion, increased inflammation was reported in the lung parenchyma and alveolar spaces of patients with severe emphysema compared with patients with milder forms of disease.40 However, we could not evaluate the role played by smoking habit in relation to blood biomarkers expression in our patients because of the lack of recent smoking exposure of the majority of our COPD patients (69% of patients equally distributed between B and E groups were ex-smokers since 1 year).
In blood samples, SOD1 levels have been found to be higher in lung cancer (LC)–COPD patients compared with LC patients alone or control subjects;41 conversely, no significant changes in SOD1 genotype frequencies were found between COPD patients and CSs.42 Exhaled 8-isoprostane concentrations were increased in COPD patients compared with healthy smokers and healthy nonsmokers,43 and F2-IsoPs were considered central in the pathogenesis of COPD.44 We observed a clear imbalance between blood F2-IsoPs and SOD1 in both groups of COPD patients (B and E), showing an increase in the oxidant marker, F2-IsoPs, and a decrease in SOD1 compared with CNSs. This finding seems to apply to all COPD patients irrespective of the degree of prevalent airway disease or lung emphysema. Interestingly, the oxidant molecule, F2-IsoPs, was positively correlated with the inflammatory markers of systemic inflammation (MCP-1, IL-2, IL-1β, IFN-γ, and TNF-α) and inversely correlated with SOD1 blood levels in all subjects, reinforcing the notion of a potential relationship between oxidant burden increase and related inflammation, on the one side, and decreased lung protection, on the other.
The blood glutathione peroxidase activity has been reported to be decreased in COPD patients compared with CNSs,45 and this decrease was particularly significant in severe COPD compared with mild disease.46 An increase in antioxidant defenses during exacerbations of COPD has also been reported.25 We did not observe any significant variation in GPx1 levels in our COPD patients with prevalent airway disease or prevalent emphysema compared with CSs or CNSs. This apparent discrepancy may be due in part to the mild/moderate disease state of our patients and also to the different patient stratification (B and E groups) used in the present study.
In a study of COPD patients with increasing disease severity, the level of heparin-binding EGF was increased compared with control subjects.47 In another study, comparing subjects with and without computed tomography-detected emphysema and the absence of bronchial obstruction, a significant reduction in EGF blood levels was observed in the emphysema group.48 These studies are poorly comparable with each other and with our present work on account of significant differences in the COPD patients grouping; however, our observation of increased EGF blood levels in both COPD (B and E) subgroups in comparison with CNSs confirms in part Cockayne et al’s study results47 and supports the notion of an involvement of remodeling biomarkers in COPD, particularly in the presence of bronchial obstruction.
In line with previous studies,49 we confirmed increased levels of IL-6 and IL-8 in the blood of COPD patients compared with CNSs, markers that have also been associated with progressive airflow obstruction (IL-6) and progressive emphysema (IL-6 and IL-8).50
IL-2 has been reported to be increased in COPD patients compared with controls,50 but was lower in rapid decliners compared with stable COPD patients.51 IL-10 in the blood of COPD patients was reported as increased in one study,50 but in another study, it did not differ in COPD patients compared with controls.52 IL-2 and IL-10 as well as IFN-γ and TNF-α were not reported to be associated with the progression of emphysema.50 In our present study, the levels of IL-2 and IL-10 as well as IFN-γ and TNF-α in the two COPD (B and E) groups were not different with respect to CSs and CNSs, suggesting a relatively modest role for these blood biomarkers in the endotyping of our COPD groups.
In a recent study, biomass smoking COPD patients showed higher levels of Th2 cells and serum IL-4 compared with tobacco-smoking COPD patients.20 In agreement, we did not find any significant difference in the blood IL-4 measurements when comparing smokers and ex-smokers from the COPD groups (B and E) to control subjects, suggesting again a minor role for this circulating cytokine in the endotyping of COPD patients.
VEGF serum levels have been variously reported as proportionally increased in COPD patients with increasing disease severity53 compared with control subjects, or not changed in either stable or exacerbated COPD when the association with clinically significant outcomes was studied.54 We did not find any significant changes in VEGF levels when comparing the COPD-B and COPD-E groups with CSs and CNSs, suggesting again that this remodeling biomarker does not seem to play a significant role in COPD endotyping.
In mice, cigarette smoke-induced neutrophilia is dependent on IL-1α,55 and mice smoke exposure leads to increased recruitment and activation of dendritic cells.56 Airway epithelial cells-derived IL-1α increased upon epithelial exposure to cigarette smoke extract.57 In our study, we found the highest IL-1α blood values in smokers compared both with CNSs and with the two COPD groups (B and E), suggesting that it is the smoking habit, more than the disease state, that most influences the blood level of this cytokine.
Plasma levels of IL-1β have been reported as increased in smokers with COPD compared with CSs49 or CNSs,58 and sputum gene expression of IL-1β at baseline was higher in frequent exacerbators with COPD.59 In bronchial and lung tissue, IL-1β immunoexpression was found to be very low, and it was similar in COPD patients and control subjects.60 In our present study, we did not find significant differences in IL-1β blood levels when COPD-B and COPD-E groups were compared with CSs or CNSs. This may be due to the stable state of the disease of our patients and, in part, to the different stratification method used for grouping of our COPD patients. As a limitation of this study, we did not establish cutoff values for each one of the biomarkers studied for COPD-B and COPD-E groups, related to CNSs. This was due to the relatively low number of patients studied.
Conclusion
We did not find any specific blood biomarkers that could differentiate COPD patients with prevalent airway disease from those with prevalent emphysema. Studies sampling directly the target organ by bronchial biopsy, BAL, or sputum investigations are warranted to further characterize these COPD phenotypes.
Acknowledgment
This study was supported by Istituti Clinici Scientifici Maugeri, IRCCS, Ricerca Corrente.
Disclosure
The authors report no conflicts of interest in this work.
References
Vestbo J, Hurd SS, Agusti AG, et al. Global strategy for the diagnosis, management and prevention of chronic obstructive pulmonary disease: GOLD executive summary. Am J Respir Crit Care Med. 2013;187(4):347–365. | ||
Reuben DB, Cheh AI, Harris TB, et al. Peripheral blood markers of inflammation predict mortality and functional decline in high-functioning community-dwelling older persons. J Am Geriatr Soc. 2002;50(4):638–644. | ||
Kuschner WG, D’Alessandro A, Wong H, Blanc PD. Dose-dependent cigarette smoking-related inflammatory responses in healthy adults. Eur Respir J. 1996;9(10):1989–1994. | ||
Capelli A, Di Stefano A, Gnemmi I, et al. Increased MCP-1 and MIP-1beta in bronchoalveolar lavage fluid of chronic bronchitis. Eur Respir J. 1999;14(1):160–165. | ||
Liu SF, Wang CC, Fang WF, Chen YC, Lin MC. MCP1-2518 polymorphism and chronic obstructive pulmonary disease in Taiwanese men. Exp Lung Res. 2010;36(5):277–283. | ||
Lord PC, Wilmoth LM, Mizel SB, McCall CE. Expression of interleukin-1 alpha and beta genes by human blood polymorphonuclear leukocytes. J Clin Invest. 1991;87(4):1312–1321. | ||
Rosenwasser LJ. Biologic activities of IL-1 and its role in human disease. J Allergy Clin Immunol. 1998;102(3):344–350. | ||
Ferhani N, Letuve S, Kozhich A, et al. Expression of high-mobility group box 1 and of receptor for advanced glycation end products in chronic obstructive pulmonary disease. Am J Respir Crit Care Med. 2010;181(9):917–927. | ||
Singh B, Arora S, Khanna V. Association of severity of COPD with IgE and interleukin-1 beta. Monaldi Arch Chest Dis. 2010;73(2):86–87. | ||
Tanni SE, Pelegrino NR, Angeleli AY, Correa C, Godoy I. Smoking status and tumor necrosis factor-alpha mediated systemic inflammation in COPD patients. J Inflamm (Lond). 2010;7:29. | ||
Wedzicha JA, Seemungal TA, MacCallum PK, et al. Acute exacerbations of chronic obstructive pulmonary disease are accompanied by elevations of plasma fibrinogen and serum IL-6 levels. Thromb Haemost. 2000;84(2):210–215. | ||
Cosio MG, Saetta M, Agusti A. Immunologic aspects of chronic obstructive pulmonary disease. N Engl J Med. 2009;360(23):2445–2454. | ||
Seemungal T, Harper-Owen R, Bhowmik A, et al. Respiratory viruses, symptoms, and inflammatory markers in acute exacerbations and stable chronic obstructive pulmonary disease. Am J Respir Crit Care Med. 2001;164(9):1618–1623. | ||
Vanfleteren LE, Spruit MA, Groenen M, et al. Clusters of comorbidities based on validated objective measurements and systemic inflammation in patients with chronic obstructive pulmonary disease. Am J Respir Crit Care Med. 2013;187(7):728–735. | ||
Barnes PJ. Cytokine-directed therapies for the treatment of chronic airway diseases. Cytokine Growth Factor Rev. 2003;14(6):511–522. | ||
Lewis MI. Apoptosis as a potential mechanism of muscle cachexia in chronic obstructive pulmonary disease. Am J Respir Crit Care Med. 2002;166(4):434–436. | ||
Paone G, Leone V, Conti V, et al. Blood and sputum biomarkers in COPD and asthma: a review. Eur Rev Med Pharmacol Sci. 2016;20(4):698–708. | ||
Temann UA, Prasad B, Gallup MW, et al. A novel role for murine IL-4 in vivo: induction of MUC5AC gene expression and mucin hypersecretion. Am J Respir Cell Mol Biol. 1997;16(4):471–478. | ||
Dabbagh K, Takeyama K, Lee HM, Ueki IF, Lausier JA, Nadel JA. IL-4 induces mucin gene expression and goblet cell metaplasia in vitro and in vivo. J Immunol. 1999;162(10):6233–6237. | ||
Solleiro-Villavicencio H, Quintana-Carrillo R, Falfán-Valencia R, Vargas-Rojas MI. Chronic obstructive pulmonary disease induced by exposure to biomass smoke is associated with a Th2 cytokine production profile. Clin Immunol. 2015;161(2):150–155. | ||
Schoenborn JR, Wilson CB. Regulation of interferon-gamma during innate and adaptive immune responses. Adv Immunol. 2007;96:41–101. | ||
Almansa R, Sanchez-Garcia M, Herrero A, et al. Host response cytokine signatures in viral and nonviral acute exacerbations of chronic obstructive pulmonary disease. J Interferon Cytokine Res. 2011;31(5):409–413. | ||
Hirst SJ, Barnes PJ, Twort CH. Quantifying proliferation of cultured human and rabbit airway smooth muscle cells in response to serum and platelet derived growth factor. Am J Respir Cell Mol Biol. 1992;7(6):574–581. | ||
Vignola AM, Chanez P, Chiappara G, et al. Transforming growth factor-b expression in mucosal biopsies in asthma and chronic bronchitis. Am J Respir Crit Care Med. 1997;156(2 Pt 1):591–599. | ||
Sadowska AM, Luyten C, Vints AM, Verbraecken J, Van Ranst D, De Backer WA. Systemic antioxidant defences during acute exacerbation of chronic obstructive pulmonary disease. Respirology. 2006;11(6):741–747. | ||
Musiek ES, Morrow JD. F2-isoprostanes as markers of oxidant stress: an overview. Curr Protoc Toxicol. 2005;Chapter 17:Unit 17.5. | ||
Rokach J, Khanapure SP, Hwang SW, Adiyaman M, Lawson JA, FitzGerald GA. Nomenclature of isoprostanes: a proposal. Prostaglandins. 1997;54(6):853–873. | ||
Banerjee M, Kang KH, Morrow JD, Roberts LJ, Newman JH. Effects of a novel prostaglandin, 8-epi PGF2 alpha, in rabbit lung in situ. Am J Physiol. 1992;263(3 Pt 2):H660–H663. | ||
Kawikova I, Barnes PJ, Takasaki T, Tadjkarimi S, Yacoub MH, Belvis MG. 8-epi prostaglandin F2a, a novel noncyclooxygenase derived prostaglandin, constricts airways in vitro. Am J Respir Crit Care Med. 1996;153:590–596. | ||
Pistolesi M, Camiciottoli G, Paoletti M, et al. Identification of a predominant COPD phenotype in clinical practice. Respir Med. 2008;102(3):367–376. | ||
Camiciottoli G, Bigazzi F, Paoletti M, Cestelli L, Lavorini F, Pistolesi M. Pulmonary function and sputum characteristics predict computed tomography phenotype and severity of COPD. Eur Respir J. 2013;42(3):626–635. | ||
Di Stefano A, Caramori G, Gnemmi I, et al. Association of increased CCL5 and CXCL7 chemokine expression with neutrophil activation in severe stable COPD. Thorax. 2009;64(11):968–975. | ||
Quanjer PH, Tammeling GJ, Cotes JE, Pedersen OF, Peslin R, Yernault JC. Lung volumes and forced ventilatory flows. Report Working Party Standardization of Lung Function Tests, European Community for Steel and Coal. Official Statement of the European Respiratory Society. Eur Respir J Suppl. 1993;16:5–40. | ||
FitzGerald SP, Lamont JV, McConnell RI, Benchikh el O. Development of a high-throughput automated analyzer using biochip array technology. Clin Chem. 2005;51(7):1165–1176. | ||
Signorini C, Comporti M, Giorgi G. Ion trap tandem mass spectrometric determination of F2-isoprostanes. J Mass Spectrom. 2003;38(10):1067–1074. | ||
Signorini C, Ciccoli L, Leoncini S, et al. Free iron, total F-isoprostanes and total F-neuroprostanes in a model of neonatal hypoxic-ischemic encephalopathy: neuroprotective effect of melatonin. J Pineal Res. 2009;46(2):148–154. | ||
De Felice C, Ciccoli L, Leoncini S, et al. Systemic oxidative stress in classic Rett syndrome. Free Radic Biol Med. 2009;47(4):440–448. | ||
Signorini C, Perrone S, Sgherri C, et al. Plasma esterified F2-isoprostanes and oxidative stress in newborns: role of nonprotein-bound iron. Pediatr Res. 2008;63(3):287–291. | ||
Soffler C, Campbell VL, Hassel DM. Measurement of urinary F2-isoprostanes as markers of in vivo lipid peroxidation: a comparison of enzyme immunoassays with gas chromatography-mass spectrometry in domestic animal species. J Vet Diagn Invest. 2010;22(2):200–209. | ||
Retamales I, Elliott WM, Meshi B, et al. Amplification of inflammation in emphysema and its association with latent adenoviral infection. Am J Respir Crit Care Med. 2001;164(3):469–473. | ||
Mateu-Jiménez M, Sánchez-Font A, Rodríguez-Fuster A, et al. Redox imbalance in lung cancer of patients with underlying chronic respiratory conditions. Mol Med. Epub 2016 Jan 7. | ||
Young RP, Hopkins R, Black PN, et al. Functional variants of antioxidant genes in smokers with COPD and in those with normal lung function. Thorax. 2006;61(5):394–399. | ||
Montuschi P, Collins JV, Ciabattoni G, et al. Exhaled 8-isoprostane as an in vivo biomarker of lung oxidative stress in patients with COPD and healthy smokers. Am J Respir Crit Care Med. 2000;162(3 Pt 1):1175–1177. | ||
Rolin S, Masereel B, Dogné JM. Prostanoids as pharmacological targets in COPD and asthma. Eur J Pharmacol. 2006;533(1–3):89–100. | ||
Santos MC, Oliveira AL, Viegas-Crespo AM, et al. Systemic markers of the redox balance in chronic obstructive pulmonary disease. Biomarkers. 2004;9(6):461–469. | ||
Kluchová Z, Petrásová D, Joppa P, Dorková Z, Tkácová R. The association between oxidative stress and obstructive lung impairment in patients with COPD. Physiol Res. 2007;56(1):51–56. | ||
Cockayne DA, Cheng DT, Waschki B, et al. Systemic biomarkers of neutrophilic inflammation, tissue injury and repair in COPD patients with differing levels of disease severity. PLoS One. 2012;7(6):e38629. | ||
de-Torres JP, Blanco D, Alcaide AB, et al. Smokers with CT detected emphysema and no airway obstruction have decreased plasma levels of EGF, IL-15, IL-8 and IL-1ra. PLoS One. 2013;8(4):e60260. | ||
Agusti A, Sin DD. Biomarkers in COPD. Clin Chest Med. 2014;35(1):131–141. | ||
Bradford E, Jacobson S, Varasteh J, et al. The value of blood cytokines and chemokines in assessing COPD. Respir Res. 2017;18(1):180. | ||
D’Armiento JM, Scharf SM, Roth MD, et al. Eosinophil and T cell markers predict functional decline in COPD patients. Respir Res. 2009;10:113. | ||
Zhang L, Cheng Z, Liu W, Wu K. Expression of interleukin (IL)-10, IL-17A and IL-22 in serum and sputum of stable chronic obstructive pulmonary disease patients. COPD. 2013;10(4):459–465. | ||
Farid Hosseini R, Jabbari Azad F, Yousefzadeh H, et al. Serum levels of vascular endothelial growth factor in chronic obstructive pulmonary disease. Med J Islam Repub Iran. 2014;28:85. eCollection 2014. | ||
Boeck L, Mandal J, Costa L, Roth M, Tamm M, Stolz D. Longitudinal measurement of serum vascular endothelial growth factor in patients with chronic obstructive pulmonary disease. Respiration. 2015;90(2):97–104. | ||
Nikota JK, Shen P, Morissette MC, et al. Cigarette smoke primes the pulmonary environment to IL-1α/CXCR-2-dependent nontypeable Haemophilus influenzae-exacerbated neutrophilia in mice. J Immunol. 2014;193(6):3134–3145. | ||
Botelho FM, Nikota JK, Bauer CM, et al. Cigarette smoke-induced accumulation of lung dendritic cells is interleukin-1α-dependent in mice. Respir Res. 2012;13:81. | ||
Osei ET, Noordhoek JA, Hackett TL, et al. Interleukin-1α drives the dysfunctional cross-talk of the airway epithelium and lung fibroblasts in COPD. Eur Respir J. 2016;48(2):359–369. | ||
Singh B, Arora S, Khanna V. Association of severity of COPD with IgE and interleukin-1 beta. Monaldi Arch Chest Dis. 2010;73(2):86–87. | ||
Fu JJ, McDonald VM, Baines KJ, Gibson PG. Airway IL-1β and systemic inflammation as predictors of future exacerbation risk in asthma and COPD. Chest. 2015;148(3):618–629. | ||
Di Stefano A, Caramori G, Barczyk A, et al. Innate immunity but not NLRP3 inflammasome activation correlates with severity of stable COPD. Thorax. 2014;69(6):516–524. |
 © 2018 The Author(s). This work is published and licensed by Dove Medical Press Limited. The
full terms of this license are available at https://www.dovepress.com/terms
and incorporate the Creative Commons Attribution
- Non Commercial (unported, 3.0) License.
By accessing the work you hereby accept the Terms. Non-commercial uses of the work are permitted
without any further permission from Dove Medical Press Limited, provided the work is properly
attributed. For permission for commercial use of this work, please see paragraphs 4.2 and 5 of our Terms.
© 2018 The Author(s). This work is published and licensed by Dove Medical Press Limited. The
full terms of this license are available at https://www.dovepress.com/terms
and incorporate the Creative Commons Attribution
- Non Commercial (unported, 3.0) License.
By accessing the work you hereby accept the Terms. Non-commercial uses of the work are permitted
without any further permission from Dove Medical Press Limited, provided the work is properly
attributed. For permission for commercial use of this work, please see paragraphs 4.2 and 5 of our Terms.