Back to Journals » International Journal of Nanomedicine » Volume 11
Biomechanical and histological evaluation of the osseointegration capacity of two types of zirconia implant
Authors Han J, Hong G ![]() , Lin H, Shimizu Y, Wu Y, Zheng G, Zhang H, Sasaki K
, Lin H, Shimizu Y, Wu Y, Zheng G, Zhang H, Sasaki K
Received 11 August 2016
Accepted for publication 27 October 2016
Published 7 December 2016 Volume 2016:11 Pages 6507—6516
DOI https://doi.org/10.2147/IJN.S119519
Checked for plagiarism Yes
Review by Single anonymous peer review
Peer reviewer comments 2
Editor who approved publication: Dr Linlin Sun
Jian-min Han,1,2 Guang Hong,3 Hong Lin,1 Yoshinaka Shimizu,4 Yuhan Wu,2 Gang Zheng,1 Hongyu Zhang,5 Keiichi Sasaki2
1Department of Dental Materials, National Engineering Laboratory for Digital and Material Technology of Stomatology, Peking University School and Hospital of Stomatology, Beijing, People’s Republic of China; 2Division of Advanced Prosthetic Dentistry, 3Liaison Center for Innovative Dentistry, 4Department of Oral Pathology, Graduate School of Dentistry, Tohoku University, Sendai, Japan; 5State Key Laboratory of Tribology, Department of Mechanical Engineering, Tsinghua University, Beijing, People’s Republic of China
Abstract: The purpose of this study was to evaluate the biomechanical and histological behavior of a ceria-stabilized zirconia–alumina nanocomposite (NanoZr) in comparison with that of yttria-stabilized tetragonal zirconia polycrystalline (3Y-TZP) in Sprague Dawley rats. Cylindrical NanoZr and 3Y-TZP implants (diameter 1 mm, length 2 mm) were used. Implant-surface morphology and surface roughness were determined by scanning white-light interferometry and scanning electron microscopy, respectively. The cylindrical zirconia implants were placed at the distal edge of the femur of Sprague Dawley rats. At weeks 2, 4, and 8, the interfacial shear strength between implant and bone was measured by push-in test. Histological analysis was performed using hard-tissue sections. Bone–implant contact (BIC), the thickness of new bone around the implant within the bone marrow area, and osteoclast numbers were evaluated. The average surface roughness of 3Y-TZP (Sa 0.788 µm) was significantly higher than that of NanoZr (Sa 0.559 µm). The shear strengths of 3Y-TZP and NanoZr were similar at 2 weeks, but at 4 and 8 weeks the shear strength of NanoZr was higher than that of 3Y-TZP. The average BIC values within the bone marrow area for 3Y-TZP and NanoZr were 25.26% and 31.51% at 2 weeks, 46.78% and 38% at 4 weeks, and 47.88% and 56.81% at 8 weeks, respectively. The average BIC values within the cortical area were 38.86% and 58.42% at 2 weeks, 66.82% and 57.74% at 4 weeks, and 79.91% and 78.97% at 8 weeks, respectively. The mean BIC value did not differ significantly between the two zirconia materials at any time point. The NanoZr implants were biocompatible, capable of establishing close BIC, and may be preferred for metal-free dental implants.
Keywords: zirconia, dental implant, zirconia–alumina nanocomposite, push-in test, histomorphometry
Introduction
Zirconia ceramics were introduced to dentistry more than two decades ago. In addition to its use for crown and bridge construction, there is considerable interest in the use of zirconia in implant dentistry.1,2 Due to its outstanding mechanical properties, stable physical and chemical properties, and excellent biocompatibility, it can offset the grayish appearance of gingiva3–5 and the potential hypersensitivity of titanium metal implants.6–9 Metal-free dental zirconia implants are thus of considerable interest.
Most of the zirconia used in implant dentistry is in the form of 3 mol% yttria-stabilized tetragonal zirconia polycrystalline (3Y-TZP). Various studies have verified that 3Y-TZP induces no or a slight inflammatory reaction and protein adsorption, osteoblast/osteoblast-like cell attachment, spreading, proliferation, differentiation, bone–implant contact (BIC) rates, and bone–implant bond strength (push-in or torque-out test), similarly to titanium implants.10–15 The flexural strength of 3Y-TZP is 900–1,200 MPa, and its fracture toughness is 8–10 MPa·m½.16 The static fracture strength of a 3Y-TZP implant is 725–850 N, which is within the limits of acceptability for clinical implant dentistry.17 However, zirconia implants have a high risk of fracture. Gahlert et al18 reported that the failure rate of zirconia implants approached 10% after 20–50 months (average 36.75 months) of prosthetic loading, and Osman et al19 reported a 4.1% fracture rate of zirconia implants after 1 year of follow-up; in contrast, titanium dental implants rarely fracture.20 Fracture of dental zirconia implants may be associated with their lower physical and mechanical properties and low-temperature aging degradation and/or stress fatigue. Therefore, a highly reliable metal-free material with greater strength and toughness and enhanced resistance to fatigue and low-temperature aging degradation is required for use in dental implants.
A Ce-TZP-based nanostructured zirconia–alumina composite (NanoZr) composed of 10 mol% cerium dioxide (CeO2)-stabilized TZP as a matrix and 30 vol% of Al2O3 as a second phase was developed by Nawa et al.21,22 Due to its unique intergranular type of nanostructure, in which several 10–100 nm Al2O3 particles are trapped within the ZrO2 grains and several 10 nm ZrO2 particles are trapped within the Al2O3 grains, the flexural strength and fracture toughness of NanoZr are 1,500 MPa and 18 MPa·m½, respectively.16 It shows complete resistance to low-temperature aging degradation in comparison with Y-TZP.11,16 Additionally, the cyclic fatigue strength of NanoZr is twice that of 3Y-TZP.23 Our previous study showed that NanoZr has cell attachment comparable to that of 3Y-TZP in vitro.24 Therefore, NanoZr may be preferable for use in metal-free dental implants, because of its excellent mechanical properties. However, the effect of the unique intergranular-type nanostructure of NanoZr on osseointegration is unknown. Therefore, the purpose of this study was to evaluate the biomechanical and histological behavior of ceria-stabilized NanoZr in comparison with that of 3Y-TZP in vivo.
Materials and methods
Preparation of 3Y-TZP and NanoZr implant samples
Machined cylindrical implant specimens of NanoZr and 3Y-TZP (1 mm in diameter and 2 mm in length) were prepared by Panasonic Healthcare Co Ltd, Tokyo, Japan. The implants were cleaned by sonication in absolute acetone for 20 min, followed by ethanol and deionized water for 10 min; they were sterilized by autoclaving at 121°C for 30 min before insertion into the femurs of rats.
Surface-characterization analyses
Specimens for scanning electron microscopy (SEM) examination were gold-coated using auto-fine coaters (JFC-1600; JEOL, Tokyo, Japan) and observed with SEM (Quanta 200 FEG; Thermo Fisher Scientific, Waltham, MA, USA). Surface-morphology images were obtained at an accelerating voltage of 15 kV and 60× magnification. The grain structures of polished implant samples were analyzed with the backscattered electrons. Three separate specimens were examined per group. Additionally, the three-dimensional (3-D) surface topography of the samples was measured using a MicroXAM 3-D optical interferometer (KLA-Tencor Corporation, Milpitas, CA, USA), with a scanning area of 0.18×0.14 mm2. Nine randomly selected positions on the surfaces of the three samples were measured, and surface-roughness values (Sa) were calculated.
Surgical procedure
The surgical procedure and biomechanical (push-in) test were performed according to the method of Ogawa et al.25 Sprague Dawley rats (8 weeks old) were anesthetized by peritoneal injection of pentobarbital sodium (30 mg/kg body weight). NanoZr and 3Y-TZP implants were placed into the left and right femurs, respectively. The study protocol was approved by the Tohoku University of Japan Animal Research Committee. All experiments were performed in accordance with the Japan Department of Agriculture Guidelines for Animal Research.
The hair in the surgical area was removed by shaving, and the exposed area was disinfected by swabbing with 3% (volume fraction) povidone–iodine followed by 75% ethanol. Incised skin, subcutaneous tissue, muscles, and periosteum were exposed layer by layer. The implant site was prepared at ~7 mm from the distal femur edge using a slow-speed drill with a 1-mm round burr under continuous irrigation with sterile saline (0.9% [mass fraction]). The implant was then placed into the hole and carefully pushed into place until the end of the implant was aligned with the femoral bone surface. Finally, the tissues were sutured in layers.
After healing periods of 2, 4, and 8 weeks, ten Sprague Dawley rats per healing period were killed, and femurs with implant specimens were harvested. Five samples per healing period were subjected to biomechanical and histological evaluation.
Biomechanical evaluation (push-in test)
Five samples per healing period were harvested immediately after animal death and embedded into autopolymerizing resin (Unifast II; GC Corporation, Tokyo, Japan). The implants were then loaded axially in a universal testing machine (model 5565; Instron, Norwood, MA, USA) using a 2,000 N load cell and a 0.8-mm diameter stainless-steel pushing rod with a crosshead speed of 1 mm/min. The push-in test value was determined as the breaking-point load, which was defined as the maximum load prior to a rapid decrease in the load–displacement curve.
Histological processing
Five implant samples with surrounding bone were harvested during each healing period and fixed in 10% buffered formalin for 1 week. Subsequently, the specimens were dehydrated in an ascending series of alcohol concentrations (50%–99%) and finally embedded in autopolymerizing methyl methacrylate resin (Wako Pure Chemical Industries Ltd, Osaka, Japan). The undecalcified specimens (500 μm thickness) were cut using a diamond saw (SP 1600; Leica Microsystems, Wetzlar, Germany), adhered to the resin slides, and successively ground to a thickness of ~50 μm. The ground specimens were stained with tartrate-resistant acid phosphatase, and the BIC values of the cortical area and bone marrow area and number of osteoclasts were evaluated by light microscopy. The remaining specimens were sectioned to 10 μm thickness using an automated microtome (Leica RM2255) and then stained with Giemsa.
Histological evaluation
Histological evaluation and computer-assisted histomorphometric analysis were performed at 25× magnification. The length and area of new bone around implants and the total length of implant in the bone marrow were measured using image-measurement software, and BIC values and total new-bone area were determined (Figure 1). Finally, the thickness of newly formed bone within the marrow area was calculated according to the total bone area and total BIC length. The number of osteoclasts around the implants was determined.
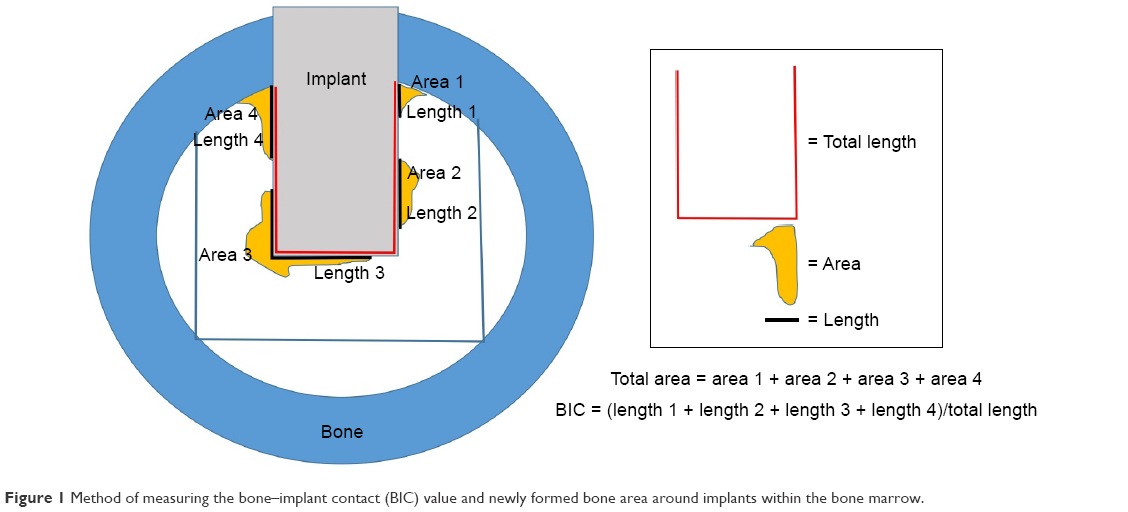 | Figure 1 Method of measuring the bone–implant contact (BIC) value and newly formed bone area around implants within the bone marrow. |
Statistical analysis
Push-in test values, BIC values, and thicknesses of newly formed bone around implants were compared by one-way analysis of variance using a 5% level of significance.
Results
Surface characterization
SEM images of the 3Y-TZP and NanoZr implants are shown in Figure 2. NanoZr is composed of 10 mol% cerium dioxide (CeO2)-stabilized TZP (white grains) as a matrix and 30 vol% of Al2O3 (black grains) as a second phase. The significant characteristic of the NanoZr structure is its intergranular type of nanostructure, in which several 10–100 nm Al2O3 particles are trapped within the ZrO2 grains and several 10 nm ZrO2 particles are trapped within the Al2O3 grains (arrows). The machined trace was observed in both types of implant. In terms of the 3-D surface topography of the samples (Figure 3), the heights between the tallest peak and the deepest valley for NanoZr and 3Y-TZP were 0.97 and 1.06 μm, respectively. The average surface roughness (Sa) of 3Y-TZP (0.788 μm) was significantly greater than that of NanoZr (0.559 μm) (Figure 4).
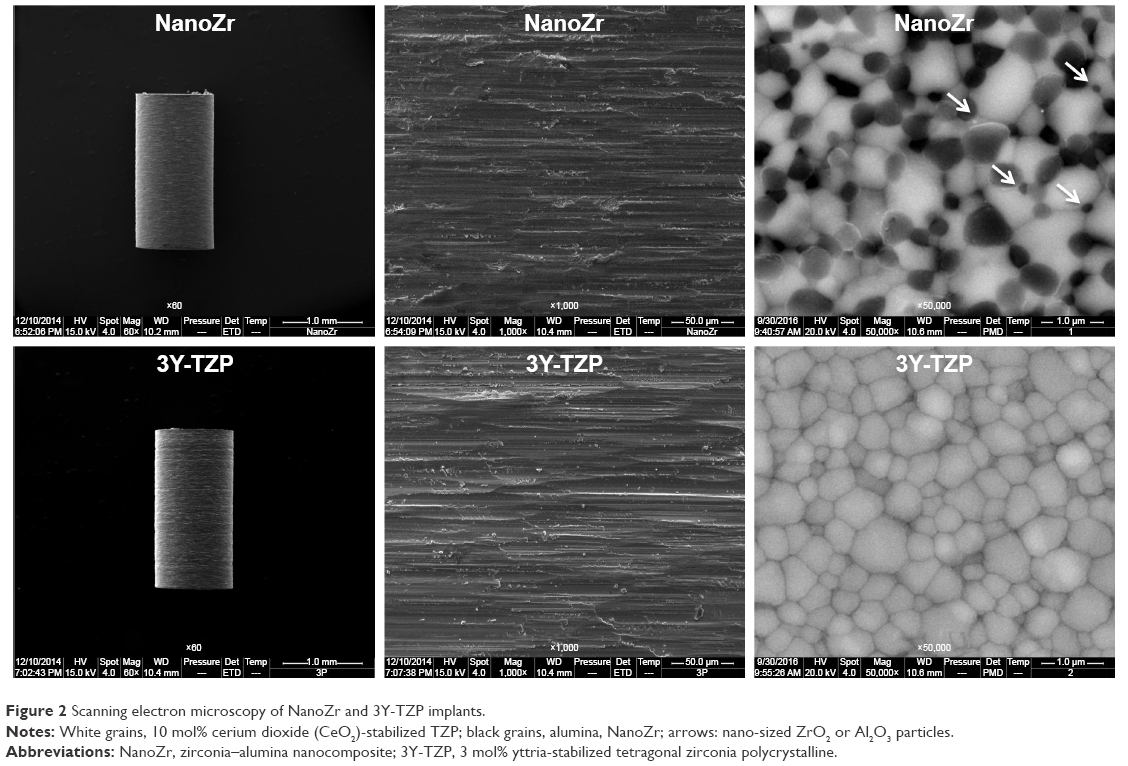 | Figure 2 Scanning electron microscopy of NanoZr and 3Y-TZP implants. |
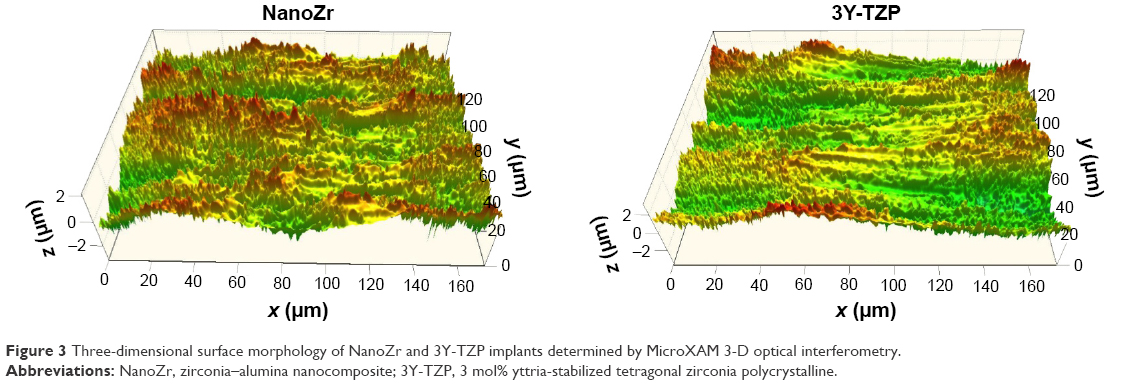 | Figure 3 Three-dimensional surface morphology of NanoZr and 3Y-TZP implants determined by MicroXAM 3-D optical interferometry. |
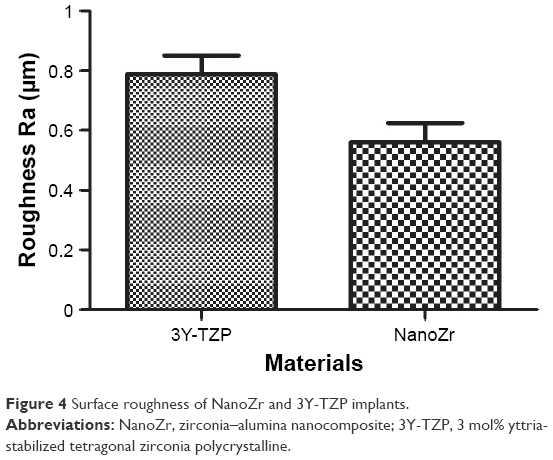 | Figure 4 Surface roughness of NanoZr and 3Y-TZP implants. |
Biomechanical evaluation (push-in test)
The shear strengths of NanoZr and 3Y-TZP are shown in Figure 5. The shear strengths of 3Y-TZP and NanoZr were similar at 2 weeks; however, the shear strength of NanoZr was higher than that of 3Y-TZP at 4 and 8 weeks, and the difference at 8 weeks was significant. For both materials, the push-in strength increased continuously during the observation period (2–8 weeks). However, the push-in strength increased significantly from 2 to 4 weeks for the same material, whereas there was no significant difference between 4 and 8 weeks.
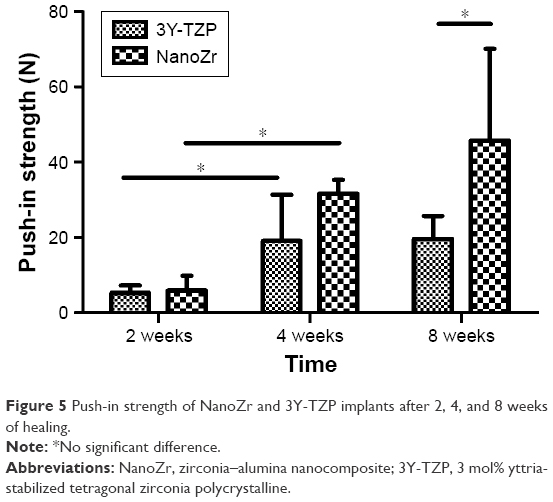 | Figure 5 Push-in strength of NanoZr and 3Y-TZP implants after 2, 4, and 8 weeks of healing. |
Histopathological evaluation
New-bone formation and direct BIC were evident at the surfaces of all implants. Bone growth was observed from the cortical bone toward the bone marrow along the implant surface in all samples (Figure 6). The BIC values of 3Y-TZP and NanoZr within the bone marrow area and cortical area are shown in Figures 7 and 8, respectively. The average BIC values within the bone marrow area for 3Y-TZP and NanoZr were 25.26% and 31.51% at 2 weeks, 46.78% and 38% at 4 weeks, and 47.88% and 56.81% at 8 weeks, respectively. The average BIC values within the cortical area were 38.86% and 58.42% at 2 weeks, 66.82% and 57.74% at 4 weeks, and 79.91% and 78.97% at 8 weeks, respectively. The BIC value within the cortical area was higher than that in the bone marrow area. The BIC within the bone marrow area stabilized after 4 weeks of healing, whereas that in the cortical area increased continuously during the experimental period. However, the mean BIC value did not differ significantly between the two zirconia materials at any time point, although the BIC of NanoZr was slightly higher than that of 3Y-TZP at 2 and 8 weeks.
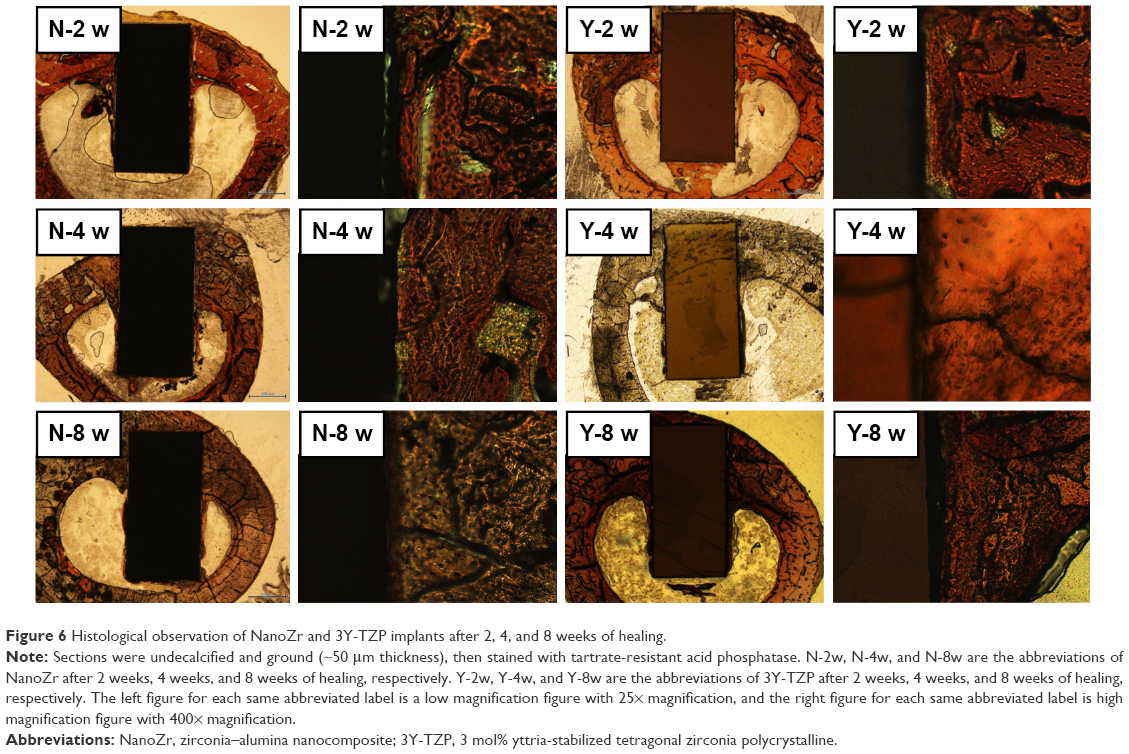 | Figure 6 Histological observation of NanoZr and 3Y-TZP implants after 2, 4, and 8 weeks of healing. |
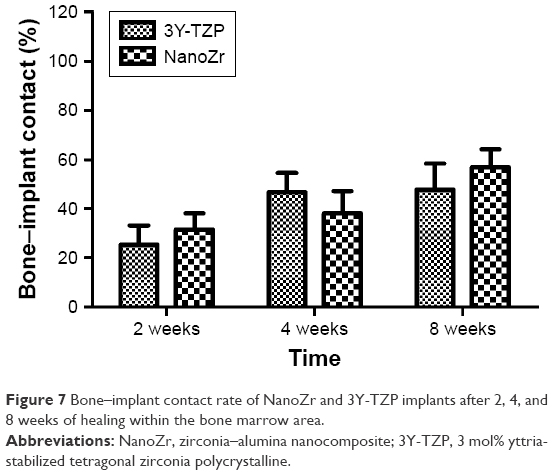 | Figure 7 Bone–implant contact rate of NanoZr and 3Y-TZP implants after 2, 4, and 8 weeks of healing within the bone marrow area. |
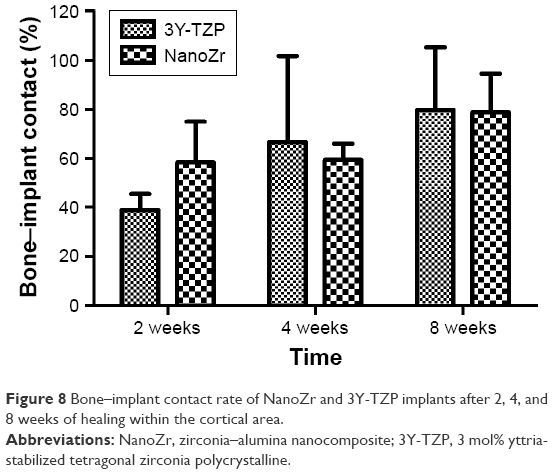 | Figure 8 Bone–implant contact rate of NanoZr and 3Y-TZP implants after 2, 4, and 8 weeks of healing within the cortical area. |
The average thicknesses of newly formed bone on the implant surface within the bone marrow area for 3Y-TZP and NanoZr were 32 and 33.1 μm at 2 weeks, 43.9 and 41.9 μm at 4 weeks, and 39.7 and 46.6 μm at 8 weeks, respectively (Figure 9). There was no significant difference among the groups.
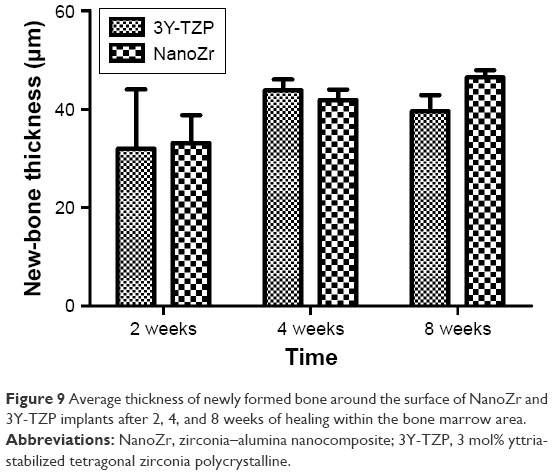 | Figure 9 Average thickness of newly formed bone around the surface of NanoZr and 3Y-TZP implants after 2, 4, and 8 weeks of healing within the bone marrow area. |
In the undecalcified ground sections (50 μm), bone appeared to form direct contact with the implant. However, in the thin sections (10 μm), bone did not always come into direct contact with the zirconia implant, and an amorphous or connective tissue zone with or without mineralized matrix was interposed between the implant and highly mineralized mature bone or newly formed lamellar bone. In the interposed connective tissue zone, newly formed blood vessels (Figure 10A), vasculature (Figure 10A), mineralized matrix, and multinuclear giant cells were evident (Figure 10A and B). Osteoblast-like cells were present in the amorphous zone and newly formed bone surface, and these were in direct contact with and parallel to the surface of the implant and newly formed bone (Figure 10C).
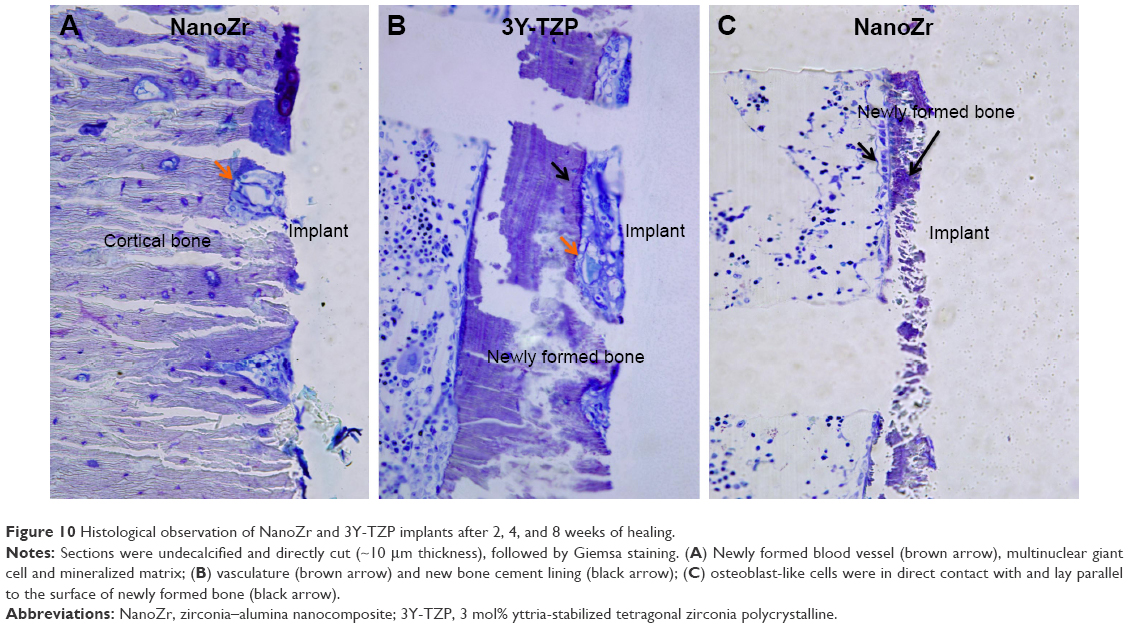 | Figure 10 Histological observation of NanoZr and 3Y-TZP implants after 2, 4, and 8 weeks of healing. |
Osteoclasts were present near the surface of implants composed of both materials after 2 weeks of healing (Figure 11). Osteoclasts were present after 4 weeks of healing only in the 3Y-TZP specimens. No osteoclasts were present at 8 weeks, irrespective of the zirconia material.
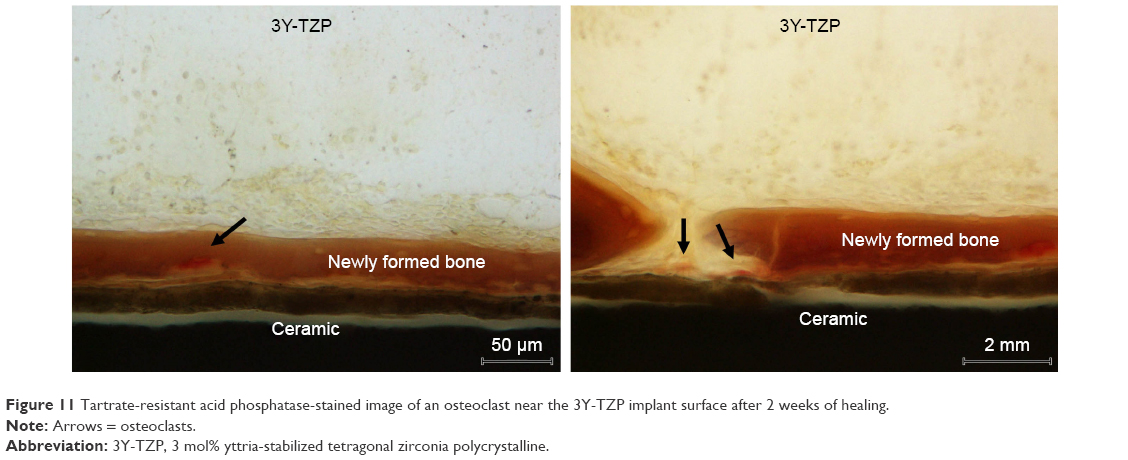 | Figure 11 Tartrate-resistant acid phosphatase-stained image of an osteoclast near the 3Y-TZP implant surface after 2 weeks of healing. |
Discussion
Dental implants composed of 3Y-TZP have been the subject of a greater number of in vivo studies than titanium dental implants. Animal studies have shown that 3Y-TZP and pure titanium have similar BIC values, bone densities near the implant, and mechanical parameters (removal torque or push-in strength).26–31 Moreover, the two materials have similar osseointegration abilities. This study aimed to evaluate the osseointegration ability of machined ceria-stabilized NanoZr compared with machined 3Y-TZP in vivo.
Bone growth on the implant surface is considered a prerequisite for the long-term success of implant-supported prostheses.32 The osseointegration rate of dental implants is related to their composition, surface morphology, and surface roughness. The majority of investigations have used 3Y-TZP implants with a sandblasted and/or acid-etched surface, but few have evaluated the osseointegration of machined zirconia or alumina-toughened zirconia (ATZ) implants. Kohal et al26 evaluated machined 3Y-TZP and machined titanium in the same animal model. The BIC values of 3Y-TZP and machined titanium were 30.9% and 23.2% at 2 weeks and 46.6% and 39.4% at 4 weeks, respectively (fraction of the implant in contact with the mineralized bone tissue over the entire length of the implant). Kohal et al27 reported that the BIC values of ATZ and electrochemically anodized titanium (TiUnite) were 24% and 58% at 2 weeks and 41% and 75% at 4 weeks, respectively (fraction of the implant in contact with the cortical bone). This is similar to our findings for 3Y-TZP. However, the BIC of NanoZr within the cortical bone area was higher than that of ATZ, possibly due to the different materials and surface treatments used.
The composition, surface morphology, and surface roughness of implants affect the rate of osseointegration and biomechanical fixation.33 In this study, the push-in strength of NanoZr was significantly higher than that of 3Y-TZP at 8 weeks, the microroughness of NanoZr was lower than that of 3Y-TZP, and the two materials had similar BIC values. The material composition and surface micro/nanostructure may account for this phenomenon. NanoZr consists of alumina and ceria-stabilized zirconia, whereas 3Y-TZP consists of yttria-stabilized zirconia. However, as animal studies have reported similar BIC values for alumina and zirconia,34,35 the different compositions of the two zirconia materials may not explain the discrepant results. Therefore, the difference in push-in strength of the two materials may be caused by the microstructure difference of NanoZr and 3Y-TZP.
Implants with a rough surface favor bone anchoring and biomechanical stability; therefore, they have higher BIC and RQ or push-in strength values than smooth-surface implants.26,36–38 However, despite the fact that the materials were prepared using the same machining method, the surface roughness of NanoZr was lower than that of 3Y-TZP, possibly due to the different mechanical properties of the materials. With regard to micromorphology, NanoZr and 3Y-TZP exhibited similar machined traces, probably due to the unique intergranular-type nanostructure of NanoZr. Several 10–100 nm Al2O3 particles are trapped within the ZrO2 grains, and several 10 nm ZrO2 particles are trapped within the Al2O3 grains.16 Webster et al39,40 and Wang et al41 reported that nanosize grains enhance protein interactions, as well as osteoblast adhesion and proliferation. Moreover, microsurfaces with nanoscale topography have enhanced biological activity.42 The effect of the nanostructure of NanoZr on integration should thus be investigated further. However, there is a lack of significant tissue evidence for the push-in test result of NanoZr at 8 weeks, which was significantly higher than that of 3Y-TZP. This may have been due to the small sample size in this study. Further research is required to verify these results.
The majority of animal studies have reported that BIC values stabilize 4–8 weeks after implant insertion. Gahlert et al28 investigated the BIC and bone density of 3Y-TZP implants after 4, 8, and 12 weeks of healing using a minipig model. ZrO2 implants exhibited mean peri-implant bone-density values of 60.4% at 4 weeks, 65.4% at 8 weeks, and 63.3% at 12 weeks after implantation. The corresponding mean BIC values of ZrO2 were 70%, 67.1%, and 68.3%, respectively. In a study conducted by Gahlert et al14 using the same animal model, the BIC at 8 weeks was higher than that at 4 weeks, and it did not increase significantly after 8 weeks. No significant difference between the two types of implant was detected at any time point with regard to the two parameters investigated. The shear strength between the implant and bone stabilized after 4 weeks of healing.
Albrektsson et al43 and Steflik et al44 reported that osteoblasts were present close to the surface of titanium implants, and their cytoplasmic processes extended perpendicularly onto the titanium surface. Murai et al45 also reported that osteoblasts were in direct contact with the titanium surface via a thin amorphous zone formed on slender osteoblast-like cells. In this study, the osteoblasts formed close and perpendicular contact with the zirconia-implant surface, and their reactivity to the zirconia implant was similar to that to the titanium implant. To our knowledge, this is the first direct evidence of zirconia osseointegration in vivo.
Osteoclasts may play an important role in the initial period after implant placement to prime or prepare the implant surface for the bone-forming activity of osteoblasts, as is the case during the normal bone-remodeling cycle.46 However, few in vivo studies have assessed osteoclasts in metal-free implant dentistry. Sennerby et al47 and Roberts et al48 reported that new bone was remodeled and replaced by lamellar bone 6 weeks to 3 months after titanium-implant insertion. In this study, osteoclasts were observed by 2 weeks after insertion with both materials, and the number of osteoclasts decreased over time. Osteoclasts were observed at 4 weeks with 3Y-TZP, but they were not observed with NanoZr at any time point. Within the limitations of this study, it can be concluded that NanoZr implants are biocompatible and capable of establishing close BIC; therefore, they may be preferable for metal-free dental implants.
Acknowledgments
This research was supported by the National Natural Science Foundation of China (81400560) and the National Key Research and Development Program of China (2016YFB1101204). The test implants were kindly provided by Panasonic Healthcare Co Ltd, Tokyo, Japan.
Disclosure
The authors report no conflicts of interest in this work.
References
Andreiotelli M, Wenz HJ, Kohal RJ. Are ceramic implants a viable alternative to titanium implants? A systematic literature review. Clin Oral Implants Res. 2009;20 Suppl 4:32–47. | ||
Hobkirk JA, Wiskott HW. Ceramics in implant dentistry (working group 1). Clin Oral Implants Res. 2009;20 Suppl 4:55–57. | ||
Jung RE, Sailer I, Hämmerle CH, Attin T, Schmidlin P. In vitro color changes of soft tissues caused by restorative materials. Int J Periodontics Restorative Dent. 2007;27(3):251–257. | ||
Park SE, Da Silva JD, Weber HP, Ishikawa-Nagai S. Optical phenomenon of peri-implant soft tissue – part I: spectrophotometric assessment of natural tooth gingiva and peri-implant mucosa. Clin Oral Implants Res. 2007;18(5):569–574. | ||
Fürhauser R, Florescu D, Benesch T, Haas R, Mailath G, Watzek G. Evaluation of soft tissue around single-tooth implant crowns: the pink esthetic score. Clin Oral Implants Res. 2005;16(6):639–644. | ||
Müller K, Valentine-Thon E. Hypersensitivity to titanium: clinical and laboratory evidence. Neuro Endocrinol Lett. 2006;27 Suppl 1:31–35. | ||
Merritt K, Rodrigo JJ. Immune response to synthetic materials: sensitization of patients receiving orthopaedic implants. Clin Orthop Relat Res. 1996;(326):71–79. | ||
Sicilia A, Cuesta S, Coma G, et al. Titanium allergy in dental implant patients: a clinical study on 1,500 consecutive patients. Clin Oral Implants Res. 2008;19(8):823–835. | ||
Egusa H, Ko N, Shimazu T, Yatani H. Suspected association of an allergic reaction with titanium dental implants: a clinical report. J Prosthet Dent. 2008;100(5):344–347. | ||
Carinci F, Pezzetti F, Volinia S, et al. Zirconium oxide: analysis of MG63 osteoblast-like cell response by means of a microarray technology. Biomaterials. 2004;25(2):215–218. | ||
Tanaka K, Tamura J, Kawanabe K, et al. Ce-TZP/Al2O3 nanocomposite as a bearing materials in total joint replacement. J Biomed Mater Res. 2002;63(3):262–270. | ||
Yamashita D, Machigashira M, Miyamoto M, et al. Effect of surface roughness on initial responses of osteoblast-like cells on two types of zirconia. Dent Mater J. 2009;28(4):461–470. | ||
Ito H, Sasaki H, Saito K, Honma S, Yajima Y, Yoshinari M. Response of osteoblast-like cells to zirconia with different surface topography. Dent Mater J. 2013;32(1):122–129. | ||
Gahlert M, Röhling S, Wieland M, Sprecher CM, Kniha H, Milz S. Osseointegration of zirconia and titanium dental implants: a histological and histomorphometrical study in the maxilla of pigs. Clin Oral Implants Res. 2009;20(11):1247–1253. | ||
Sennerby L, Dasmah A, Larsson B, Iverhed M. Bone tissue responses to surface-modified zirconia implants: a histomorphometric and removal torque study in the rabbit. Clin Implant Dent Relat Res. 2005;7(Suppl 1):S13–S20. | ||
Ban S. Reliability and properties of core materials for all-ceramic dental restorations. Jpn Dent Sci Rev. 2008;44(1):3–21. | ||
Andreiotelli M, Kohal RJ. Fracture strength of zirconia implants after artificial aging. Clin Implant Dent Relat Res. 2009;11(2):158–166. | ||
Gahlert M, Burtscher D, Grunert I, Kniha H, Steinhauser E. Failure analysis of fractured dental zirconia implants. Clin Oral Implants Res. 2012;23(3):287–293. | ||
Osman RB, Swain MV, Atieh M, Ma S, Duncan W. Ceramic implants (Y-TZP): Are they a viable alternative to titanium implants for the support of overdentures? A randomized clinical trial. Clin Oral Implants Res. 2014;25(12):1366–1377. | ||
Green NT, Machtei EE, Horwitz J, Peled M. Fracture of dental implants: literature review and report of a case. Implant Dent. 2002;11(2):137–143. | ||
Nawa M, Nakamoto S, Sekino T, Niihara K. Tough and strong Ce-TZP/alumina nanocomposites doped with titania. Ceram Int. 1998;24(7):497–506. | ||
Nawa M, Bamba N, Sekino T, Niihara K. The effect of TiO2 addition on strengthening and toughening in intragranular type of 12Ce-TZP/Al2O3 nanocomposites. J Eur Ceram Soc. 1998;18(3):209–219. | ||
Takano T, Tasaka A, Yoshinari M, Sakurai K. Fatigue strength of Ce-TZP/Al2O3 nanocomposite with different surfaces. J Dent Res. 2012;91(8):800–804. | ||
Han JM, Hong G, Matsui H, et al. The surface characterization and bioactivity of NanoZr in vitro. Dent Mater J. 2014;33(2):210–219. | ||
Ogawa T, Ozawa S, Shih JH, et al. Biomechanical evaluation of osseous implants having different surface topographies in rats. J Dent Res. 2000;79(11):1857–1863. | ||
Kohal RJ, Wolkewitz M, Hinze M, Han JS, Bächle M, Butz F. Biomechanical and histological behavior of zirconia implants: an experiment in the rat. Clin Oral Implants Res. 2009;20(4):333–339. | ||
Kohal RJ, Bächle M, Renz A, Butz F. Evaluation of alumina toughened zirconia implants with a sintered, moderately rough surface: an experiment in the rat. Dent Mater. 2016;32(1):65–72. | ||
Gahlert M, Roehling S, Sprecher CM, Kniha H, Milz S, Bormann K. In vivo performance of zirconia and titanium implants: a histomorphometric study in mini pig maxillae. Clin Oral Implants Res. 2012;23(3):281–286. | ||
Schliephake H, Hefti T, Schlottig F, Gédet P, Staedt H. Mechanical anchorage and peri-implant bone formation of surface-modified zirconia in minipigs. J Clin Periodontol. 2009;37(9):818–828. | ||
Koch FP, Weng D, Krämer S, Biesterfeld S, Jahn-Eimermacher A, Wagner W. Osseointegration of one-piece zirconia implants compared with a titanium implant of identical design: a histomorphometric study in the dog. Clin Oral Implants Res. 2010;21(3):350–356. | ||
Akagawa Y, Hosokawa R, Sato Y, Kamayama K. Comparison between freestanding and tooth-connected partially stabilized zirconia implants after two years’ function in monkeys: a clinical and histologic study. J Prosthet Dent. 1998;80(5):551–558. | ||
Zhang HY, Han JM, Sun YL, Huang YL, Zhou M. MC3T3-E1 cell response to stainless steel 316L with different surface treatments. Mater Sci Eng C Mater Biol Appl. 2015;56:22–29. | ||
Junker R, Dimakis A, Thoneick M, Jansen JA. Effects of implant surface coatings and composition on bone integration: a systematic review. Clin Oral Implants Res. 2009;20 Suppl 4:185–206. | ||
Chang YS, Oka M, Nakamura T, Gu HO. Bone remodeling around implanted ceramics. J Biomed Mater Res. 1996;30(1):117–124. | ||
Dubruille JH, Viguier E, Le Naour G, Dubruille MT, Auriol M, Le Charpentier Y. Evaluation of combinations of titanium, zirconia, and alumina implants with 2 bone fillers in the dog. Int J Oral Maxillofac Implants. 1999;14(2):271–277. | ||
Sennerby L, Dasmah A, Larsson B, Iverhed M. Bone tissue responses to surface-modified zirconia implants: a histomorphometric and removal torque study in the rabbit. Clin Implant Dent Relat Res. 2005;7 Suppl 1:S13–S20. | ||
Park YS, Chung SH, Shon WJ. Peri-implant bone formation and surface characteristics of rough surface zirconia implants manufactured by powder injection molding technique in rabbit tibiae. Oral Implants Res. 2013;24(5):586–591. | ||
Gahlert M, Gudehus T, Eichhorn S, Steinhauser S, Kniha H, Erhardt W. Biomechanical and histomorphometric comparison between zirconia implants with varying surface textures and a titanium implant in the maxilla of miniature pigs. Clin Oral Impl Res. 2007;18(5):662–668. | ||
Webster TJ, Siegel RW, Bizios R. Osteoblast adhesion on nanophase ceramics. Biomaterials. 1999;20(13):1222–1227. | ||
Webster TJ, Ergun C, Doremus RH, Siegel RW, Bizios R. Enhanced functions of osteoblasts on nanophase ceramics. Biomaterials. 2000;21(17):1803–1810. | ||
Wang G, Liu X, Zreiqat H, Ding C. Enhanced effects of nanoscale topography on the bioactivity and osteoblast behaviors of micron rough ZrO2 coatings. Colloids Surf B Biointerfaces. 2011;86(2):267–274. | ||
Ito H, Sasaki H, Saito K, Honma S, Yajima Y, Yoshinari M. Response of osteoblast-like cells to zirconia with different surface topography. Dent Mater J. 2013;32(1):122–129. | ||
Albrektsson T, Hansson HA, Kasemo B, et al. The interface zone of inorganic implants in vivo: titanium implants in bone. Ann Biomed Eng. 1983;11(1):1–27. | ||
Steflik DE, Sisk AL, Parr GR, et al. Osteogenesis at the dental implant interface: high-voltage electron microscopic and conventional transmission electron microscopic observations. J Biomed Mater Res. 1993; 27(6):791–800. | ||
Murai K, Takeshita F, Ayukawa Y, Kiyoshima T, Suetsugu T, Tanaka T. Light and electron microscopic studies of bone-titanium interface in the tibiae of young and mature rats. J Biomed Mater Res. 1996;30(4):523–533. | ||
Minkin C, Marinho VC. Role of the osteoclast at the bone-implant interface. Adv Dent Res. 1999;13(1):49–56. | ||
Sennerby L, Thomsen P, Ericson L. Early tissue response to titanium implants inserted in rabbit cortical bone: part I – light microscopic observations. J Mater Sci Mater Med. 1993;4(3):240–250. | ||
Roberts E, Smith R, Zilberman Y, Mozsary P, Smith RS. Osseous adaptation to continuous loading of rigid endosseous implants. Am J Orthod. 1984;86(2):95–111. |
 © 2016 The Author(s). This work is published and licensed by Dove Medical Press Limited. The
full terms of this license are available at https://www.dovepress.com/terms
and incorporate the Creative Commons Attribution
- Non Commercial (unported, 3.0) License.
By accessing the work you hereby accept the Terms. Non-commercial uses of the work are permitted
without any further permission from Dove Medical Press Limited, provided the work is properly
attributed. For permission for commercial use of this work, please see paragraphs 4.2 and 5 of our Terms.
© 2016 The Author(s). This work is published and licensed by Dove Medical Press Limited. The
full terms of this license are available at https://www.dovepress.com/terms
and incorporate the Creative Commons Attribution
- Non Commercial (unported, 3.0) License.
By accessing the work you hereby accept the Terms. Non-commercial uses of the work are permitted
without any further permission from Dove Medical Press Limited, provided the work is properly
attributed. For permission for commercial use of this work, please see paragraphs 4.2 and 5 of our Terms.