Back to Journals » Pharmacogenomics and Personalized Medicine » Volume 14
Bioinformatics Analysis of Neuroblastoma miRNA Based on GEO Data
Authors Shi J ![]() , Zhang P, Su H
, Zhang P, Su H ![]() , Cai L, Zhao L, Zhou H
, Cai L, Zhao L, Zhou H ![]()
Received 23 April 2021
Accepted for publication 22 June 2021
Published 13 July 2021 Volume 2021:14 Pages 849—858
DOI https://doi.org/10.2147/PGPM.S312171
Checked for plagiarism Yes
Review by Single anonymous peer review
Peer reviewer comments 2
Editor who approved publication: Dr Martin H Bluth
Jiandong Shi, Piaoyan Zhang, Huarong Su, Lingyi Cai, Liang Zhao, Haixia Zhou
Department of Hematology, the Second Affiliated Hospital and Yuying Children’s Hospital of Wenzhou Medical University, Wenzhou, Zhejiang, People’s Republic of China
Correspondence: Haixia Zhou
Department of Hematology, the Second Affiliated Hospital and Yuying Children’s Hospital of Wenzhou Medical University, Xueyuanxi Load No. 109, Wenzhou City, Zhejiang Province, People’s Republic of China
Email e-mail:[email protected]
Objective: To analyze the changes in downstream genes, signaling pathways, and proteins based on the difference of microRNA (miRNA) expression in neuroblastoma (NB).
Methods: GSE128004 second-generation sequencing expression data were downloaded from GEO, and Limma package of R language was used to analyze differential expression, and a volcano map and heat map were drawn; the target genes corresponding to the differential miRNA were found using the miWalk web tool, and GO (Gene Ontology) and KEGG (Kyoto Encyclopedia of Genes and Genomes) were performed. The key genes were identified and verified in the TCGA database.
Results: A total of 34 differentially expressed miRNAs were screened out. Among them, 22 up-regulated miRNAs predicted 1163 target genes and 12 down-regulated miRNAs predicted 1474 target genes. Target genes were enriched and analyzed by KEGG to find the FOXO signal pathway, mTOR signal pathway, AMPK signal pathway, and other signal pathways. After GO analysis, axon formation, regulation of chemical synaptic transmitters, regulation of nerve synapses, regulation of cross-synaptic signals, and other physiological processes were assessed. A total of 16 key genes were obtained by PPI analysis, and the survival analysis of TP53 and ATM genes verified in the TCGA database showed statistical significance.
Conclusion: The 34 differential miRNAs may be related to the occurrence and development of NB. TP53 and ATM are related to the prognosis of NB. The role and mechanism of TP53 and ATM in NB need to be further verified.
Keywords: neuroblastoma, miRNA, bioinformatics
Introduction
Neuroblastoma (NB) is the most common extracranial solid tumor in children. The incidence is about 25–50 cases per 100 million people. The median age of diagnosis is 18 months,1 and about 90% of tumors occur before the patient is 10 years old.2 The incidence in China is on the rise, with an average annual incidence of about 3000 cases.3 NB is a neuroendocrine tumor that occurs in the developing sympathetic nervous system, from any neural crest element, resulting in adrenal or sympathetic ganglion tumors or both. Although a few NBs may subside without treatment, most cases have no specific clinical manifestations, and metastasis has often already occurred by the time of diagnosis, leaving the patient with poor prognosis. Early diagnosis and treatment are very important. Although several advanced investigations that include next-generation sequencing of tumor cells and immunological assessments to define targets in the tumor microenvironment can contribute to the diagnosis and staging of NB, these detective methods are invasive, time-consuming and also difficult to repeat the procedure.4 More recently, there has been a growing number of publications focusing on the function of exosomes in body fluids as an early and non-invasive diagnostic biomarker in malignant tumors. For example, serum exosomal hsa-miR-18a, hsa-miR-221, hsa-miR-222, and hsa-miR-224 have been reported as novel biomarkers for hepatocellular carcinoma (HCC),5 and these serum exosomal miRNAs are better in distinguishing HCC from chronic hepatitis B or liver cirrhosis compared to the corresponding serum circulating miRNAs. However, there are currently few studies on miRNAs in neuroblastoma. In this study, we analyzed the second-generation sequencing data of patients with NB in the public database GEO to identify differentially expressed microRNAs (miRNAs) and their target genes in the pathogenesis of NB.
Materials and Methods
Data Collection
The original data of microRNA second-generation sequencing were collected from the GEO database (https://www.ncbi.nlm.nih.gov/gds). The ID number of the second-generation sequencing data is GSE128004, and the sequencing platform was GPL23227 BGISEQ-500 (Homo sapiens). The sequencing samples were collected from the peripheral blood of 15 children with NB and 3 healthy controls, including 15 NB samples (GSM3660254-GSM3660268) and 3 control samples (GSM3660269-GSM3660271).
Data Preprocessing and Differential Expression Analysis
After downloading the processed sequencing expression matrix, the Limma package6 was used to analyze the differences in miRNA expression between normal samples and NB samples, and a volcano map and heat map were drawn. Genes with incomplete annotation information, very low expression, and duplication were filtered out. The screening conditions for differential miRNAs were FDR < 0.05, logfc > | 2.5 |.
Target Gene Prediction of Differential miRNA
The target genes were predicted using the miWalk web tool, and the signal pathways of the identified genes were enriched and analyzed. The up-regulated and down-regulated genes were analyzed by KEGG and GO, respectively, using an R Language Clusterprofiler package.7
Construction of PPI Network
STRING (https://string-db.org/) is a database for predicting protein–protein interaction (PPI) networks, which can predict downstream protein interactions. For the target genes of the selected differential miRNAs, protein interaction was predicted using STRING, and the position of the protein in the regulatory network was predicted by observing the number of nodes. The target gene network was constructed using Cytoscape software.
Survival Curve
The target genes were verified in the TCGA database, and the survival curve was drawn.
Statistical Methods
The differential genes were screened using an R Language Limma package, and the screening criteria were up-regulated or down-regulated with a difference multiple > 2.5 and P < 0.05. GO and KEGG analyses showed P < 0.05 to be statistically significant.
Results
Analysis of Differentially Expressed Genes
A total of 34 differentially expressed miRNAs were screened by comparing the NB group and the control group, of which 2 were up-regulated and 12 were down-regulated in the NB group (Table 1). The volcano map (Figure 1) and heat map (Figure 2) were drawn with differential genes. The color depth represents the level of gene expression, and the heat map can directly reflect the expression of differential miRNAs.
 |
Table 1 Differentially Expressed miRNAs |
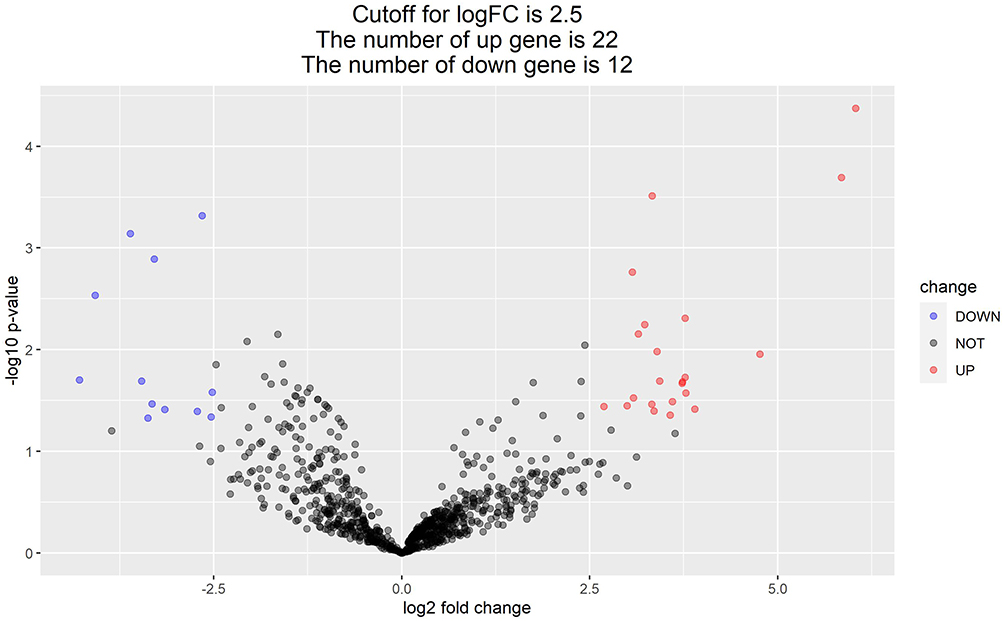 |
Figure 1 Volcano map of differential miRNA. |
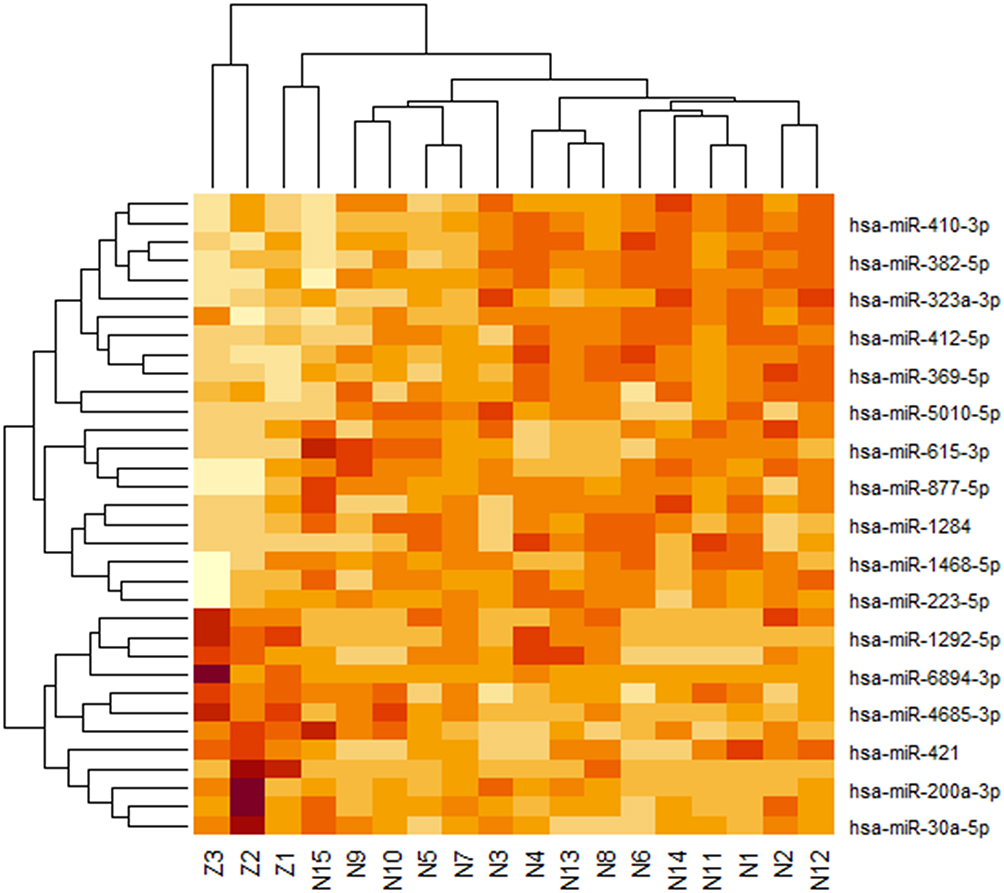 |
Figure 2 Heat map of 22 upregulated miRNAs and 12 down-regulated miRNAs. |
Prediction of Target Genes with Differentially Expressed miRNAs
Using the miWalk web tool, we predicted the target genes of 34 differentially selected miRNAs, including 1163 target genes predicted by 22 up-regulated miRNAs and 1474 target genes predicted by 12 down-regulated miRNAs.(See Supplementary Materials 1 and 2 for details).
KEGG Enrichment Analysis of Target Genes
The clustering profiler package of R language was used to analyze 1163 up-regulated target genes. The FOXO signaling pathway, mTOR signaling pathway, AMPK signaling pathway, and other pathways were observed in the results (Figure 3); a total of 1474 down-regulated target genes were analyzed by KEGG enrichment, and the results showed the relaxin signaling pathway, EGFR tyrosine kinase inhibitor resistance, and other pathways (Figure 4).
 |
Figure 3 KEGG enrichment results of up-regulated target genes. |
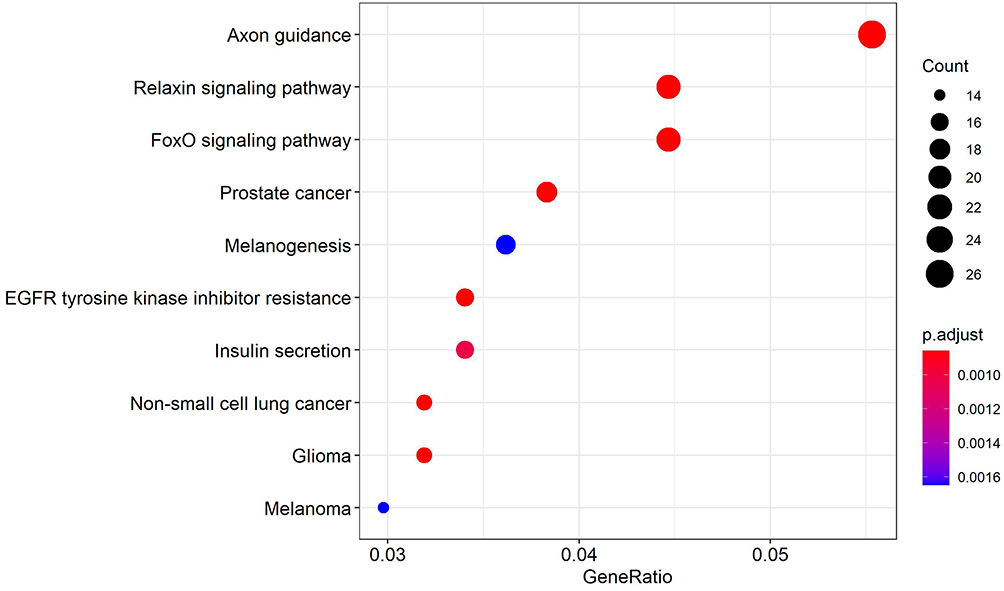 |
Figure 4 KEGG enrichment results of down-regulated target genes. |
GO Enrichment Analysis of Target Genes
The cluster profiler package of R language was used for GO enrichment analysis of 1163 up-regulated target genes, and the results showed the physiological processes, such as axon formation, regulation of chemical synaptic transmitters, and activation of protein kinase activity, to be involved (Figure 5). The GO enrichment analysis of 1474 down-regulated target genes was performed, and the results showed such physiological processes as the regulation of synapses and the regulation of trans synaptic signals to be involved (Figure 6).
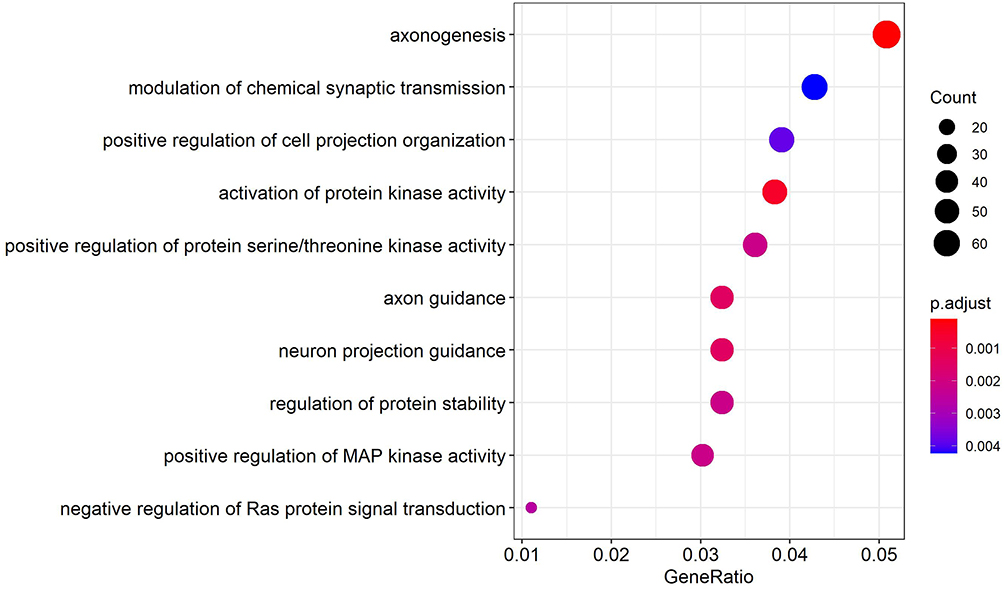 |
Figure 5 GO enrichment results of up-regulated target genes. |
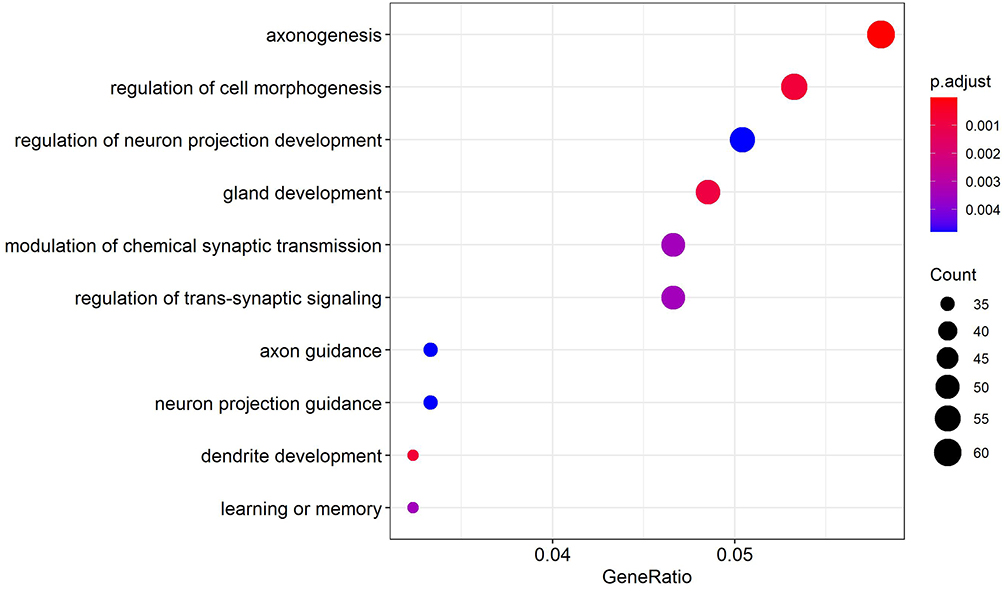 |
Figure 6 GO enrichment results of down-regulated target genes. |
Construction of PPI Network
The target genes predicted by differential miRNAs were introduced into the STRING database, and the results were input to the Cyberscape software to construct the target gene network map. The top 16 genes were selected as the key genes (Figure 7).
 |
Figure 7 16 key genes. |
Survival Curve
According to the data of NB in the TCGA plan, the key genes mentioned above were divided into a high-expression group and a low-expression group, and a survival curve was drawn. The results showed the survival curve of high- and low-expression groups of TP53 and ATM genes to be statistically significant (P < 0.05) (Figures 8 and 9).
 |
Figure 8 ATM gene survival curve. |
 |
Figure 9 TP53 survival curve. |
Discussion
NB is an embryonic tumor originating from neural crest stem cells, which can occur in the paravertebral sympathetic ganglion of adrenal medulla or neck, chest, abdomen, or pelvis. The most common clinical manifestations are painless abdominal masses.8 The diagnosis of NB should be combined with laboratory examination, radiological imaging, and pathology. The tumor would have often already metastasized by the time of diagnosis, and prognosis is often very poor. The high rate of metastasis, adverse prognosis, and unique clinical characteristics of advanced NB have inspired in-depth study of its biology and new methods of treatment.
miRNAs are small non-encoding RNA molecules about 22 nt in length. They are usually regulated by binding with their complementary mRNA.9 miRNAs participate in various aspects of the pathogenesis of NB, which strongly suggests that they have potential in the clinical management of NB. In this study, GSE128004 in the GEO database was analyzed using an R Language Limma package. The data from second-generation sequencing of the peripheral blood of 15 volunteers with NB and 3 healthy volunteers were obtained. A total of 34 miRNAs were obtained, including 22 up-regulated miRNAs and 12 down-regulated miRNAs. The target genes predicted by miRNAs were obtained by using the Miwok web tool, including 1163 up-regulated genes, 1474 down-regulated genes, and sub-genes. These genes were not enriched by KEGG or GO. Finally, 16 key genes were screened by PPI, including EGFR, TP53, KRAS, mapk1, AR, arb1, NEDD4L, asb11, Skp1, srsf1, HDAC1, ATM, PIK3CA, NR3C1, SRC, and snap25. TP53 is one of the most mutated genes in human malignant tumors, although it has a lower mutation rate in NB. Vid Mlakar et al10 showed that TP53 can induce the death of NB cells by regulating prima-1met through the glutathione level, and TP53 loses its antitumor function once it is inactivated.11,12 KRAS plays an important role in regulating cell proliferation, differentiation, and apoptosis. Domestic and international studies have shown that KRAS is highly expressed in NB;13,14 so, it can be used as the target of treatment. EGFR, PIK3CA, SRC, and other genes have been found to be highly expressed in NB,15–17 and this is consistent with this study. In addition, there are not many studies on AR, arb1, NEDD4L, and other genes, which can be used to direct future research.
The potential differences in miRNA levels in the peripheral blood of patients with NB and healthy volunteers were analyzed by bioinformatics. Out of the 34 miRNAs, 22 were up-regulated and 12 were down-regulated. The expression of Hsa Mir 490–5p and HSA mir-323a-3p in patients with NB was up-regulated, which was consistent with the findings reported by Zeka et al.18
KEGG analysis showed that the enrichment pathway of up-regulated genes mainly includes the FOXO signal pathway, mTOR signal pathway, AMPK signal pathway, and ErbB signal pathway. The enrichment pathway of down-regulated genes mainly includes tyrosine kinase inhibitor resistance, insulin secretion, and non-small cell lung cancer. FOXO signaling pathways control a variety of cell functions, such as cell death, metabolism, metastasis, and tumor angiogenesis. Stefan Saler et al19 confirmed that FoxO3 can promote angiogenesis and chemoresistance in vitro, and inhibition of FOXO signaling pathway can promote chemosensitivity in advanced NB,20 which may play an important role in the metastasis and treatment of NB in children. The mTOR signaling pathway is very important for cell growth, proliferation, and survival, and it is up-regulated in NB in children,21 which is consistent with this study. Some studies22 have shown that the ErbB signaling pathway plays an important role in various kinds of malignant tumors, including NB. Another study23 showed that signal transduction of ErbB receptor tyrosine kinase promotes NB in vitro and in vivo.
Through the analysis of GO enrichment, we found that the enrichment pathway of up-regulated genes mainly includes axon formation, chemical synaptic neurotransmitter modulation, and protein kinase activity. The enrichment pathway of down-regulated genes mainly includes cell morphology calibration, regulation of neuronal projection development, and gland development. During the differentiation of neural crest cells in the sympathetic adrenal system, any significant interruption or failure of regulatory function will lead to the transformation of neural crest cells into NB of the adrenal and sympathetic ganglia. This was mainly found to be related to the growth and development of neural cells in our GO analysis. Important processes included axogenesis, chemical synaptic neurotransmitter modulation, and regulation of neuronal projection development.
We also tested the key genes selected in the TCGA tumor database, and the results showed that the expression of TP53 and ATM genes is significant for survival. NB is the most common extracranial solid tumor in children. Its clinical manifestations are not specific. Metastasis has been found at the time of diagnosis, and prognosis is very poor. The 34 miRNAs and 16 key genes found by bioinformatics can play a role in the diagnosis of NB. These findings can provide some clues and ideas for molecular targeted treatment of NB and can predict the prognosis of the disease to a certain extent, but further experiments are still needed to verify these effects.
Acknowledgments
This work was supported by The Major Science and Technology Special Project of Wenzhou (No:ZY2020021). We thank LetPub for its linguistic assistance during the preparation of this manuscript. We also thank Dr Jianming Zeng (University of Macau), and all the members of his bioinformatics team, biotrainee, for generously sharing their experience and codes.
Disclosure
There are no potential or actual conflicts of interest to disclose.
References
1. Matthay K, Maris J, Schleiermacher G, et al. Neuroblastoma. Nat Rev Dis Primers. 2016;2:16078. doi:10.1038/nrdp.2016.78
2. Pottoo FH, Barkat MA, Harshita H, et al. Nanotechnological based miRNA intervention in the therapeutic management of neuroblastoma. Semin Cancer Biol. 2021;69:100–108. doi:10.1016/j.semcancer.2019.09.017
3. Yangting. Advances in the treatment of neuroblastoma. J China Pediatr Blood Cancer. 2015;6:20.
4. Pugh T, Morozova O, Attiyeh E, et al. The genetic landscape of high-risk neuroblastoma. Nat Genet. 2013;45(3):279–284. doi:10.1038/ng.2529
5. Sohn W, Kim J, Kang S, et al. Serum exosomal microRNAs as novel biomarkers for hepatocellular carcinoma. Exp Mol Med. 2015;47:e184. doi:10.1038/emm.2015.68
6. Ritchie M, Phipson B, Wu D, et al. limma powers differential expression analyses for RNA-sequencing and microarray studies. Nucleic Acids Res. 2015;43(7):e47.
7. Yu G, Wang L, Han Y, He Q-Y. clusterProfiler: an R package for comparing biological themes among gene clusters. Omics: a Journal of Integrative Biology. 2012;16(5):284–287. doi:10.1089/omi.2011.0118
8. Lu D, Chen X, Shu Q. Advances in molecular genetic characteristics of high-risk neuroblastoma. Chin Pediatr Surg. 2021;42(01):81–87.
9. Rupaimoole R, Slack F. MicroRNA therapeutics: towards a new era for the management of cancer and other diseases. Nat Rev Drug Discovery. 2017;16(3):203–222. doi:10.1038/nrd.2016.246
10. Mlakar V, Jurkovic mlakar S, Lesne L, et al. PRIMA-1(MET)-induced neuroblastoma cell death is modulated by p53 and mycn through glutathione level. J Exp Clin Cancer Res. 2019;38(1):69. doi:10.1186/s13046-019-1066-6
11. Veschi V, Thiele CJ. High-SETD8 inactivates p53 in neuroblastoma. Oncoscience. 2017;4(3–4):21–22. doi:10.18632/oncoscience.344
12. Oh L, Hafsi H, Hainaut P, Ariffin H. p53, stem cell biology and childhood blastomas. Curr Opin Oncol. 2019;31(2):84–91. doi:10.1097/CCO.0000000000000504
13. Lin A, Hua RX, Tang J, et al. KRAS rs7973450 A>G increases neuroblastoma risk in Chinese children: a four-center case-control study. Onco Targets Ther. 2019;12:7289–7295. doi:10.2147/OTT.S223220
14. Kiessling MK, Rogler G. Targeting the RAS pathway by mitogen-activated protein kinase inhibitors. Swiss Med Wkly. 2015;145:w14207. doi:10.4414/smw.2015.14207
15. Kostopoulou ON, Holzhauser S, Lange BKA, et al. Analyses of FGFR3 and PIK3CA mutations in neuroblastomas and the effects of the corresponding inhibitors on neuroblastoma cell lines. Int J Oncol. 2019;55(6):1372–1384. doi:10.3892/ijo.2019.4896
16. Izycka-Swieszewska E, Brzeskwiniewicz M, Wozniak A, et al. EGFR, PIK3CA and PTEN gene status and their protein product expression in neuroblastic tumours. Folia Neuropathologica. 2010;48(4):238–245.
17. Bieerkehazhi S, Chen Z, Zhao Y, et al. Novel Src/Abl tyrosine kinase inhibitor bosutinib suppresses neuroblastoma growth via inhibiting Src/Abl signaling. Oncotarget. 2017;8(1):1469–1480. doi:10.18632/oncotarget.13643
18. Zeka F, Decock A, Van Goethem A, et al. Circulating microRNA biomarkers for metastatic disease in neuroblastoma patients. JCI Insight. 2018;3:23. doi:10.1172/jci.insight.97021
19. Salcher S, Spoden G, Hagenbuchner J, et al. A drug library screen identifies Carbenoxolone as novel FOXO inhibitor that overcomes FOXO3-mediated chemoprotection in high-stage neuroblastoma. Oncogene. 2020;39(5):1080–1097. doi:10.1038/s41388-019-1044-7
20. Geiger K, Hagenbuchner J, Rupp M, et al. FOXO3/FKHRL1 is activated by 5-aza-2-deoxycytidine and induces silenced caspase-8 in neuroblastoma. Mol Biol Cell. 2012;23(11):2226–2234. doi:10.1091/mbc.e11-06-0535
21. Mei H, Wang Y, Lin Z, Tong Q. The mTOR signaling pathway in pediatric neuroblastoma. Pediatr Hematol Oncol. 2013;30(7):605–615. doi:10.3109/08880018.2013.798058
22. Mao X, Chen Z, Zhao Y, et al. Novel multi-targeted ErbB family inhibitor afatinib blocks EGF-induced signaling and induces apoptosis in neuroblastoma. Oncotarget. 2017;8(1):1555–1568. doi:10.18632/oncotarget.13657
23. Richards KN, Zweidler-McKay PA, Van Roy N, et al. Signaling of ERBB receptor tyrosine kinases promotes neuroblastoma growth in vitro and in vivo. Cancer. 2010;116(13):3233–3243. doi:10.1002/cncr.25073
 © 2021 The Author(s). This work is published and licensed by Dove Medical Press Limited. The
full terms of this license are available at https://www.dovepress.com/terms
and incorporate the Creative Commons Attribution
- Non Commercial (unported, 3.0) License.
By accessing the work you hereby accept the Terms. Non-commercial uses of the work are permitted
without any further permission from Dove Medical Press Limited, provided the work is properly
attributed. For permission for commercial use of this work, please see paragraphs 4.2 and 5 of our Terms.
© 2021 The Author(s). This work is published and licensed by Dove Medical Press Limited. The
full terms of this license are available at https://www.dovepress.com/terms
and incorporate the Creative Commons Attribution
- Non Commercial (unported, 3.0) License.
By accessing the work you hereby accept the Terms. Non-commercial uses of the work are permitted
without any further permission from Dove Medical Press Limited, provided the work is properly
attributed. For permission for commercial use of this work, please see paragraphs 4.2 and 5 of our Terms.