Back to Journals » Clinical Epidemiology » Volume 11
Benchmarking Danish hospitals on mortality and readmission rates after cardiovascular admission
Authors Ridgeway G ![]() , Nørgaard M
, Nørgaard M ![]() , Rasmussen TB, Finkle WD, Pedersen L, Bøtker HE
, Rasmussen TB, Finkle WD, Pedersen L, Bøtker HE ![]() , Sørensen HT
, Sørensen HT ![]()
Received 30 September 2018
Accepted for publication 26 November 2018
Published 4 January 2019 Volume 2019:11 Pages 67—80
DOI https://doi.org/10.2147/CLEP.S189263
Checked for plagiarism Yes
Review by Single anonymous peer review
Peer reviewer comments 2
Editor who approved publication: Professor Irene Petersen
Greg Ridgeway,1–3 Mette Nørgaard,4 Thomas Bøjer Rasmussen,4 William D Finkle,3 Lars Pedersen,4 Hans Erik Bøtker,5 Henrik Toft Sørensen4
1Department of Criminology, University of Pennsylvania, Philadelphia, PA, USA; 2Department of Statistics, University of Pennsylvania, Philadelphia, PA, USA; 3Consolidated Research, Inc., Los Angeles, CA, USA; 4Department of Clinical Epidemiology, Institute of Clinical Medicine, Aarhus University Hospital, Aarhus, Denmark; 5Department of Cardiology, Aarhus University Hospital, Aarhus, Denmark
Objective: The aim of this study was to examine hospital performance measures that account more comprehensively for unique mixes of patients’ characteristics.
Design: Nationwide cohort registry-based study within a population-based health care system.
Participants: In this study, 331,513 patients discharged with a primary cardiovascular diagnosis from 1 of 26 Danish hospitals during 2011–2015 were included. Data covering all Danish hospitals were drawn from the Danish National Patient Registry and the Danish National Health Service Prescription Database.
Main outcome measures: Thirty-day post-admission mortality rates, 30-day post-discharge readmission rates, and the associated numbers needed to harm were measured.
Methods: For each index hospital, we used a non-parametric logistic regression model to compute propensity scores. Propensity score weighted patients treated at other hospitals collectively resembled patients treated at the index hospital in terms of age, sex, primary discharge diagnosis, diagnosis history, medications, previous cardiac procedures, and comorbidities. Outcomes for the weighted patients treated at other hospitals formed benchmarks for the index hospital. Doubly robust regression formally tested whether the outcomes of patients at the index hospital differed from the outcomes of the patients used to form the benchmarks. For each index hospital, we computed the false discovery rate, ie, the probability of being incorrect if we claimed the hospital differed from its benchmark.
Results: Five hospitals exceeded their benchmark for 30-day mortality rates, with the number needed to harm ranging between 55 and 137. Seven hospitals exceeded their benchmark for readmission, with the number needed to harm ranging from 22 to 71. Our benchmarking approach flagged fewer hospitals as outliers compared with conventional regression methods.
Conclusion: Conventional methods flag more hospitals as outliers than our benchmarking approach. Our benchmarking approach accounts more thoroughly for differences in hospitals’ patient case mix, reducing the risk of false-positive selection of suspected outliers. A more comprehensive system of hospital performance measurement could be based on this approach.
Keywords: performance measurement, propensity score, doubly robust estimation, case mix adjustment, cohort study
Introduction
Measures of hospitals’ quality may identify poorly performing hospitals in need of improvement, point to high-performing hospitals that can share best practices, and inform patients, providers, and administrators about hospital performance.1,2 Methods of assessing quality of care have been debated for several years,3–5 with hospital-related mortality used widely as a marker.6,7 Mortality measures have the advantage that reporting of death is mandatory and comprehensive in many countries.8 The hospital standardized mortality ratio has been publicly available in the UK since 2001.9 Defined as the ratio of observed to expected deaths multiplied by 100, expected deaths are derived from statistical models that adjust for available case mix factors such as age, sex, primary diagnosis, and comorbidity.10
Hospital readmission is another potential surrogate measure of quality of care.11,12 In the USA, ~20% of the Medicare patients are readmitted within 30 days after hospital discharge.13 Although most hospital readmissions seem to have non-modifiable causes, high readmission rates of patients with defined conditions may reflect quality-of-care barriers.14
Variation in hospital performance measures such as 30-day mortality or 30-day readmission rates can stem in part from patient differences,3,6 ie, one hospital may have higher mortality and readmission rates than other hospitals, but it might also be treating patients with more complex and life-threatening conditions. The adequacy of adjustment for case mix thus remains a major challenge. In this study, we examined an alternative approach; instead of comparing hospitals head-to-head with adjustment for measured differences, we benchmarked an index hospital by comparing its performance measures with those calculated for a group of patients selected from other hospitals, who have characteristics similar to those of patients treated at the index hospital.
In this study, we define the benchmarking methodology, apply it to 30-day mortality and 30-day readmission rates for Danish hospitals, compute the number needed to harm for each hospital, and compare the outlier classification of hospitals using this approach with the classification obtained using conventional, regression-based adjustment methods. Hence, we examined performance measures for hospitals that account comprehensively for unique mixes of patients’ characteristics, including age, sex, diagnoses, medications, procedures, and comorbidities. Although the benchmarking method is broadly applicable to any class of patients, we apply it here to patients discharged with a circulatory disorder diagnosis.
Materials and methods
Data sources and study population
We conducted our nationwide cohort study in Denmark during 2011–2015. Denmark has a mixed rural and urban population of ~5.6 million persons. The Danish National Health Service provides tax-funded medical care to all residents, guaranteeing free access to general practitioners and inpatient/outpatient care in 1 of 26 hospital facilities, as well as partial reimbursement for prescription drugs (unpublished data).15
All Danish residents have a civil registration number (CRN), which allows unambiguous linkage between medical databases and public administrative registries, provided by the Danish Civil Registration System, which has recorded all changes in vital status and migration for the entire Danish population since 1968, with daily electronic updates.16
This study was based on the data from the Danish National Patient Registry (DNPR), which has recorded all admissions to Danish hospitals since 1977.17 In the DNPR, diagnoses have been classified according to the ICD-8 up to 1995 and the ICD-10 since then.17
We identified a cohort consisting of all patients with acute inpatient admissions to Danish hospitals between 2011 and 2015, with diseases of the circulatory system (ICD codes: I00–I99) as the primary discharge diagnosis. We linked transfers between hospitals, considering them as a single admission, and used the primary diagnosis from the first admission as the diagnosis code. To focus the study on more common diagnosis categories and to facilitate the process of finding matching patient cases across hospitals, we included only ICD-10 codes assigned to at least 400 patients during the 5-year study period and present in at least six of the hospitals.
We linked the cohort to the National Health Service Prescription Database, which includes data on all reimbursable prescriptions redeemed at community pharmacies and hospital-based outpatient pharmacies in Denmark since 2004. This database contains dispensing information including the Anatomical Therapeutic Chemical Classification code, date of dispensing, number of prescription refills, and pack size.18
Outcome measures
To ascertain study outcomes, we obtained information from the Danish Civil Registration system on overall mortality within 30 days after admission.16 Information on 30-day readmissions, defined as any hospital admission occurring from 1 to 30 days after the discharge date from the index admission, was obtained from the DNPR.
In addition to computing mortality and readmission rates for each hospital, we computed 30-day mortality and 30-day readmission rates for a benchmark population of patients treated at other hospitals as specified in the section “Statistical analyses”. To characterize the magnitude of the difference between a given hospital and the benchmarked population at other hospitals, we computed the number needed to harm, ie, the number of patients needed to be treated at a given hospital to cause an additional fatality/readmission that would not have occurred at another hospital.19 This was computed as the inverse of the difference in rates between the hospital and its benchmark population.
For each hospital, we also computed a false discovery rate for 30-day mortality and a false discovery rate for 30-day admissions (described in more detail in the section “Statistical analyses”). The false discovery rate is defined as the probability that a hospital flagged as an outlier is in truth not an outlier.20,21 We used the false discovery rate to weigh the evidence that a hospital is an outlier, based on the precision of the rate estimates and the magnitude of the difference between a hospital’s mortality/readmission rate and the associated benchmark rate. We flagged as an outlier any hospital with a false discovery rate <0.05, signaling a probability in excess of 0.95 that the hospital was an outlier.
Confounding factors
For all patients, we obtained age and sex details from their CRN in the Civil Registration System. We used the DNPR to ascertain diagnosis history in the 5 years prior to admission, including ICD-8 and ICD-10 diagnostic codes for ischemic heart disease, heart failure, cardiomyopathy, arterial hypertension, cardiac arrhythmias, valvular heart disease, stroke, diabetes, COPD, renal disease, liver disease, venous thromboembolism, connective tissue disease, cancer (except non-melanoma skin cancer), and dementia (see Table 1 for specific codes). We also recorded whether the patient in the 5 years prior to admission had cardiac procedures including any percutaneous coronary intervention, coronary artery bypass grafting, cardiac resynchronization therapy, radiofrequency ablation, cardiac pacemaker, implantable cardiac defibrillator, mitral valve surgery, or aortic valve surgery. The Danish NHPD provided each patient’s history of prescriptions in the 6 months prior to admission for cardiovascular medications: nitrates, antiplatelets, anticoagulants, beta blockers, angiotensin-converting enzyme inhibitors, angiotensin II receptor blockers, calcium channel blockers, diuretics, amiodarone, and lipid-lowering drugs. The NHPD also provided prescription data for the 6 months prior to admission for anti-depressants, selective serotonin reuptake inhibitors, antipsychotics, opioids, NSAIDs, aspirin, paracetamol, glucocorticoids, antidiabetics, disease-modifying anti-rheumatic drugs, antibiotics, anti-ulcer drugs, and drugs used to treat alcohol dependence (see Table 1 for codes). We also recorded the month and year of admission.
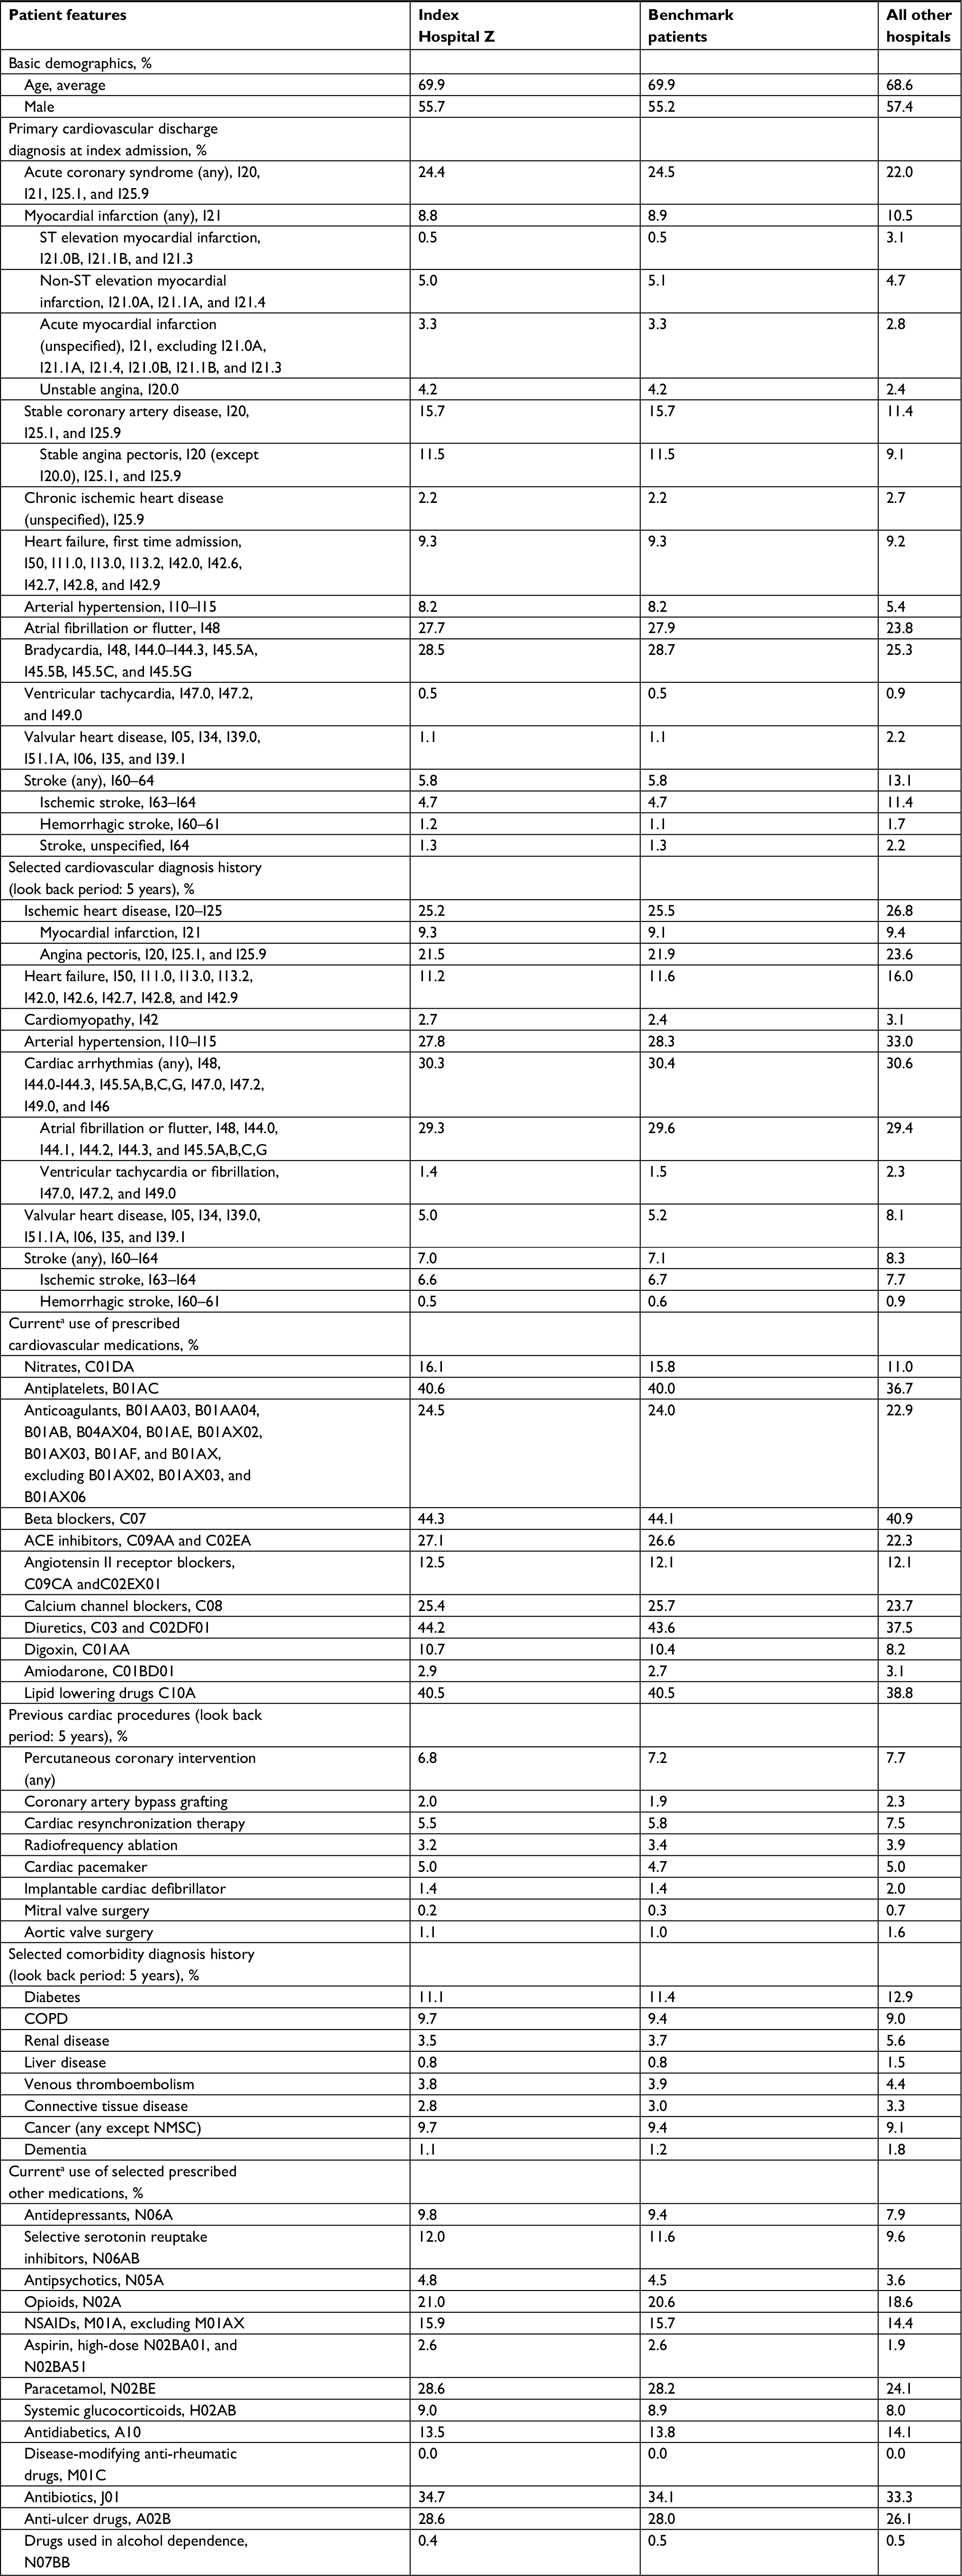 | Table 1 Distribution of selected characteristics in an index hospital population (Hospital Z), its benchmark population, and all patients at other hospitals in Denmark Notes: For primary cardiovascular discharge diagnosis at index admission, the model also matched on 105 specific ICD-10 codes, but we aggregate them here to show the results more compactly. Except for age, which is presented as the average age, all other figures are percentages. aDefined as at least one prescription within 6 months before admission. Abbreviations: ACE, angiotensin-converting enzyme; NMSC, non-melanoma skin cancer. |
Statistical analyses
Our approach to benchmarking hospitals involved the following three steps: 1) for each index hospital we applied weights to patients treated at other hospitals so that they resembled patients treated at the index hospital; 2) we compared the outcomes for each index hospital with the outcomes for their benchmark patients using a weighted regression model; and 3) we calculated each hospital’s false discovery rate.
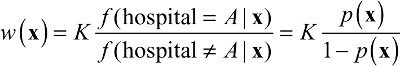
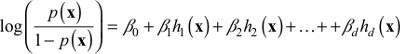
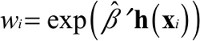
To select a benchmark population of patients as a comparison group for each hospital, we constructed a propensity score model. This model estimated the probability that a patient would be admitted to the index hospital (vs any other Danish hospital) conditional on covariates observed at discharge. We used generalized boosted modeling (GBM) to estimate these probabilities.22 GBM is a machine learning method that can capture a flexible non-parametric relationship between a large collection of patients’ features and an outcome – in this case the probability of treatment at the index hospital. Advantages of using GBM for propensity scores are its ability to account for non-linear effects, interaction effects, and handling of numeric, ordinal, and categorical features (see Supplementary materials for details). We converted the propensity score estimated with GBM to a patient weight. If the index hospital treated patient i, then patient i received a weight of 1. For patient i treated at any other hospital the weight was  , where p(xi) is the propensity score and xi represents the covariates of patient i. Previous research has used propensity score stratification to adjust for provider case mix (the mix of patient types treated at hospitals23) based on a small set of patients’ features.24
To compare 30-day mortality and 30-day readmission rates between a hospital and its benchmark population, we used a propensity score-weighted logistic regression in a doubly robust estimation step (see Supplementary materials for a detailed description) to obtain doubly robust adjusted mortality and readmission rates.25 The weighted regression includes all patient covariates and produces consistent estimates of the adjusted rates if either the propensity score model or the regression model is correct. We extracted the P-value for the index hospital effect from the weighted regression model as a measure of the difference between a specific hospital’s average outcomes and average outcomes for patients treated at other hospitals. For each of the 26 hospitals in turn, we refitted a new propensity score model, estimated a new doubly robust estimation step, and extracted the index hospital effect P-value. A similar approach has been used previously to analyze public safety performance.26
Finally, we converted the P-values to false discovery rates.20,21,27 The false discovery rate is the expected fraction of type I errors. In our example, this is the fraction of hospitals flagged as outliers that are not actually outliers. False discovery rates, rather than P-values, are essential for benchmarking. If we flagged every hospital with a P-value less than the traditional 0.05, even if no hospital differed from its benchmark in reality, we would expect to flag one hospital as an outlier (26 hospitals ×0.05=1.3). The Benjamini–Hochberg false discovery rate procedure presents a collection of P-values in increasing order,  , and rejects hypotheses for which
  . The rejected hypotheses will have a false discovery rate less than or equal to q (closest to q if outliers are rare). We applied the Benjamini–Yekutieli modification21 that allows for dependence among the P-values. Rather than select a specific q, we report each hospital’s estimated q-value, the smallest q for which that hospital would be flagged as an outlier.28 For example, any hospital flagged as an outlier with a q-value <0.05 would have at most a 5% chance of being a false positive. Although adjusting P-values for multiple testing is not always necessary,29 we approached the detection of outlier expecting that most hospitals will match their benchmark and few will deviate greatly from their benchmark.
For each of the 26 Danish hospitals, we indicated whether its 30-day mortality and readmission rates substantially differed from a set of similar patients treated at other Danish hospitals and reported the probability of its truly being an outlier.
Finally, we compared the results of our proposed benchmarking approach with common practices. Perhaps, the most common practice is to compare hospital performance to a national or regional average, flagging as outliers those hospitals whose performance differs from this average (ie, with a P-value of <0.05).30 Alternative approaches account only for a small set of patients’ features, typically age, sex, and comorbidities, using a regression model. They flag as an outlier any hospital with an outcome that differs from that predicted by the model for the hospital (flagging as outliers those hospitals with fixed effects that have an associated P-value of <0.05).24 We compared hospitals that our benchmarking method flagged as outliers with hospitals flagged as outliers using unadjusted and regression-adjusted methods and counted the number of agreements and disagreements in outlier labeling.
Results
We identified 365,636 patients admitted to Danish hospitals during 2011–2015 with a circulatory system disease recorded as the primary discharge diagnosis. After excluding ICD-10 codes assigned to fewer than 400 patients over the 5-year study period or present at fewer than six hospitals, as well as ICD-10 code I99.9 (unspecific circulatory disorder), 331,513 patients remained for analysis.
The patients’ median age was 70 years and 57% were men. The three most common diagnoses were atrial fibrillation and flutter (ICD-10 code I48, 24%), acute myocardial infarction (ICD-10 code I21, 11%), and stroke (ICD-10 code I63, 9%). However, the hospitals exhibit substantial variation in their patient case mix. The average age of patients at each of the 26 hospitals ranged from a minimum of 66 years to a maximum of 73 years. At one hospital, 11% of the patients had a primary discharge diagnosis of atrial fibrillation and flutter, whereas at another hospital 41% had this diagnosis. Hospitals ranged from having 5% acute myocardial infarction patients to 22%. For one hospital, 38% of the patients had recent prescriptions for a beta blocker and at another hospital 58% of the patients had recent beta blocker prescriptions. The patients treated at the 26 Danish hospitals differ in numerous factors that are highly relevant to mortality and readmission.
Table 1 focuses on one particular index hospital compared to all others. Table 1 shows the selected characteristics of: 1) patients at an example index hospital (Hospital “Z”), 2) patients used to form Hospital Z’s benchmark, and 3) all patients at all other hospitals (Table 1 does not describe all patients in the study, just a comparison of Hospital Z’s patients with its benchmark and patients at other hospitals). For example, compared to patients treated at all other hospitals, Hospital Z’s circulatory system patients were more likely to be admitted for angina pectoris (15.7% vs 11.4%), but less likely to be admitted for stroke (5.8% vs 13.1%). Although Table 1 only shows the data for a few selected primary diagnosis categories, the hospital and its benchmark matched on 105 specific ICD-10 codes. For example, Table 1 shows that Hospital Z not only matches its benchmark on the percentage discharged with a stroke diagnosis but the hospital and its benchmark also match on each of the specific stroke ICD-10 codes (eg, 3.1% of the patients were discharged with an I63.9 ICD-10 code for both Hospital Z and its benchmark population of patients). Our propensity score model successfully created a weighted group of patients treated at other hospitals that uniformly resembled Hospital Z’s patients. The largest difference between Hospital Z’s patients and the benchmark population across all patients’ features was less than a percentage point.
Not only did the mean values and percentages of Hospital Z’s patients’ features match those of the benchmark population but also the entire age distribution of patients at Hospital Z and patients in its benchmark population was nearly identical (Figure 1A).
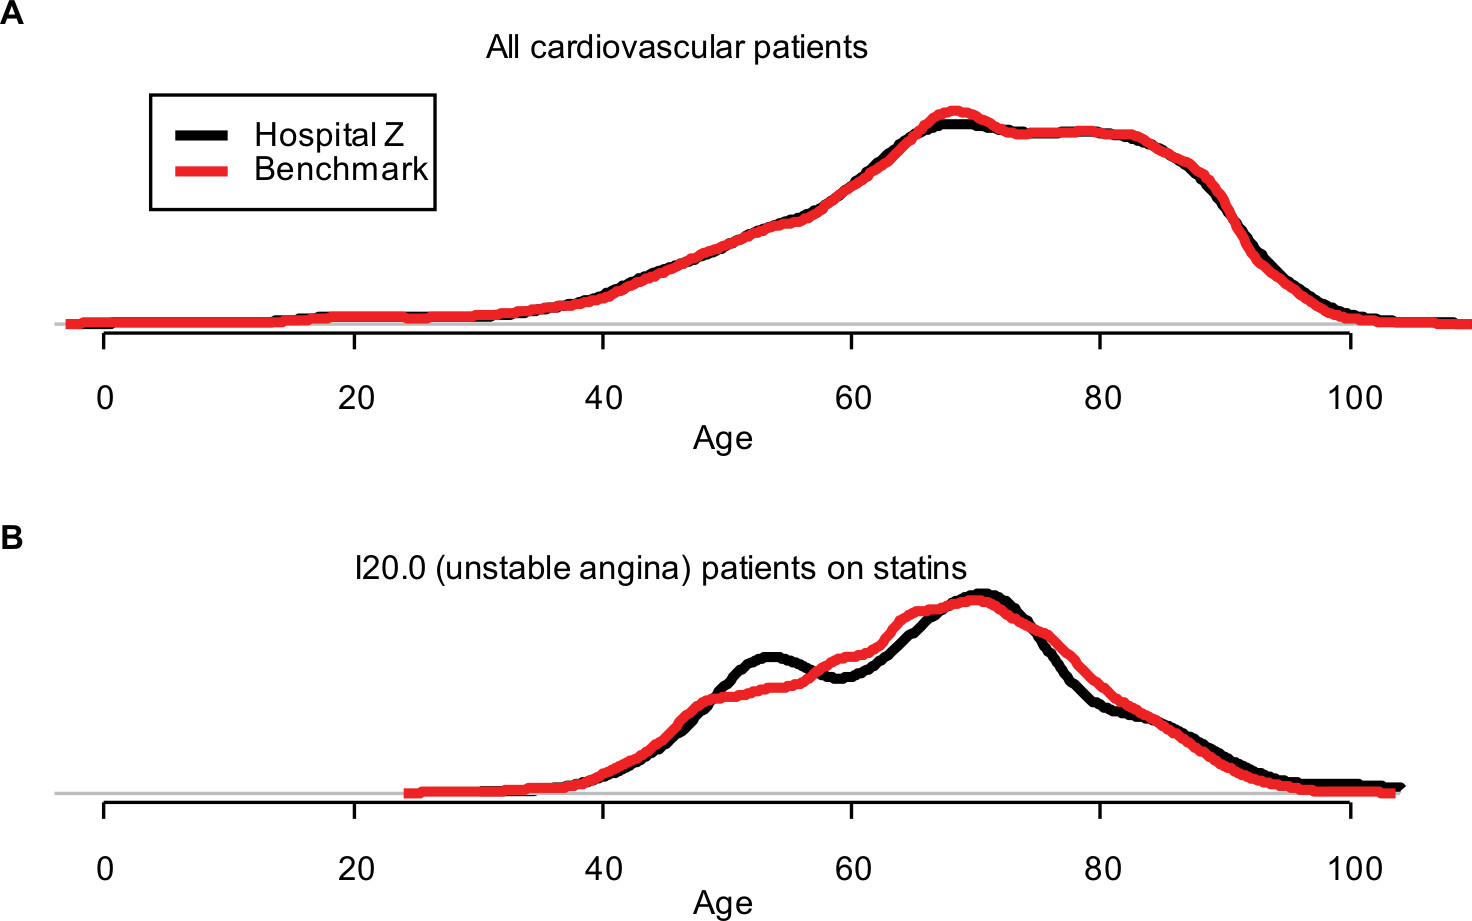 | Figure 1 Comparison of the age distribution of Hospital Z (black) to the age distribution of Hospital Z’s benchmark population of patients (red). Notes: (A) Comparison of the distribution for all patients. (B) The age distribution also matches within (arbitrarily selected) I20.0 patients on statins, demonstrating the balance of patients’ features in three-way interactions. |
Furthermore, combinations of patients’ features matched. Figure 1B shows the age distribution of patients with an unstable angina diagnosis and a prior statin prescription, an arbitrarily selected combination. More variability is evident because of the smaller number of patients with these features, but the age distributions still matched closely.
We created 25 other tables similar to Table 1 for each of the other 25 hospitals. In each case, we successfully established a set of benchmark patients closely resembling the index hospital’s patients. In all cases, the largest difference for any patient feature between the index hospital and its benchmark population was 0.8%.
Figure 2 shows each hospital’s 30-day post-admission mortality rate compared to the mortality rate for the hospital’s benchmark population. For this measure, hospitals on the right side of Figure 3 substantially exceeded the mortality rate in their benchmark population. For example, the 30-day mortality rate for circulatory system patients in Hospital Z was 6.9% (marked with a black point), whereas similar patients treated at other Danish hospitals had a mortality rate of 5.1% (marked with a red point). The false discovery rate for this hospital was <1%, indicating a high probability that this hospital was an outlier. Table 1 shows that this hospital closely resembled its benchmark patients, so the 1.8 percentage point observed difference in mortality rates cannot be due to differences in patient case mix for any of the features shown in the table. Five hospitals (V, T, W, Y, and Z) exceeded the mortality rate in their benchmark population and had false discovery rates <0.05. To put the differences in mortality rates into perspective, Figure 2 shows the number needed to harm for each of these outlier hospitals.
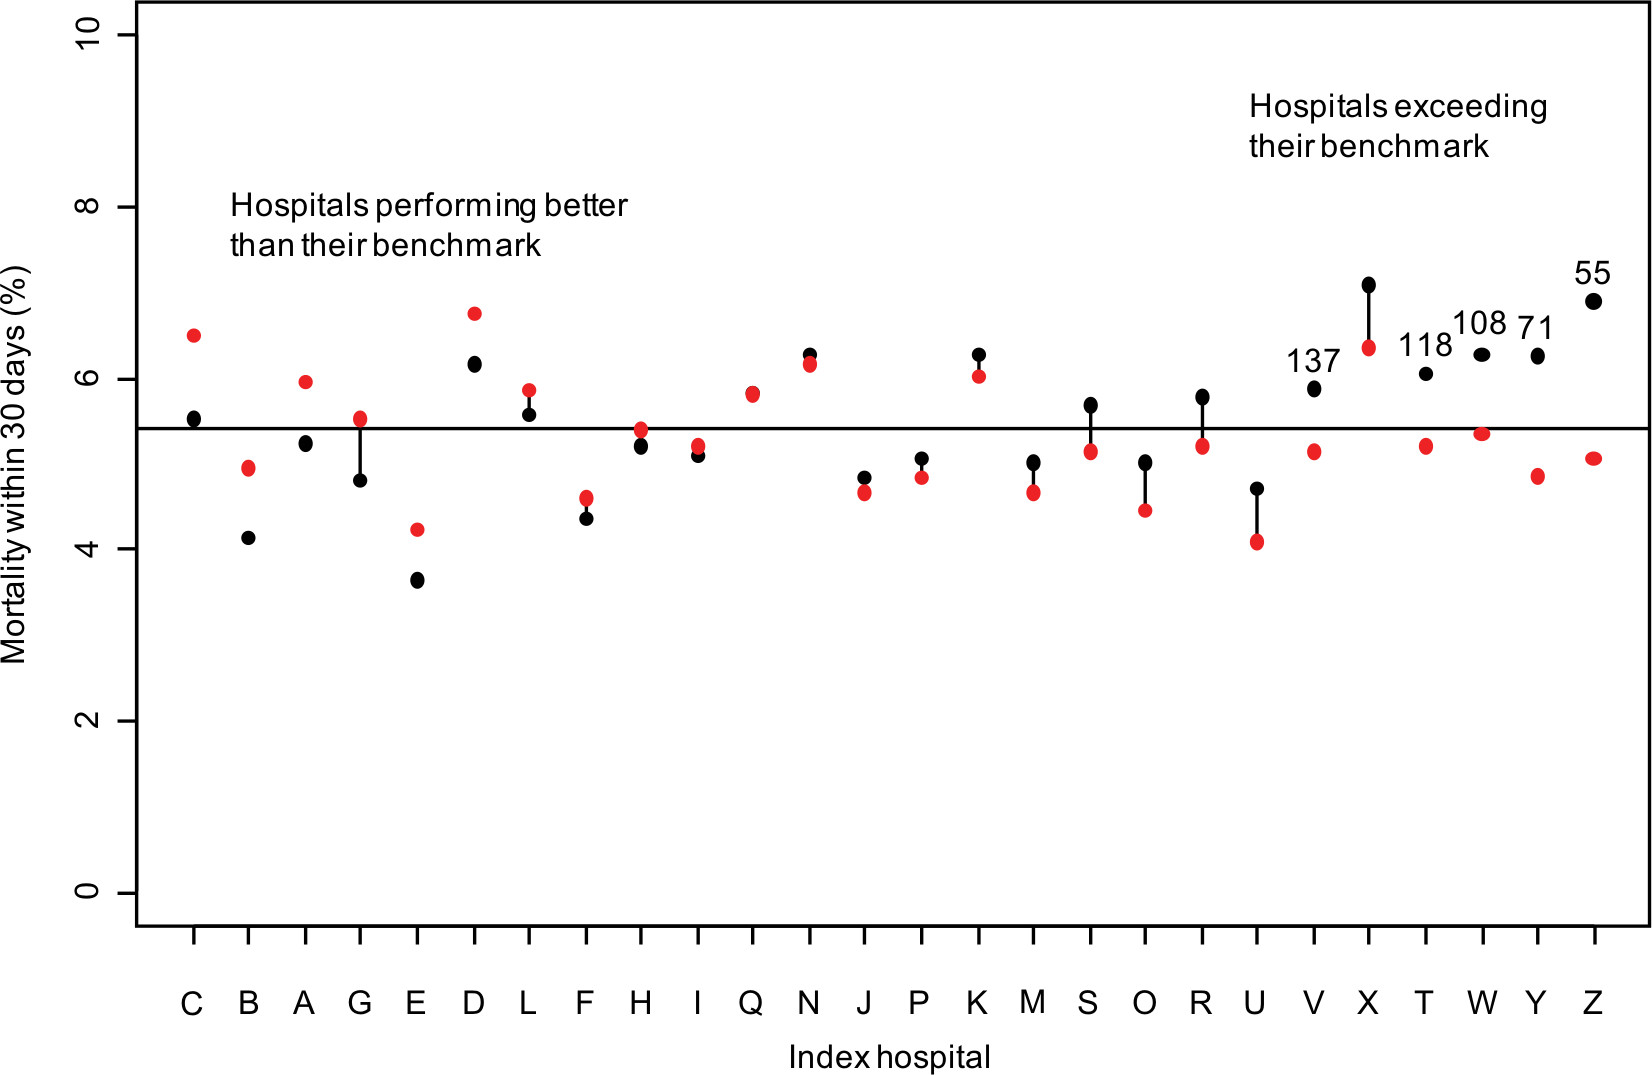 | Figure 2 Mortality within 30 days of admission by hospital (black) compared with its benchmark population (red). Notes: Lines connect hospitals to their benchmark population when the false discovery rate exceeds 5%. The numbers above the dots indicate the number needed to harm for hospitals exceeding their benchmark, which are flagged as outliers. The horizontal line is the average mortality rate (5.4%). |
 | Figure 3 Readmission within 30 days of discharge by hospital (black) compared to its benchmark population (red). Notes: Lines connect hospitals to their benchmark population when the false discovery rate exceeds 5%. Numbers above the dots indicate the number needed to harm for hospitals exceeding their benchmark, which are flagged as outliers. The horizontal line marks the average 30-day readmission rate (18.5%). |
At the other extreme, Hospital C had a mortality rate of 5.5%, a full percentage point lower than its benchmark population’s mortality rate of 6.5%. Hospital N, near the middle of Figure 2, had a relatively high mortality rate of 6.3%, about 1 percentage point higher than the national average of 5.4% (shown by the horizontal line). However, because of its patient case mix, its benchmark population had a similarly elevated mortality rate. Comparisons with the national average would have identified this hospital as an outlier. In Figure 2, hospitals with lines connecting the hospital and benchmark points indicate those with false discovery rates >5%, which signal that these rates may be statistically indistinguishable. However, no public health standard has emerged for false discovery rate thresholds.
We also compared 30-day readmission rates among hospitals, as shown in Figure 3. Hospital G had a readmission rate exceeding 23%, far greater than the rate for its benchmark population (18.8%) and the national average (18.5%). A total of seven hospitals exceeded their benchmark populations’ readmission rates, with false discovery rates <5%. Hospital U, in contrast, had a benchmark readmission rate of 19.5%, indicating that this hospital’s case mix would be consistent with high readmission rates. However, Hospital U had among the lowest readmission rates of any hospital, 4 percentage points lower than the rate for its benchmark population.
Benchmarking vs conventional approaches
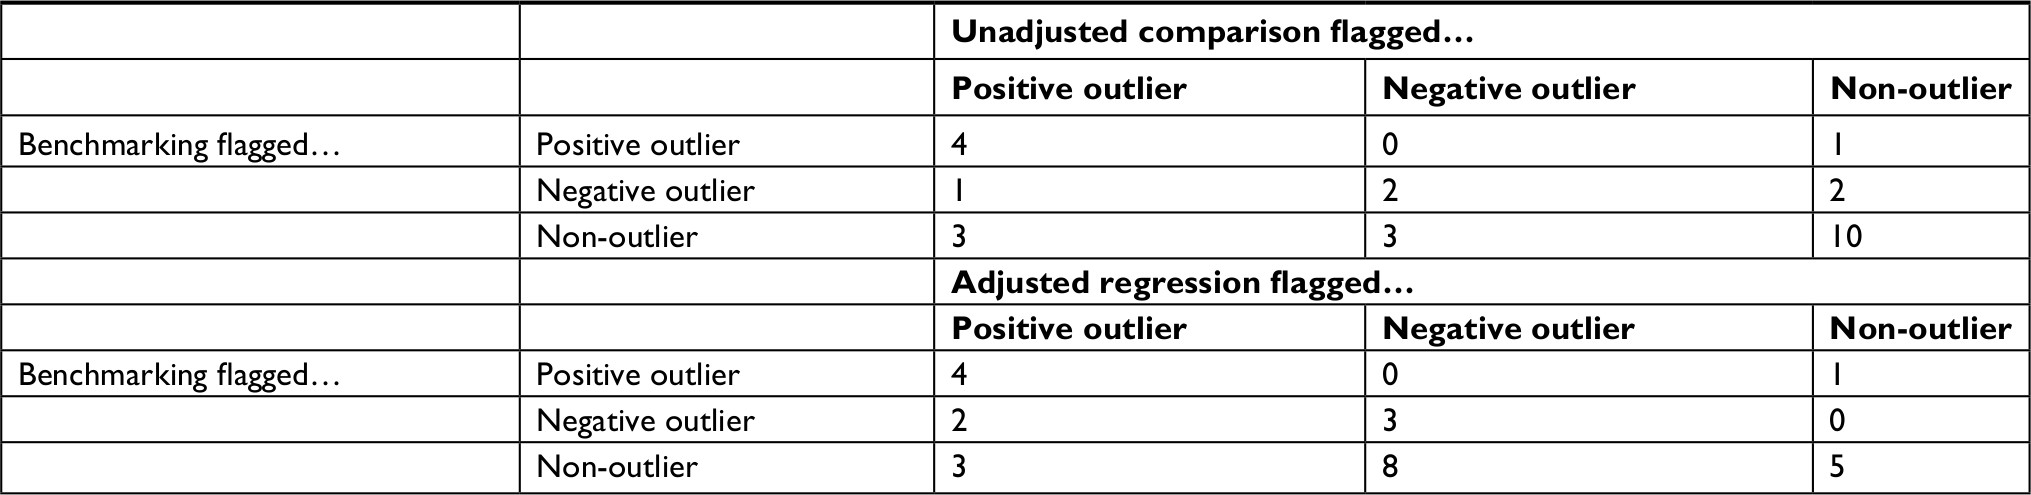
Table 2 shows the number of hospitals that our benchmarking methodology flagged as outliers (using a false discovery rate <5%). We compared these with hospitals flagged as outliers using the unadjusted and regression-adjusted methods (using P-values <0.05). Table 2 differentiates between positive outliers (those with high mortality rates) and negative outliers (those with low mortality rates). The counts on the diagonals indicate the number of hospitals for which the diverse methods produced similar results. The benchmarking and unadjusted comparison methods agreed on the identification of four hospitals as positive outliers, two hospitals as negative outliers, and ten hospitals as non-outliers. The benchmarking and regression adjustment methods agreed on the identification of four positive outliers, three negative outliers, and five non-outliers.
 | Table 2 Comparison of 30-day mortality outliers flagged with benchmarking, unadjusted comparisons, and regression-adjusted comparisons |
However, for 10 hospitals benchmarking disagreed with the unadjusted comparison and for 14 hospitals benchmarking disagreed with the regression-adjusted comparison. In some cases, benchmarking flagged a hospital as a negative outlier, whereas conventional methods flagged it as a positive outlier. Both conventional methods flagged Hospital N as a positive outlier, but benchmarking, with more complete control of confounding than conventional methods, ascertained lower-than-expected mortality rates. Both conventional methods were more likely to flag hospitals as outliers than the benchmarking method. The benchmarking method that relies on thorough control of confounding and accounting of multiple comparisons reduced the risk of false positives.
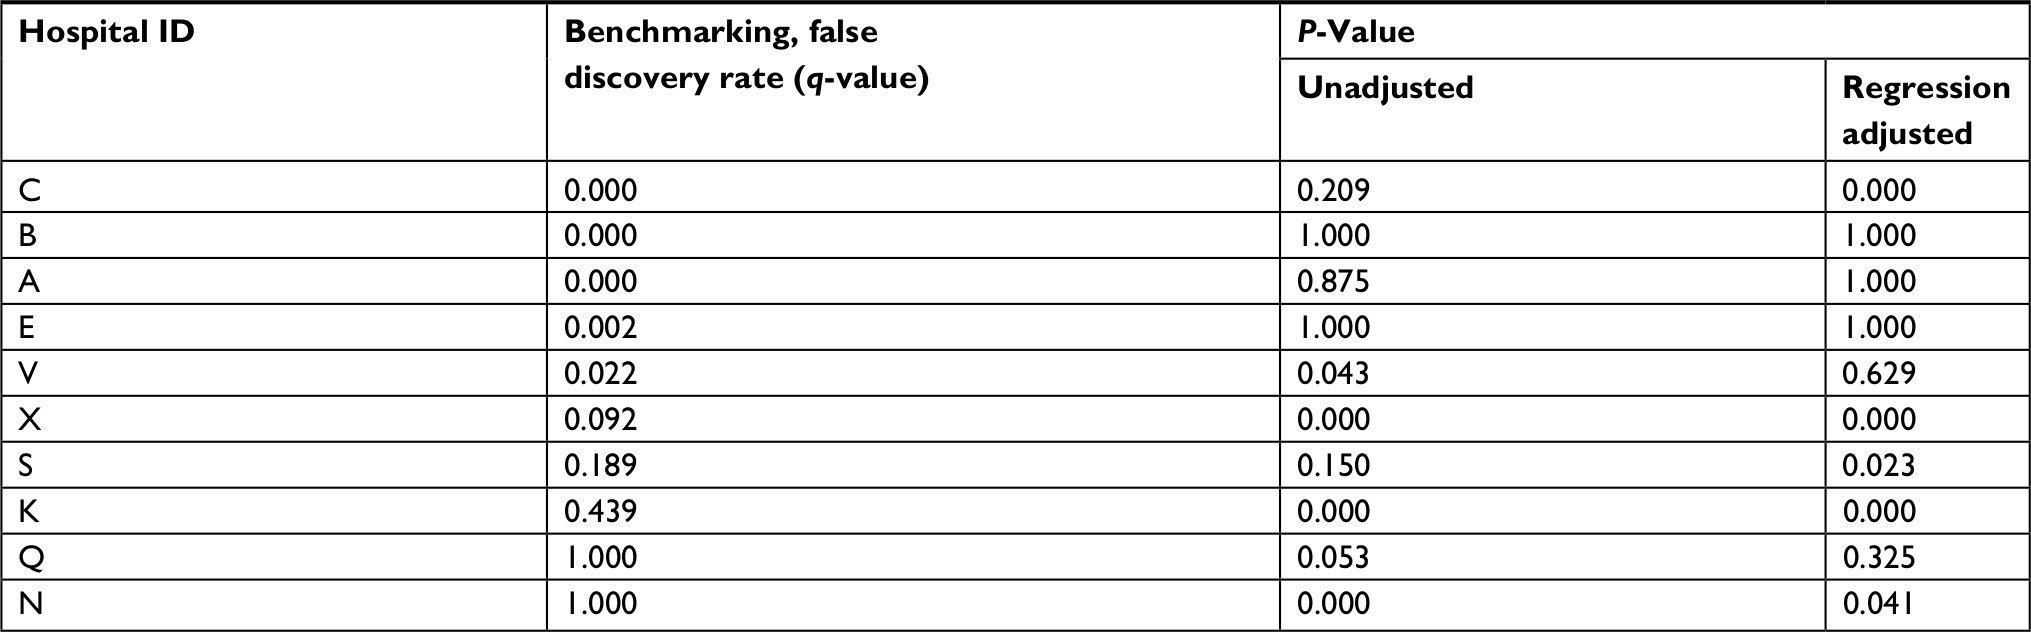
Table 3 shows the selected hospitals for which the level of disagreement is striking. Four hospitals in Table 3 (N, Q, K, and S) appear in the middle of Figure 2, indicating that their 30-day mortality rates are nearly identical to that expected based on their patients’ features. For these hospitals, either one or both unadjusted and regression-adjusted methods would indicate that they were significant outliers. Hospital N was noted previously as having a high mortality rate compared to the national average, but benchmarking indicated that this hospital’s case mix is consistent with a higher mortality rate. In the case of Hospital V, benchmarking indicated that it was an outlier, but regression adjustment suggested it was not.
 | Table 3 Selected hospitals for which benchmarking, unadjusted comparisons, and regression adjustment disagree, including their status as an outlier for 30-day mortality rate |
Discussion
We defined a benchmarking approach and applied it to cardiovascular health care quality metrics, in line with Denmark’s focus on monitoring the quality of cardiovascular treatment. Our analysis flags specific hospitals that exceed their mortality rate and readmission rate benchmarks and likely require closer review. Our benchmarking approach uses a flexible machine learning approach to estimate propensity scores, adjusting for patient case mix based on a thorough appraisal of clinically relevant patients’ features. Importantly, the propensity score model addressed differences in patients treated at different hospitals. Our use of doubly robust estimation further reduced confounding stemming from any remaining differences between a hospital’s patients and the group of patients used to construct benchmarks for the hospital. Our rigorous accounting of patients’ features precludes hospitals flagged as outliers from claiming that they treat a more complex patient population than their comparison hospital, which adversely affects their performance. We included false discovery rates to estimate the outlier probabilities for each hospital. Unlike a P-value, the false discovery rate is a measure that can be used to define thresholds that would trigger further steps.
If the proposed methods are not adopted as a standard, based on statistical arguments and simulation experiments, classification of hospitals using conventional methods will result in frequent false-positive selection of outliers due to chance. Our proposed benchmarking approach aids in decision-making about hospital quality. Action should be taken (such as an investigation or review) whenever the cost of addressing an outlier times the false discovery rate is less than the cost of failing to address an outlier (excess injuries, fatalities, and liability) times one minus the false discovery rate.
We demonstrated that conventional methods (unadjusted comparisons or regression adjustments) flagged more hospitals as outliers than our benchmarking approach. Since conventional methods have limited capacity to rigorously address confounding and simultaneous testing of hospital differences, the excess number of outliers they generate is likely due to insufficient adjustment for differences in patient case mix and higher false-positive rates. Benchmarking also corrects for simultaneous comparison with a false discovery rate calculation, which conventional methods often ignore.
Several potential limitations of our approach also must be considered. Benchmarking is only as good as the data on which it is based. For example, the propensity score model produced close alignment between Hospital Z’s patients and its benchmark population. Therefore, differences in readmission rates between the hospitals were not due to observed patient demographics, diagnoses, medications, previous cardiac procedures, or comorbidities. Other unmeasured factors, such as lifestyle (eg, smoking and obesity), organizational, economic (eg, income and employment), social (eg, family structure), or geographic characteristics (eg, distance to hospitals and transfers between hospitals)31 must have produced this difference.
Benchmarking is useful if it identifies potential problematic practices, but it also could reflect differences between hospitals in coding practices, such as use of non-specific codes. Data may contain misclassified diagnoses and the rate of misclassifications could vary by hospital, although positive predictive values are generally good for cardiovascular diseases and procedures in Denmark.32,33 Even if data contain properly coded diagnoses, they may not capture differences in severity of the disease or of comorbidities. It must also be noted that our analysis excluded 9% of the patients, who had either a diagnosis of unspecific circulatory disorder or uncommon ICD-10 codes. These exclusions offset the analysis toward common diagnoses. However, if rare cases offer the greatest opportunity to detect outlier hospitals, then a method that excludes such cases will not be able to flag them as outliers.
We chose to examine circulatory disorders because of their seriousness, the large number of patients, and the constitutional focus on monitoring quality of cardiovascular health care through specialized registries in Denmark. The Danish Heart Registry, established in 1998, serves as a data source for nationwide cardiovascular research within the field of ischemic heart and heart valve disease.34 An annual report summarizes activity, waiting times, and prognostic factors. The Western Denmark Heart Registry, founded in 1999, submits data to the Danish Heart Registry in collaboration with Western Denmark’s three major cardiac centers. As well, it collects data on cardiac patients, invasive procedures, and cardiac surgery and monitors 30-day mortality following treatment.35 The Danish Heart Failure Registry is a nationwide registry established in 2003 as a part of a large nationwide quality improvement initiative aimed at monitoring and improving the quality of care for patients with specific severe diseases.36 This Registry monitors 1-year mortality following initial admission for heart failure. The Danish health system has shown a substantial reduction in 1-year heart failure mortality since the Registry’s inception, decreasing from 20.5% to 12.8% between 2003 and 2010.37 Finally, the Danish Stroke Registry has monitored the quality of stroke care since 2003 and transient ischemic attack since 2013. This Registry maintains data on key processes of care and patient outcomes and includes hospital-specific reports of quality measures such as 30-day readmission and 30-day mortality.38
Correctly measuring the performance of health care providers, including doctors, nurses, medical groups, and hospitals, critically depends on adequately addressing differences in patient case mix. Commonly used methods fail to adjust for case mix and make comparisons with a regional average, such as Medicare’s Hospital Compare.30 They also may make modest regression adjustments with a limited number of features24 using models with stringent parametric assumptions.39,40 Regression adjustment is particularly problematic in the presence of many highly correlated features, which frequently occur in patient data. In these circumstances, the estimated provider effect is extremely sensitive to the exact form of the regression model specification. For example, inclusion or exclusion of an interaction term can change the magnitude or even the sign of the estimated provider effect.
Nothing about the benchmarking methodology described here is unique to cardiovascular patients, hospital-level performance measurement, or Denmark. The methodology, in principle, is applicable to any collection of patients. Rigorous case mix adjustment when benchmarking for other categories of patients almost certainly requires different sets of patients’ features than those used here. Although our analysis compared performance at the hospital level, the methodology could provide benchmarks for individual providers. Finally, other nations providing single-payer health care systems as well as a wide range of networks of providers, insurers, and patients worldwide need benchmarks to measure the performance of their health care providers. This need is not unique to Denmark, indicating that our proposed methodology has wide-ranging applicability.
Conclusion
We defined a benchmarking methodology that provides more thorough adjustment for differences in patient case mix when comparing hospitals. Demonstrating the methodology on 26 Danish hospitals, we found that five hospitals greatly exceed their benchmarks for 30-day mortality rates and seven hospitals greatly exceed their benchmarks for 30-day readmission rates for cardiovascular patients. Our proposed benchmarking methodology flags fewer outliers than conventional methods that have less capacity for controlling for confounding. Given the magnitude of hospital expenditures, the stakes of misclassifying outliers are high. Further study of outlier classification methods in different settings with more hospitals is imperative to identify misleading classification methods and to introduce methods with fairer rewards and incentives for practitioners.
Ethical statement
Studies based solely on data from the Danish national registers, by Danish legislation, do not require approval from the Danish Health Research Ethics committees, as study participants are never contacted, and consent is not required for the use of register information.
Disclosure
The authors report no conflicts of interest in this work.
References
Brook RH, McGlynn EA, Cleary PD. Quality of health care. Part 2: measuring quality of care. N Engl J Med. 1996;335(13):966–970. | ||
Blumenthal D. Quality of care – what is it? N Engl J Med. 1996;335(12):891–894. | ||
Freemantle N, Richardson M, Wood J, et al. Can we update the Summary Hospital Mortality Index (SHMI) to make a useful measure of the quality of hospital care? An observational study. BMJ Open. 2013;3(1):e002018. | ||
Lilford R, Pronovost P. Using hospital mortality rates to judge hospital performance: a bad idea that just won’t go away. BMJ. 2010;340:c2016. | ||
Black N. Assessing the quality of hospitals. BMJ. 2010;340:c2066. | ||
Dubois RW, Rogers WH, Moxley JH, Draper D, Brook RH. Hospital inpatient mortality. Is it a predictor of quality? N Engl J Med. 1987;317(26):1674–1680. | ||
Shahian DM, Iezzoni LI, Meyer GS, Kirle L, Normand S-LT. Hospital-wide mortality as a quality metric. Am J Med Qual. 2012;27(2):112–123. | ||
World Health Organization. World Health Statistics 2017: Monitoring Health for the SDGs, Sustainable Development Goals. Geneva: World Health Organization; 2017. | ||
Jarman B, Bottle A, Aylin P, Browne M. Monitoring changes in hospital standardised mortality ratios. BMJ. 2005;330(7487):329. | ||
Bottle A, Jarman B, Aylin P. Strengths and weaknesses of hospital standardised mortality ratios. BMJ. 2010;342:c7116. | ||
Acheson ED, Barr A. Multiple spells of in-patient treatment in a calendar year. Br J Prev Soc Med. 1965;19(4):182–191. | ||
Leng GC, Walsh D, Fowkes F, Swainson CP. Is the emergency readmission rate a valid outcome indicator? Qual Health Care. 1999;8(4):234–238. | ||
Jencks SF, Williams MV, Coleman EA. Rehospitalizations among patients in the Medicare fee-for-service program. N Engl J Med. 2009;360(14):1418–1428. | ||
Benbassat J, Taragin M. Hospital readmissions as a measure of quality of health care: advantages and limitations. Arch Intern Med. 2000;160(8):1074–1081. | ||
Frank L. Epidemiology. When an entire country is a cohort. Science. 2000;287(5462):2398–2399. | ||
Schmidt M, Pedersen L, Sørensen HT. The Danish Civil Registration System as a tool in epidemiology. Eur J Epidemiol. 2014;29(8):541–549. | ||
Schmidt M, Schmidt SA, Sandegaard JL, Ehrenstein V, Pedersen L, Sørensen HT. The Danish National Patient Registry: a review of content, data quality, and research potential. Clin Epidemiol. 2015;7:449–490. | ||
Johannesdottir SA, Horváth-Puhó E, Ehrenstein V, Schmidt M, Pedersen L, Sørensen HT. Existing data sources for clinical epidemiology: the Danish National Database of Reimbursed Prescriptions. Clin Epidemiol. 2012;4(1):303–313. | ||
Fletcher RH, Fletcher SW, Fletcher GS. Clinical Epidemiology: The Essentials. 5th ed. Baltimore, MD: Lippincott, Williams, & Wilkins; 2014. | ||
Seeger P. A note on a method for the analysis of significances en masse. Technometrics. 1968;10(3):586–593. | ||
Benjamini Y, Yekutieli D. The control of the false discovery rate in multiple testing under dependency. Ann Stat. 2001;29(4):1165–1188. | ||
McCaffrey DF, Ridgeway G, Morral AR. Propensity score estimation with boosted regression for evaluating causal effects in observational studies. Psychol Methods. 2004;9(4):403–425. | ||
Ording AG, Sørensen HT. Concepts of comorbidities, multiple morbidities, complications, and their clinical epidemiologic analogs. Clin Epidemiol. 2013;5:199–203. | ||
Huang IC, Frangakis C, Dominici F, Diette GB, Wu AW. Application of a propensity score approach for risk adjustment in profiling multiple physician groups on asthma care. Health Serv Res. 2005;40(1):253–278. | ||
Bang H, Robins JM. Doubly robust estimation in missing data and causal inference models. Biometrics. 2005;61(4):962–973. | ||
Ridgeway G, Macdonald JM. Doubly robust internal benchmarking and false discovery rates for detecting racial bias in police stops. J Am Stat Assoc. 2009;104(486):661–668. | ||
Efron B. Large-Scale Inference. New York: Cambridge University Press; 2010. | ||
Yekutieli D, Benjamini Y. Resampling-based false discovery rate controlling multiple test procedures for correlated test statistics. J Stat Plan Inference. 1999;82(1–2):171–196. | ||
Rothman KJ. Six persistent research misconceptions. J Gen Intern Med. 2014;29(7):1060–1064. | ||
Paddock SM, Adams JL, Hoces de la Guardia F. Better-than-average and worse-than-average hospitals may not significantly differ from average hospitals: an analysis of Medicare Hospital Compare ratings. BMJ Qual Saf. 2015;24(2):128–134. | ||
Terkelsen CJ, Sørensen JT, Maeng M, et al. System delay and mortality among patients with STEMI treated with primary percutaneous coronary intervention. JAMA. 2010;304(7):763–771. | ||
Sundbøll J, Adelborg K, Munch T, et al. Positive predictive value of cardiovascular diagnoses in the Danish National Patient Registry: a validation study. BMJ Open. 2016;6(11):e012832. | ||
Adelborg K, Sundbøll J, Munch T, et al. Positive predictive value of cardiac examination, procedure and surgery codes in the Danish National Patient Registry: a population-based validation study. BMJ Open. 2016;6(12):e012817. | ||
Özcan C, Juel K, Flensted Lassen J, von Kappelgaard LM, Mortensen PE, Gislason G. The Danish Heart Registry. Clin Epidemiol. 2016;8:503–508. | ||
Schmidt M, Maeng M, Jakobsen CJ, et al. Existing data sources for clinical epidemiology: the Western Denmark Heart Registry. Clin Epidemiol. 2010;2:137–144. | ||
Schjødt I, Nakano A, Egstrup K, Cerqueira C. The Danish Heart Failure Registry. Clin Epidemiol. 2016;8:497–502. | ||
Nakano A, Johnsen SP, Frederiksen BL, et al. Trends in quality of care among patients with incident heart failure in Denmark 2003-2010: a nationwide cohort study. BMC Health Serv Res. 2013;13:391. | ||
Johnsen SP, Ingeman A, Hundborg HH, Schaarup SZ, Gyllenborg J. The Danish stroke registry. Clin Epidemiol. 2016;8:697–702. | ||
Finison K, Mohlman M, Jones C, et al. Risk-adjustment methods for all-payer comparative performance reporting in Vermont. BMC Health Serv Res. 2017;17(1):58. | ||
Shahian DM, Normand SL. What is a performance outlier? BMJ Qual Saf. 2015;24(2):95–99. |
Supplementary materials
Details of propensity score estimation with generalized boosted models, doubly robust estimation, and false discovery rates
Propensity score estimation to match patients
We assign weights to patients treated at other hospitals so that, after weighting, those patients have features that collectively resemble the hospital for which we are constructing a benchmark. Mathematically, for a hypothetical index hospital “Hospital A”, this means solving for a weight function w(x) such that:
| (1) |

where x represents a patient’s features, f(x|hospital = A)is the distribution of patients’ features at Hospital A, and f(x|hospital ≠ A) is the distribution of features of all other patients not treated at Hospital A. Solving for w(x) yields:
| (2) |
where p(x) is the propensity score, the probability that a patient with features x received treatment at Hospital A. Patient i not treated at Hospital A will receive weight p(xi)/(1-p(xi)). K is a constant that will cancel out in calculations of any weighted statistics.
We estimate p(x) from the patient data using generalized boosted modeling. This modeling strategy is similar to logistic regression except that, rather than using the individual x’s as covariates, we use a linear combination of transformations of the x’s:
| (3) |
Specifically, the functions hj(x) are all piecewise constant functions of x and their interactions involving up to three patients’ features, sufficiently flexible to capture non-linear relationships, threshold and saturation effects, and higher order interactions.
Estimating Equation 3 without constraints results in an unidentifiable and numerically unstable model. Boosting approximates the use of the lasso penalty when estimating models with maximum likelihood.1 That is, we estimate the coefficients in Equation 3 by finding the βj that maximizes:
| (4) |
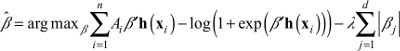
where Ai is a 0/1 indicator of whether patient i was at Hospital A. If l = 0 then maximizing Equation 4 is equivalent to standard logistic regression, but with the h’s as covariates. When λ is large, then the penalty forces all βj’s to be close to 0 and will actually set most βj’s to be equal to 0. Boosting iteratively relaxes the size of λ, determining at each step which of the hj(x)’s will have a non-zero coefficient, and includes them in the model. Although the set of basis functions may be extremely large, most have coefficients equal to 0 and never need to be computed or stored. The boosting algorithm iterates until the features of patients at Hospital A most closely resemble the features of patients at other hospitals. This approach has been shown to outperform alternative methods for estimating propensity scores.2
We use the resulting set of βj’s and hj(x)’s to compute propensity score weights for patients at other hospitals:
| (5) |
Doubly robust estimation to estimate the hospital effect
To compute the hospital effect, we fit a weighted logistic regression of the form shown in Equation 6, where Hospital A’s patients have weight 1 and the other patients have weight wi.
| (6) |
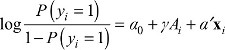
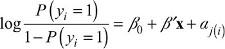
where yi is the 0/1 indicator for death or readmission within 30 days for patient i. Since the propensity score weights uncorrelate the confounders from A, their inclusion can reduce bias in the estimate of g by adjusting for any remaining imbalance between Hospital A’s patients and the other patients.
We extract the p-value for testing g=0 from Equation 6 as a measure of the difference between Hospital A’s outcomes and the benchmark outcomes. For each of the 26 hospitals in turn, we refit a new propensity score model and the doubly robust estimation step. At the end, we have 26 p-values.
False discovery rates for detecting outliers
Converting p-values to false discovery rates was developed by Seeger3 and refined and popularized by Benjamini and Hochberg.4 For cases where p-values are not independent, Benjamini and Yekutieli proposed5 a modification, which we adopted. We converted a set of m p-values arranged in descending order, P(m), P(m-1),..., P(1), into q-values as:
| (7) |
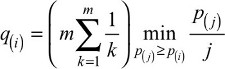
where m is the number of comparisons (m=26 hospitals in our example). Any q(i) that exceeds 1 is set to equal 1. The false discovery rate for hospital (i) will be less than or equal to q(i).
Conventional covariate adjustment
To compare the benchmarking approach with conventional covariate adjustment, we fit a logistic regression model of the form:
| (8) |
where yi is the 0/1 outcome for 30-day mortality or readmission, x is a vector of patients’ features (age, sex, and comorbidity indicators), and aj is a fixed effect for Hospital j. We then compute the average predicted mortality and readmission rates for Danish patients as if they had been treated at each of the 26 hospitals. We then compare the covariate-adjusted rates to the national average.
References
Zhao P, Yu B. Stagewise Lasso. J Mach Learn Res. 2004;8:2701–2726. | ||
Lee BK, Lessler J, Stuart EA. Improving propensity score weighting using machine learning. Stat Med. 2010;29(3):337–346. | ||
Seeger P. A note on a method for the analysis of significances en masse. Technometrics. 1968;10(3):586–593. | ||
Benjamini Y, Hochberg Y. Controlling the false discovery rate: a practical and powerful approach to multiple testing. J R Stat Soc Series B. 1995;57(1):289–300. | ||
Benjamini Y, Yekutieli D. The control of the false discovery rate in multiple testing under dependency. Ann Stat. 2001;29(4):1165–1188. |
 © 2019 The Author(s). This work is published and licensed by Dove Medical Press Limited. The
full terms of this license are available at https://www.dovepress.com/terms
and incorporate the Creative Commons Attribution
- Non Commercial (unported, 3.0) License.
By accessing the work you hereby accept the Terms. Non-commercial uses of the work are permitted
without any further permission from Dove Medical Press Limited, provided the work is properly
attributed. For permission for commercial use of this work, please see paragraphs 4.2 and 5 of our Terms.
© 2019 The Author(s). This work is published and licensed by Dove Medical Press Limited. The
full terms of this license are available at https://www.dovepress.com/terms
and incorporate the Creative Commons Attribution
- Non Commercial (unported, 3.0) License.
By accessing the work you hereby accept the Terms. Non-commercial uses of the work are permitted
without any further permission from Dove Medical Press Limited, provided the work is properly
attributed. For permission for commercial use of this work, please see paragraphs 4.2 and 5 of our Terms.