Back to Journals » Clinical Interventions in Aging » Volume 15
Behavioral Conformity of Physical Activity and Sedentary Behavior in Older Couples with One Partner Suffering from End-Stage Osteoarthritis
Authors Moellenbeck B, Kalisch T ![]() , Gosheger G, Horst F, Seeber L, Theil C
, Gosheger G, Horst F, Seeber L, Theil C ![]() , Schmidt-Braekling T, Dieckmann R
, Schmidt-Braekling T, Dieckmann R ![]()
Received 18 July 2019
Accepted for publication 11 December 2019
Published 17 January 2020 Volume 2020:15 Pages 61—74
DOI https://doi.org/10.2147/CIA.S222490
Checked for plagiarism Yes
Review by Single anonymous peer review
Peer reviewer comments 4
Editor who approved publication: Dr Richard Walker
Burkhard Moellenbeck, 1 Tobias Kalisch, 1 Georg Gosheger, 1 Frank Horst, 2 Leonie Seeber, 1 Christoph Theil, 1 Tom Schmidt-Braekling, 1 Ralf Dieckmann 1
1Department of General Orthopedics and Tumor Orthopedics, Muenster University Hospital, Muenster, Germany; 2Department of Orthopedics and Traumatology, St. Josef-Stift Sendenhorst, Sendenhorst, Germany
Correspondence: Burkhard Moellenbeck
Department of General Orthopedics and Tumor Orthopedics, Münster University Hospital, Albert-Schweitzer-Campus 1, Building A1, Münster 48149, Germany
Tel +49 251 83-45539
Fax +49 251 83-47989
Email [email protected]
Purpose: The present study investigates behavioral conformity regarding physical activity (PA) and sedentary behavior (SB) in older couples where one partner suffers from osteoarthritis (OA). Hereby the question is addressed whether and to what extent the typical physical limitations of OA patients have negative effects on their partners.
Patients and Methods: The habitual PA and SB of end-stage osteoarthritis patients (n = 32, 52– 81 years | n = 14 gonarthrosis, n = 18 coxarthrosis), their spouses (n = 32, 50– 83 years) and control couples (n = 26 subjects, 52– 78 years) were assessed by accelerometry. Besides individual results of accelerometry hourly couple-specific performance ratios were calculated for four parameters of PA (number of steps, vector magnitude (VM), metabolic rate (MET), and total time in moderate-to-vigorous PA (MVPA)) and two parameters of SB (number of sedentary bouts and total time of sedentary bouts per hour). Analyses of covariance were used to explore differences in hourly couple-specific performance ratios between couples affected by osteoarthritis and control couples.
Results: Significant differences in PA were observed between the three groups, whereby the patients showed the lowest PA and the subjects of the control group the highest PA. In contrast to this, SB did not differ between the three groups. The hourly analyses of couple-specific performance ratios revealed significant differences between the target couples (patients and spouses) and the control couples for all parameters of PA. Thereby, the deviance in PA between the patients and their spouses was always smaller than in control couples and also decreased with age. The investigation of SB, on the other hand, revealed larger deviations between the patients and their spouses as compared to control couples and no changes with age.
Conclusion: This study confirmed the known negative impact of osteoarthritis on the PA and SB of elderly patients. More important, however, was the finding that the patients’ spouses adapt to this poor health behavior and show reduced PA as well. Consequentially, spouses of OA patients should be considered as a risk group for inactivity-related diseases in old age. This should be considered in interventions that aim to use the individual support of spouses to increase the PA of OA patients.
Keywords: older couples, osteoarthritis, inactivity, synchrony, accelerometer
Introduction
Osteoarthritis (OA) involves inflammation and structural changes of the joint, causing pain, stiffness and functional disability finally leading to reduced mobility, restrictions in activities of daily living and substantial medical expenditure.1 OA of the lower extremities is among the most common forms and mostly result in joint arthroplasty. Especially due trends in increasing obesity, a large proportion of adults are expected to develop arthritis in the knee or hip during their lifetime.2,3 Physical activity (PA) is highly recommended in patients suffering from OA, as it has been found to reduce pain and improve function and is thereby directly related to the quality of life.4 Unfortunately, people with OA are often less physically active than those without and miss the recommended levels of activity for the maintenance of health.5 De Groot and colleges observed that the PA levels in end-stage OA patients were significantly reduced, regardless of whether knees or hips were affected.4 Other groups confirmed these findings, reporting about OA patients taking significantly fewer steps per day as compared to healthy controls. In general, gender, pain levels and the affected joint did hardly influence the results whereas age and BMI explained large portions of variance.4,6
The general way of life and the reduction of physically demanding professional activities in the western industrial nations have not only led to a decrease in PA but also to a significant increase in sedentary behavior (SB), which is referred to as waking behavior ≤ 1.5 metabolic equivalents while in a sitting or reclining posture.7 In this context, adults of any age accumulate on average about nine to 10 hrs of SB a day and thus expose themselves to increased health risks.8 In detail, there is a positive association between SB and the risk of type 2 diabetes mellitus, cardiovascular disease, depression and certain types of cancer.8–11 Furthermore, there is strong evidence that the health risks associated with SB are independent of physical activities, which would imply that long-term sitting cannot simply be compensated by subsequent sporting activities.12 Although research is still ongoing, it is already clear that for maintaining physical and mental health in old age not only a minimum of PA but also as little SB as possible is necessary.13,14 Hereby, OA patients represent a special risk group, as they spend a lot of time sitting due to the mostly painful limitations of OA which increases chronic co-morbidity and all-cause mortality in this population.15–17
Synchronized Behavior in Couples
Most scientific research on PA focuses only on the individual and ignores the social environment, although it is already known that close relatives strongly influence this behavior.18–20 Social learning theory suggests that people who spend a lot of time together emulate each other’s behavior.21 Especially among spouses, strong evidence has been found for the concordance of health behaviors that extends into later life.22–24 Spousal behavior was revealed as an important factor for adopting, continuing, or relapsing to different health behaviors.25 In this context, concordances have been investigated for smoking, drinking, drug intake and conditions like obesity as well as positive behaviors like dieting and exercises.26 Based on these findings, it can be assumed with a high probability that a joint lifestyle in the sense of a shared household, social contacts and leisure activities leads to the adaptation of PA and SB.19 Recent studies investigating PA in couples have demonstrated that moderate-to-vigorous PA (MVPA; moderate-intensity PA is defined as three to six metabolic equivalents and vigorous-intensity PA is defined as any activity above six metabolic equivalents. This means that MVPA is any activity over three metabolic equivalents27 and sedentary time is correlated between partners.24,28,29 This assumption becomes even more likely the longer couples live together. Longitudinal studies show that if one partner changes his behavior the spouse is more likely to exhibit similar changes in PA levels.24,30
Although some theoretical frameworks and mechanisms have been proposed through which older spouses co-produce important aging outcomes concerning cognitive functioning, well-being and health, the literature investigating factors that contribute to overall PA concordance in couples is sparse.18 In their recent work, Pauly and colleagues suggest two different underlying mechanisms that could contribute to PA concordance.20 The first mechanism is based on the abovementioned shared environments (i.e. living conditions, financial resources, etc.) that affect partners similarly.31 The second mechanism is based on reciprocal influence in beneficial or unfavorable ways.32 While the first scenario can be modified easily in the context of couple-based psychosocial interventions by changing the external influences, the second scenario is more robust and has to deal with complex relation dynamics.33
Although there are a number of studies on the PA of OA patients, possible behavioral interactions with their spouses have not yet been sufficiently investigated. Martire and colleagues investigated four types of spousal influence (i.e. the spouses’ daily activity, autonomy support, pressure and persuasion) on the daily PA of patients living with knee OA. They found that the spouses’ autonomy support for PA, as well as their own level of activity, was concurrently associated with patients’ greater daily MVPA and steps. The authors concluded from their results that the PA of OA patients could best be increased by involving both partners in a couple-oriented intervention.34 In principle, we agree with the assumption that there might be a positive link between the physical performance of OA patients and spouses, but the question is how this linkage might change in old age and during long-term OA.34 Therefore, our basic hypothesis is that the reduced activity level of OA patients has a negative impact on their spouses, who may have adapted to low PA and high SB during the course of the disease.
Current Study
The purpose of the current study was to examine the PA and SB of couples with one partner suffering from end-stage OA (arthroplasty scheduled) as well as the PA and SB of control couples. We aimed to expand the existing knowledge about the habitual PA of patients and their partners by applying multi-day (four to 7 days) accelerometry with a high temporal resolution and analyzing hourly data obtained under everyday life conditions.35 PA has been shown to vary by time of day with higher levels in the afternoon/evening and on the weekend.36 Consequently, we have performed an additional analysis for this time period (hereinafter referred to as “typical leisure time”) to avoid a floor effect due to the inherently low activity among older OA patients.37
There is a high interest in the exact determination of the PA and SB in OA patients, which should be realized by objective methods. Sole reliance on self-reports is problematic because of poor reliability and validity of many used instruments which was already confirmed in OA patients.38 PA monitoring by means of accelerometers, on the contrary, is currently viewed as the most accurate objective approach and represents a feasible alternative to self-reports.39 As these small and light-weight devices hardly restrict the subjects’ mobility and show good psychometric properties, they can be used to assess a wide range of parameters associated with the frequency, intensity and duration of PA.40
Materials and Methods
Subjects
All procedures of this cross-sectional, exploratory study were reviewed and approved by the local ethics committee and registered in a clinical trial register (German Clinical Trials Register: DRKS00014292). 64 patients were recruited in the two orthopaedic departments involved in the study (located in Muenster/Sendenhorst, NRW, Germany). The criteria for inclusion were end-stage hip or knee OA, age between 50 and 85 years and sufficient language skills in German or English to understand the objectives and requirements of the study. Exclusion criteria were defined as any non-orthopaedic condition (e.g. rheumatic, musculoskeletal, cardiovascular, neurologic, etc.) significantly limiting PA or causing increased SB in everyday life.
On average the included patients were suffering from OA for at least 7.2 ± 6.2 years (first medical examination for complaints with the knee or hip). As they were not satisfied with the previous results of conventional therapy in terms of pain relief and mobility, they visited one of the hospitals on the advice of their physician in order to be consulted about an arthroplasty. Based on the independent assessment of the clinical orthopedist in charge, all of them met the clinical criteria for end-stage hip or knee OA. After the medical examination, eligible patients and their spouses were informed about the possibility of participating in the study and received detailed oral and written information. If the relatives were not present at this time, a telephone call was arranged. Only after both spouses had agreed to participate in the study, the dates for the data collection (i.e. accelerometry and questionnaires) were arranged. Prior to participation, all subjects were again instructed and provided written consent.
26 control group participants of the same age range could be recruited in the regional environment of the hospitals involved in the study through advertisements or word of mouth. The exclusion criteria of this group included any current diseases, surgical treatments (especially of the knee and hip joints) or medication that would have restricted PA or forced SB under everyday conditions. Throughout this manuscript, we refer to long-time partners, who live in the same household as the patient (or control) on a permanent basis, as “spouses”.
Measuring Physical Behavior with Wearable Accelerometers
Intensity of movement and times in seated positions are best assessed by accelerometers thereby avoiding self-report biases concerning frequency, intensity and duration of activities.41 Accordingly, primary outcome of interest was data, measured by tri-axial ActiGraph® wGTX3-BT (Firmware 1.9.2) activity monitors (ActiGraph LLC, Fort Walton Beach, FL, USA). To ensure valid and reliable measurements we followed recent recommendations from sports and movement science.40,42 All subjects were provided with detailed verbal and written instructions concerning accelerometry. The devices had to be worn on the waist and close to the body’s center of mass using elastic belts.43 The minimum wear time was set to 10 hrs per day for at least 4 days (monitor settings: 100 Hz sampling frequency, normal filter settings, 60 s epoch length). The subjects were instructed to remove the activity monitor only for water-based activities such as bathing and swimming. The devices had to be worn by spouses simultaneously. Subjects were telephoned prior to the measurements to ensure compliance. The accelerometers were initialized as per the manufacturer’s manual, specifying the following parameters of the patients: date of birth, height, weight, gender, dominant side and position of the monitor. Data from the monitors were downloaded using the ActiLife Software (v 6.13.3). Individual non-wear times were excluded from all analyses by means of the wear/nonwear time classification algorithms for triaxial accelerometers by Choi et al44 The night hours (here: 11:01 p.m. – 05:59 a.m.) were always excluded from the data acquisition by default. The amount of activity was indicated by Actigraph specific counts, which were averaged over time and reported as counts per minute (cpm). The analyses of the subjects’ PA were based on the following parameters: Number of steps, vector magnitude (VM, i.e the resulting vector that forms when combining the sampled acceleration from the superior-inferior, anterior-posterior and medial-lateral planes of motion), metabolic rate (MET i.e. metabolic equivalent of task with 1 MET defined as the resting metabolic rate obtained during quiet sitting27), and total time in moderate-to-vigorous PA (MVPA). The cut-points were set according to generally accepted limits for PA (i.e. sedentary (0–99 cpm), light (100–1951 cpm), moderate (1952–5724 cpm), vigorous (5725–9498 cpm)).45 The analysis of SB was based on the parameters number of sedentary bouts (defined as a period of consecutive minutes where the accelerometer registers <100 cpm) and total time of sedentary bouts occurring on an investigated hour. Because the age-range of the subject population participating in this study is located in late adulthood and includes the transition into professional retirement, PA and SB analyses were not only carried out for the whole waking hours (defined as 06:00 a.m. – 11:00 p.m.) but also separately for the leisure time (defined as 04:00 – 11:00 p.m.).
This second investigation period also makes sense because, based on the information derived from face-to-face interviews and daily logs, the housework was carried out predominantly by women. The majority of male subjects indicated that they only occasionally helped with the housework.
Statistical Analyses
All subject data were pseudonymized. If not stated differently, all analyses were performed using the SPSS Statistics software (v 24; SPSS Inc, Chicago, IL, USA) with the significance level set at α = 0.05. Results were presented as marginal means (M) ± standard error of means (SEM). Data analysis was performed in a two-step process. First, the behavioral data of OA patients, patients’ spouses and controls were compared (3 groups). Afterwards, hourly couple-specific performance deviations have been calculated for the couples with patient participation as well as the control couples (2 groups).
Analyses of covariance (adjusting for the possible confounders age and gender) were used to examine differences between the three groups (1x2 ANCOVA with one factor (couple) and gender and age as covariates). The subsequent pairwise comparisons were calculated in the same way and corrected for multiple tests according to the Bonferroni-Holm method.
For every couple (i.e. patients and spouses / control couples) the deviations (Δ) in PA were calculated on hourly basis (averaged over all recorded days) and reported as absolute values (i.e. “performance ratios”). The deviations (Δ) in SB were reported accordingly. Differences in performance ratios between the two groups of couples were subsequently investigated by means of analyses of covariance (ANCOVA). In case of existing baseline difference for variables related to PA behavior between the two spouses of each of the two groups, the relevant variable was considered as covariate in the model. Results were presented as adjusted means ± 95% confidence interval (CI). Additionally, correlation analyses (Spearman’s rank) were calculated to evaluate the coherence of performance ratios and age for the patients and their spouses as well as for control couples. Increased type I error resulting from multiple statistical comparisons was generally adjusted by Bonferroni-Holm correction using the open-source program “Bonferroni Calculator software” (Python 3.7 for Mac OS).46
Results
Of all participants who were selected for the study, 90 (N = 32 OA patients, N = 32 patients’ spouses, N = 26 controls) provided data (Figure 1). If not stated differently, the subsequent analyses were based on the complete sample.
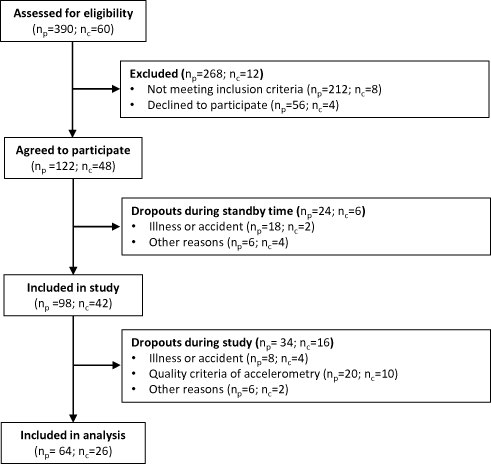 |
Figure 1 Flow chart of subjects identified and screened for inclusion in the study.Abbreviations: nP, number of subjects in the target group (i.e. patients and their spouses), nC, number of subjects in the control group (i.e. control couples). The eligibility for study participation was assessed at the couple level. If one partner was ineligible, both subjects had to be excluded. |
The demographic characteristics of the participants are reported in Table 1. Severity of OA was quantified in patients suffering from gonarthrosis (N=14) and coxarthrosis (N=18) by means of the according to Lequesne indices (LI) and revealed no significant differences between these subgroups (LI knee: 11.9 ± 3.0; LI hip: 9.8 ± 2.8; unpaired samples t-test: p = 0.054).47 All procedures were carried out approx. 4.3 ± 1.0 months before arthroplasty.
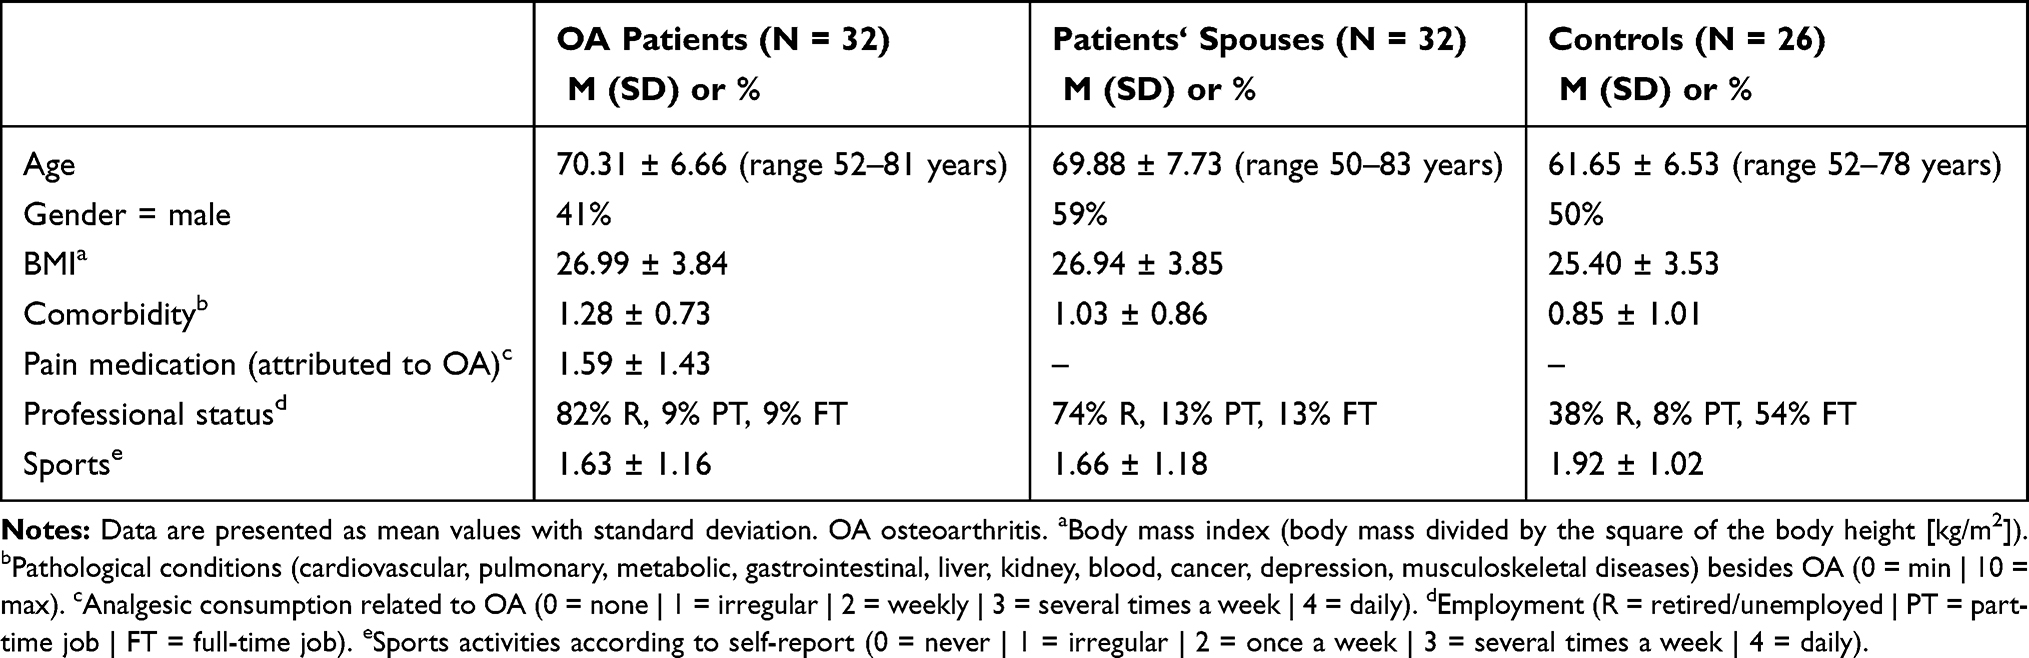 |
Table 1 Demographic Characteristics of Patients, Spouses and Controls (N = 90) |
Subjects of the target group (patients and spouses) wore the monitors for an average of 5.94 ± 0.76 days (thereof 1.97 ± 0.59 weekend days) and subjects of the control group 4.62 ± 0.65 days (thereof 0.92 ± 0.76 weekend days).
Group-Related Performance
In order to compare the PA of the study participants with the data of other studies already carried out, daily mean values of the parameter number of steps were calculated first. Accordingly, the OA patients walked approx. 5484 ± 2313 steps, their spouses walked approx. 6739 ± 2277 steps and the members of the control group walked approx. 9298 ± 3490 per day.
In all four parameters referring to PA a significant main effect between the three groups of subjects was found for the waking hours (F(2,85) ≥ 4.852, p ≤ 0.010). For the two parameters referring to SB, no significant differences between the three groups could be found during the same period (F(2,85) ≤ 1.320, p ≥ 0.273). PA and SB data of OA patients, their spouses and controls are listed in Table 2.
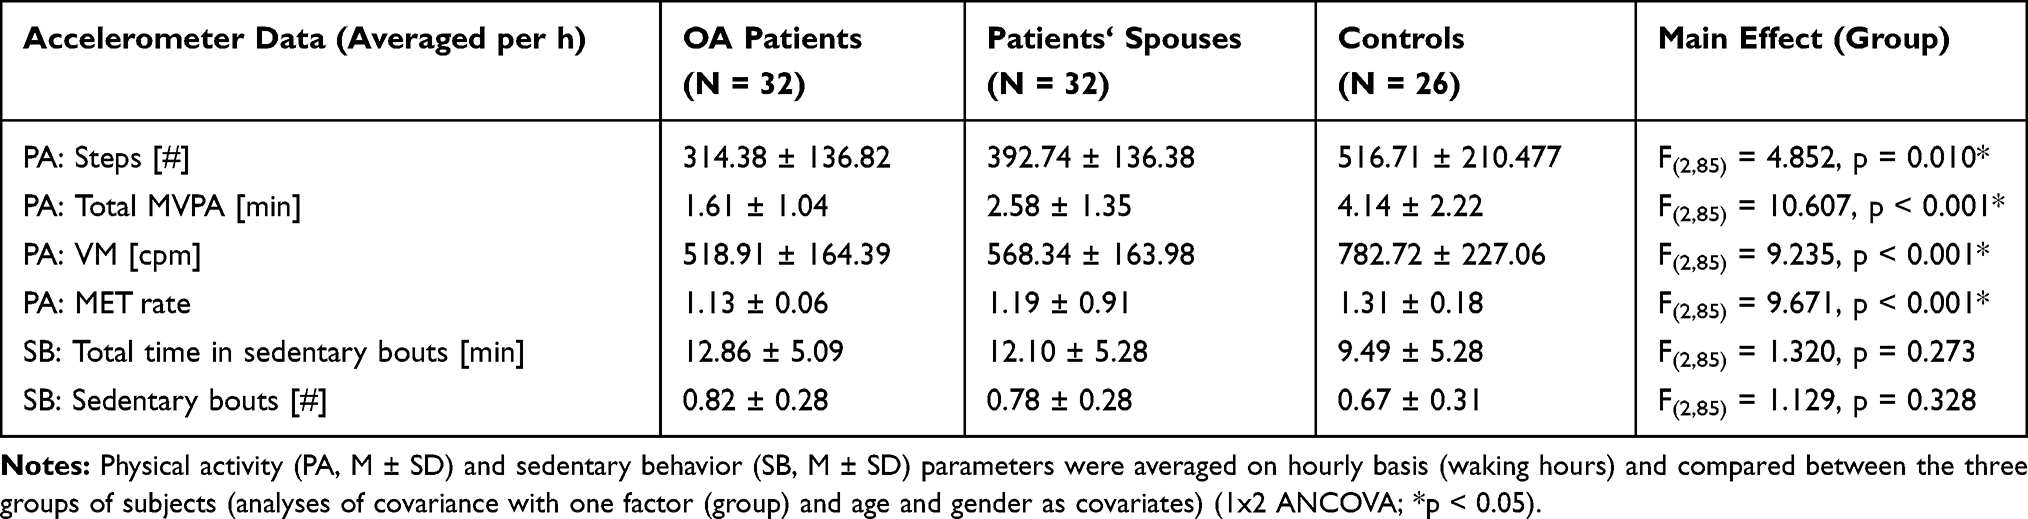 |
Table 2 Group-Specific Accelerometer Data |
The subsequent analyses of PA parameters between the subjects of the three groups were conducted separately for the data collected during the waking hours (6:00 a.m. – 11:00 p.m.) and leisure time (04:00–11:00 p.m.). There was no significant difference in average hourly performance regarding the number of steps taken by patients, the patients’ spouses and controls (p ≥ 0.105). In contrast to this, there were significant differences in average hourly performance between patients and controls found for MVPA, VM and MET rate during waking hours (p ≤ 0.01; p ≤ 0.06; p ≤ 0.034) and leisure time (p ≤ 0.048; p ≤ 0.08; p ≤ 0.040). Irrespective of the parameter studied and the group of subjects, it was consistently found that the average hourly performances during the entire waking hours were always above those during leisure time (Figure 2).
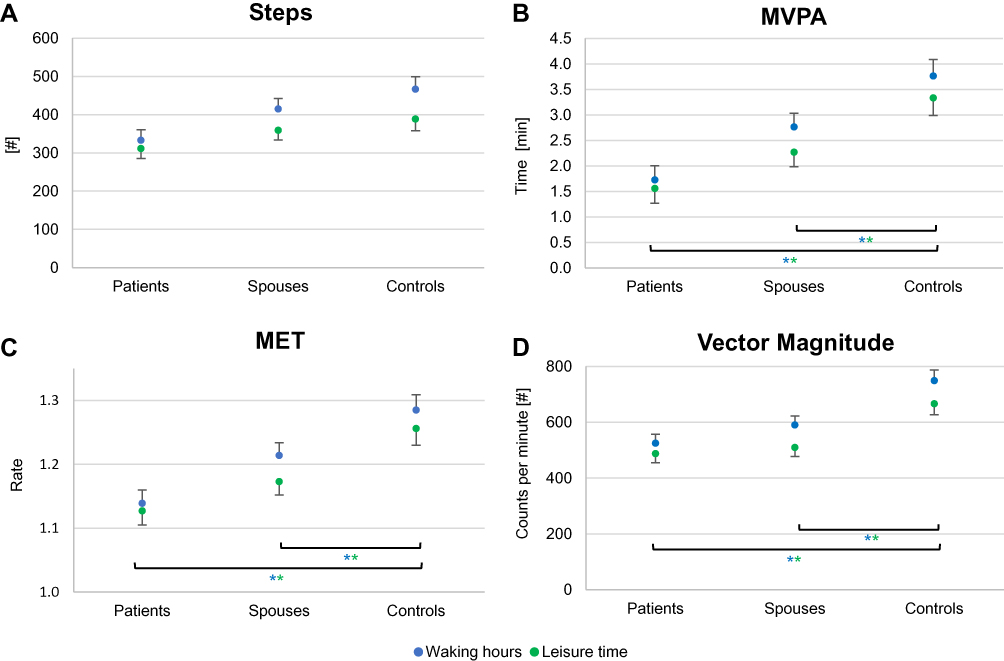 |
Figure 2 Differences in PA accelerometer data between subject groups. Four physical activity (PA) parameters were assessed in patients, their spouses and controls (A Number of steps; B Time in MVPA; C MET rate; D Vector magnitude). Pair-wise comparisons of hourly averages were calculated for these parameters by means of analyses of covariance (1x2 ANCOVA with one factor (couple) and age and gender as covariates). Results are presented as marginal means ± SEM for average waking hours (blue points) as well as average leisure time (green points). A p < 0.05 (*In the corresponding coloring) was considered significant after correction for multiple testing (Bonferroni-Holm). For reasons of clarity, the SEM was only displayed positively in the upper graph and negatively in the lower graph. |
In analogy to the investigation of the PA parameters, we also examined the average hourly leisure time for the duration of SB in addition to the average waking hours. No differences were found between the three groups (p ≥ 0.792). For both SB parameters and all three groups, the average duration of sitting activities was always higher in the leisure time than in the waking hours (Figure 3).
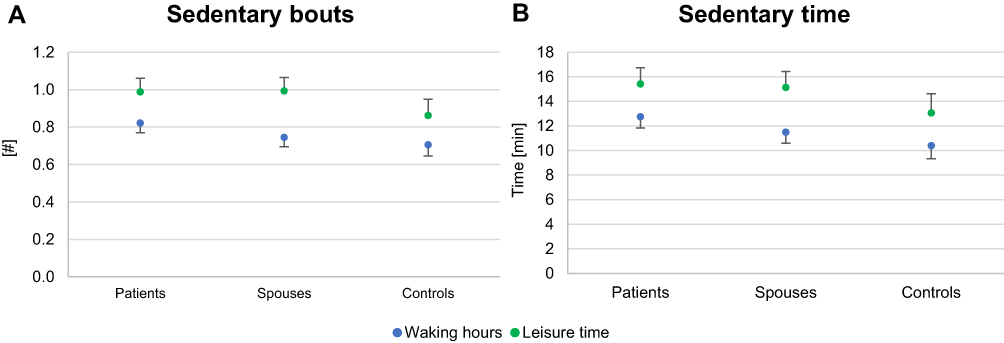 |
Figure 3 Differences in SB accelerometer data between subject groups. Two sedentary behavior (SB) parameters were assessed in patients, their spouses and controls. Pair-wise comparisons of hourly averages were calculated for these parameters by means of analyses of covariance (1x2 ANCOVA with one factor (couple) and age and gender as covariates). Results are presented as marginal means ± SEM for average waking hours (blue points) as well as average leisure time (green points). After correction for multiple testing (Bonferroni-Holm) no significant differences between the groups could be found for the number of sedentary bouts (A) or the total time in sedentary bouts (B). For reasons of clarity, the SEM was only displayed positively in the upper graph and negatively in the lower graph. |
Couple-Specific Deviation in Hourly Performance Ratios
The age of spouses revealed a strong correlation within both groups of couples (r ≥ 0.924; p < 0.001). The BMI, on the other hand, was only significantly correlated for patients and their spouses (r = 0.482; p = 0.005) but not for the couples of the control group (r = 0.398; p = 0.178). We, therefore, controlled for the couple-specific difference in BMI (1x1 ANCOVA controlled for Δ BMI). All calculations were based on hourly averages for waking hours (6:00 a.m. – 11:00 p.m.) and leisure time (04:00 – 11:00 p.m.).
PA: Number of Steps
The couple-specific deviations in hourly performance (Δ steps) of patients and their spouses (249.30 ± 106.87 steps) were compared according to the deviations in control couples (349.26 ± 115.95 steps) and revealed significant differences for the waking hours (F(1,42) = 8.251, p = 0.006). In line with these findings, the analysis of average leisure time showed significant differences in the performance ratios between patients and their spouses (193.56 ± 87.27 steps) and control couples (305.42 ± 98.89 steps) (F(1,42) = 13.798, p = 0.001) (Figure 4).
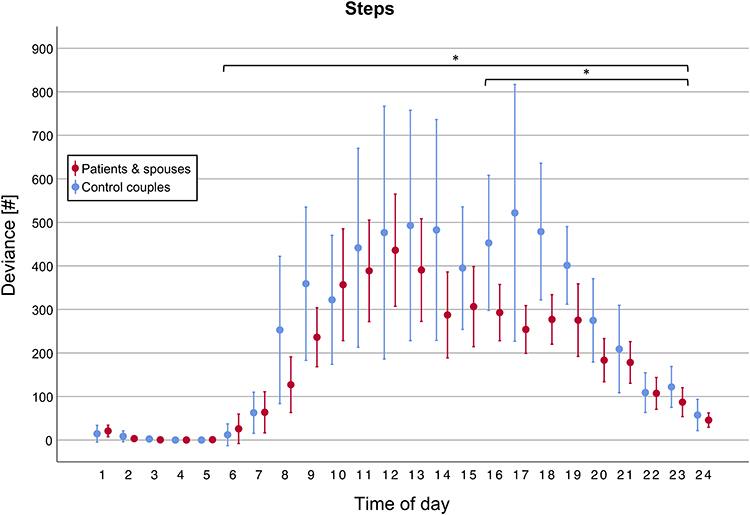 |
Figure 4 Daytime dependency of couple-specific PA performance ratios: Number of steps. The average deviation (MW, 95% CI) in number of steps per hour is displayed for couples of the target group (i.e. patients and spouses, red) as well as for couples of the control group (i.e. couples, blue). There was a significant difference (*) between the data of both groups for the waking hours (6:00 a.m. – 11:00 p.m.; p = 0.006) as well as leisure time (04:00 – 11:00 p.m.; p = 0.001). |
The exemplarily presented results for the number of steps were confirmed for the remaining three PA parameters by means of subsequent analysis. Here the couple-specific deviations showed significant differences between both groups in both investigated time periods as well, whereof the differences between patient and spouse were always lower than those within the control group (Table 3). In general, the deviations between the partners were smallest in the morning and evening hours, whereas they were greatest at noon and especially in the late afternoon.
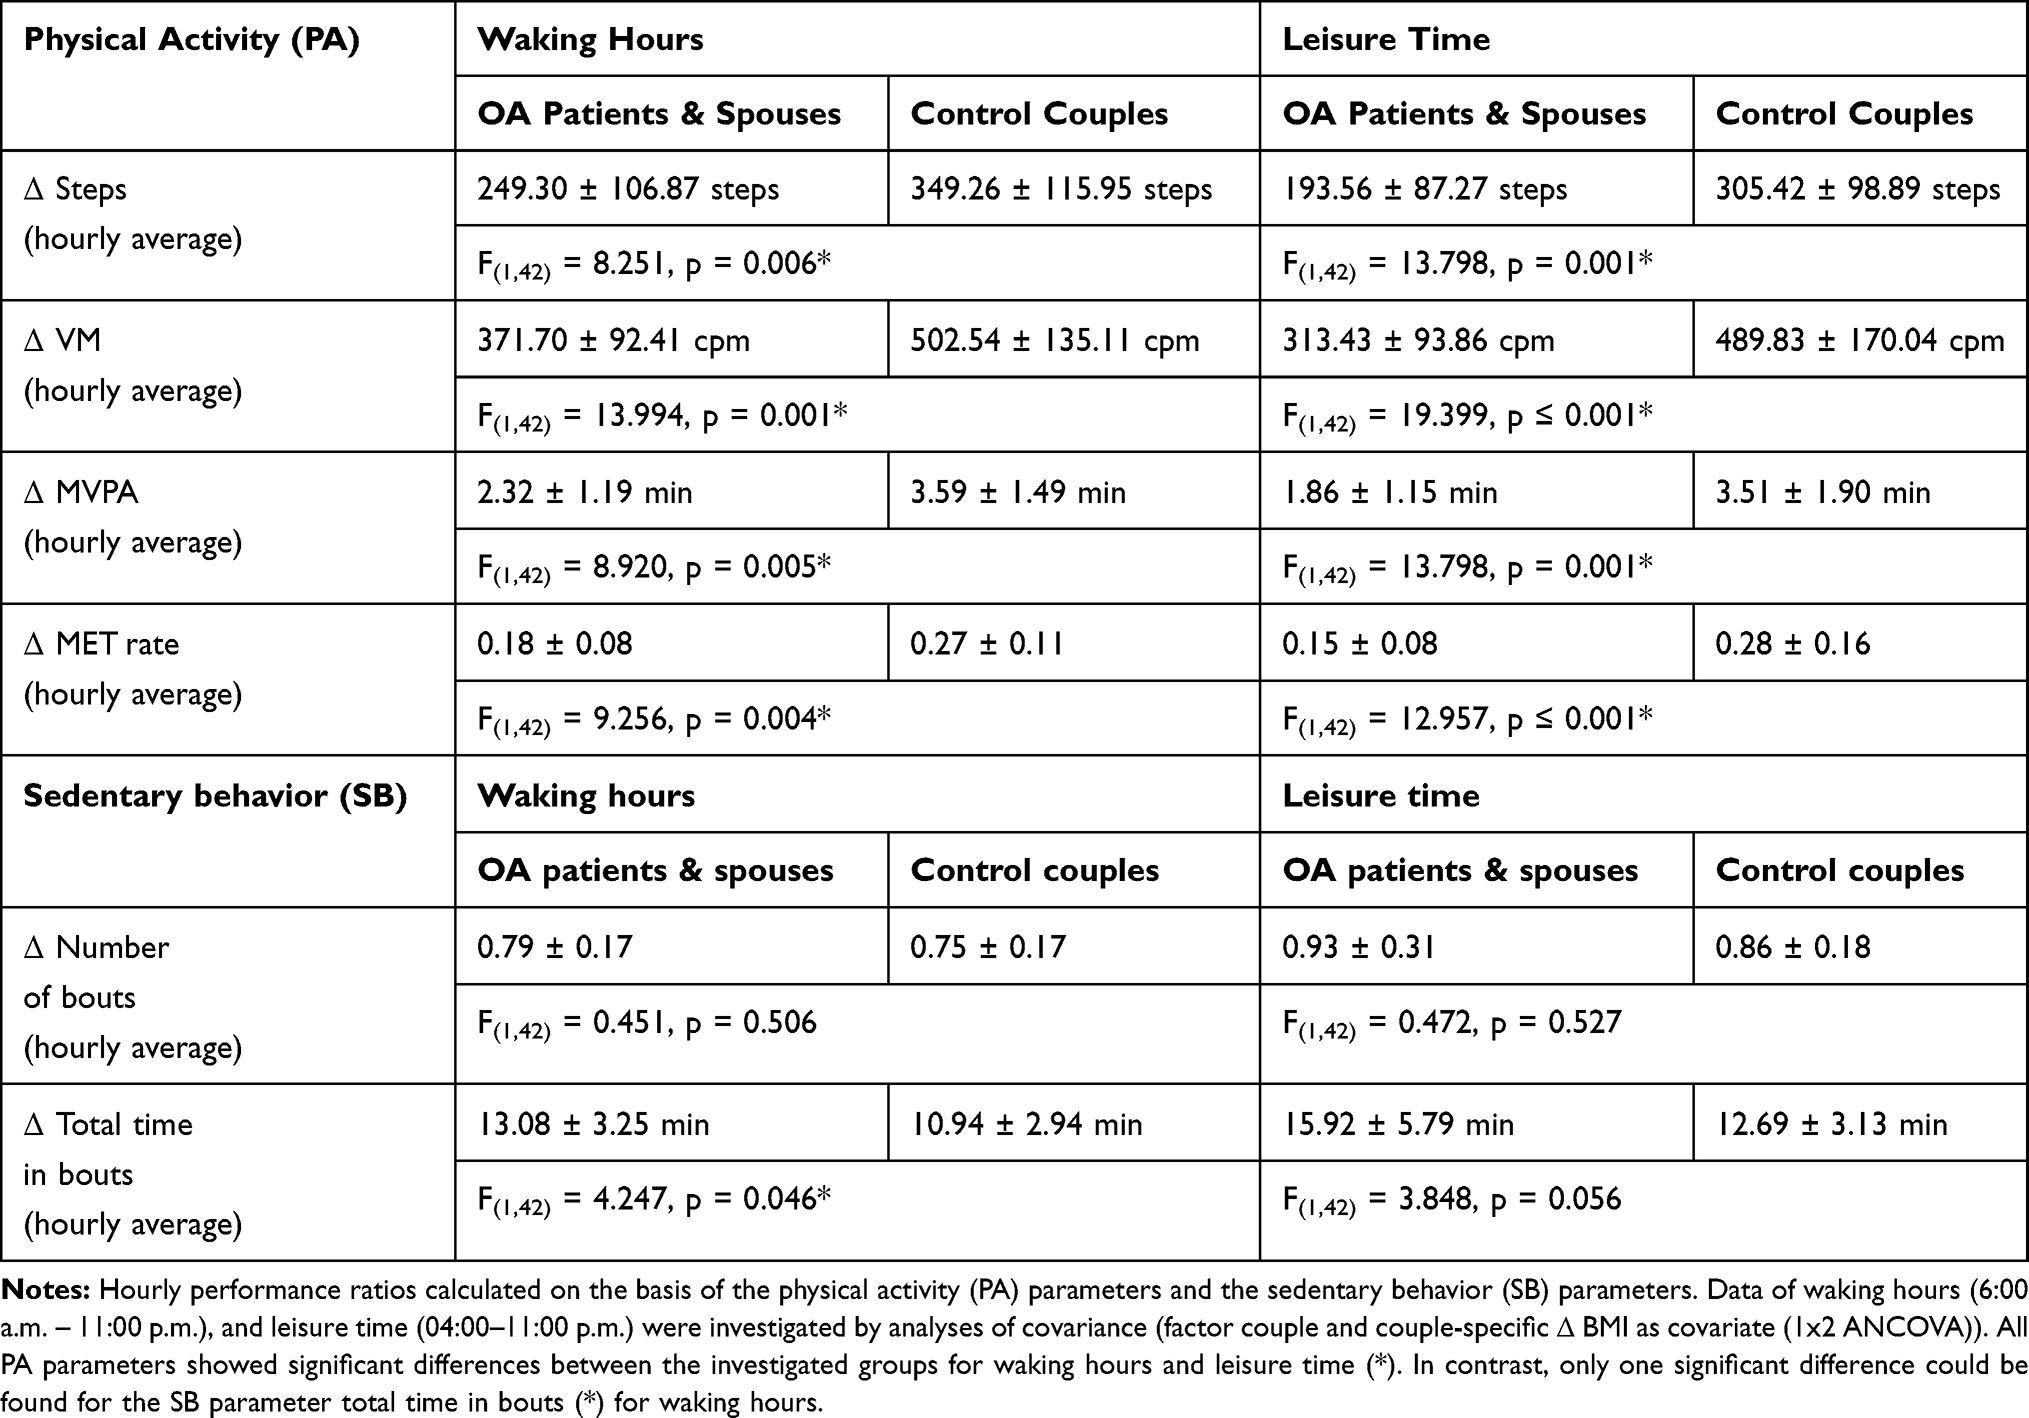 |
Table 3 Daytime Dependency of Couple-Specific Performance Ratios in PA and SB |
SB: Total Time in Sedentary Bouts
The couple-specific hourly deviations of sedentary bouts (Δ total time) of patients and their spouses (13.08 ± 3.25 min/h) were compared according to the respective deviations in control couples (10.94 ± 2.94 min/h) and revealed significant differences for the waking hours (F(1,42) = 4.247, p = 0.046). The subsequent analysis of average leisure time showed no significant differences in the performance ratios between patients and their spouses (15.92 ± 5.79 min/h) and control couples (12.69 ± 3.13 min/h) (F(1,42) = 3.848, p = 0.056) (Figure 5). In principle, the deviations in sitting time between the partners increased linearly from the morning hours until the early afternoon, and then remained at a high level. The deviations between the spouses in the target group were higher in almost all recorded daily hours than compared to those recorded in the control group.
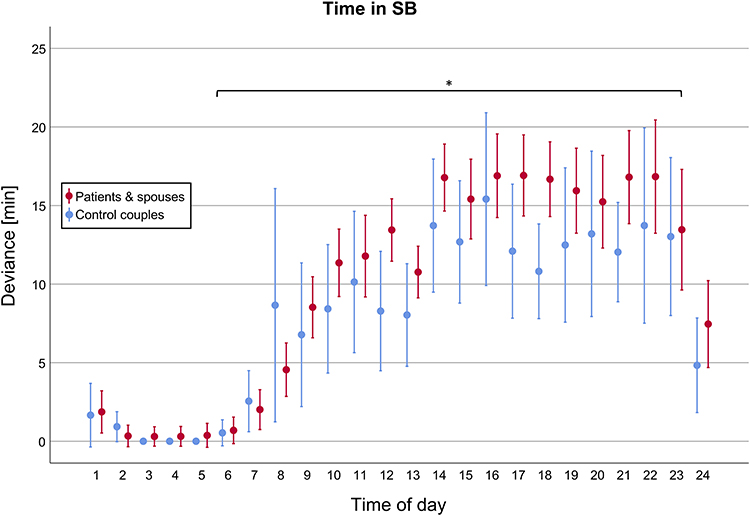 |
Figure 5 Daytime dependency of couple-specific SB performance ratios: Total time in sedentary bouts. The average deviation (MW, 95% CI) of total time in sedentary bout is displayed for couples of the target group (i.e. patients and spouses, red) as well as for couples of the control group (i.e. couples, blue). There was a significant difference (*) between both groups for the waking hours (6:00 a.m. – 11:00 p.m.; p = 0.046) that could not be shown separately for leisure time (04:00 – 11:00 p.m.; p = 0.056). |
The presented results for the SB parameter total time in sedentary bouts were subsequently confirmed for the second parameter number of sedentary bouts (Table 3). Also, for this parameter, the hourly deviances between patients and spouses were higher than those recorded within the control group.
Age-Dependency of Couple-Specific Performance Ratios
The average daily deviations (Δ) in PA and SB parameters were calculated per couple. Correlation analyses (Spearman rank correlation) revealed a significant age-related decrease (the average age of each couple was used) for three PA parameters (Δ number of steps, Δ MET rate and Δ total time in MVPA, p ≤ 0.023) in data of patients and their spouses. Only Δ VM and both parameters of SB (Δ number of sedentary bouts, Δ total time in sedentary bouts) showed no significant changes with increasing age of the couples of the target group (p ≥ 0.156). The same analyses were conducted for data of the control couples. No average daily deviation (Δ) of a PA parameter (p ≥ 0.109) or an SB parameter (p ≥ 0.558) showed a significant change with the increasing age of the subjects. In general, there was a trend for couple-specific performance ratios of all PA parameters to decline with age, which reaches significant levels only in data of the patients and their spouses. The performance ratios of SB parameters, on the other hand, showed no trend for any age-specific change (Table 4).
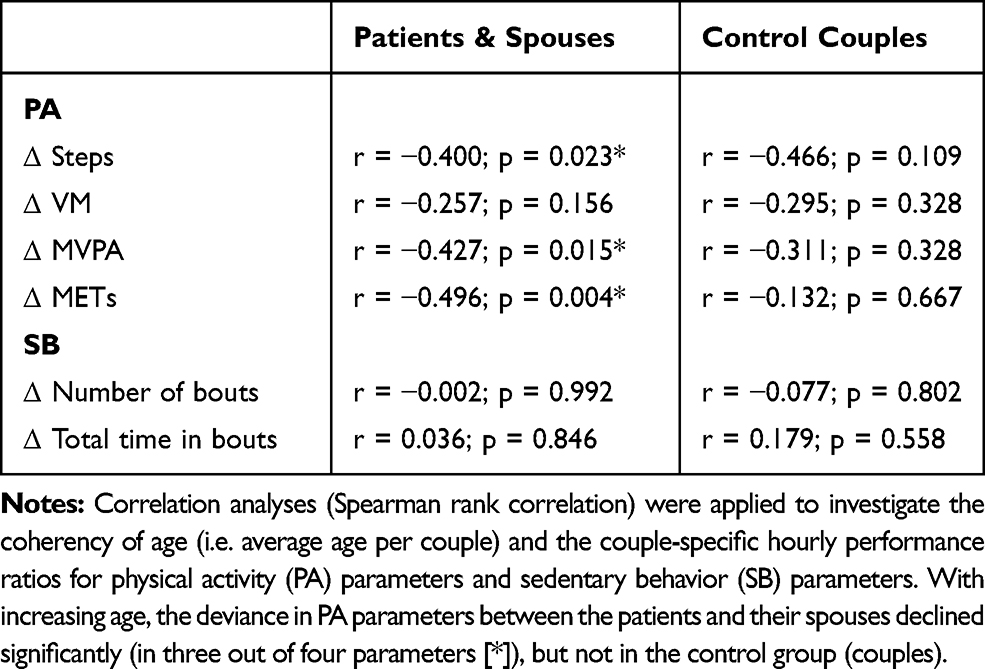 |
Table 4 Age-Dependency of Performance Ratios in Couples |
Discussion
Close relationships are likely to have an impact on adults’ levels of PA.20 Therefore, the aim of our study was to objectively assess habitual PA and SB in couples consisting of end-stage (pre-arthroplasty) OA patients and their spouses as well as in control couples. In addition to the individual levels of performance, which largely depend on age and BMI,48 we focused on the deviance between the spouses (i.e. performance ratio) to get an impression of how similar their everyday behavior is.
On the basis of the hourly analyses, it was found that the pair-specific deviations in the investigated parameters showed different temporal courses over the day. While the PA parameters showed the highest deviations in the middle of the day, the SB parameters showed the highest deviations at the end of the day. Basically, we found smaller deviations of PA parameters between patients and their spouses compared to control couples, which suggests that the movement behavior within these pairs has synchronized. This behavioral alignment was even intensified with increasing age of the couples. Regarding the SB parameters, however, no increased alignment in the behavior of patients and spouses could be observed.
PA Levels in Patients and Their Spouses
At the pathological level, end-stage OA is relatively consistent across geographic and demographic groups, with pain as the most common factor influencing PA.49,50 Recent research results have shown that national variations in low PA levels among patients with OA cannot be explained exclusively by disease-specific factors, but that social, environmental and other contextual factors have to be also taken into account.37
Tudor-Locke et al translated common health-recommendations in addition to typical daily background activities (approx. 5.000 steps/day) in healthy older adults into 7.000–10.000 steps/day necessary to preserve health in this population.51 The OA patients, participating in our study, clearly missed these recommendations (5.484 ± 2.313 steps/day), as well as their spouses (6.739 ± 2.277 steps/day). Against the background of the existing literature, the patients of the present study show a typical behavior that ranges between already documented values (approx. 4.330–7.750 steps/day).15,34,52 Subjects, who served as controls in our study, fulfilled these minimum requirements and reached a sufficient number of steps on average (9.298 ± 3.490 steps/day). Differences in PA between the three groups of our study were quantified by four separate accelerometric parameters. Although a general performance gradation (patients < spouses < controls) was visible in all of these parameters, we found no significant differences between the individual groups after statistically correcting for multiple testing. The remaining three parameters showed significant differences between patients and controls, as well as between the patients’ spouses and controls. However, no differences could be observed between the performance of patients and their spouses. These results confirmed our basic hypothesis that spouses might adapt to the low level of activity of patients.
Although the number of steps together with time in MVPA are among the most frequently studied parameters in the OA population,34 the analysis of other parameters can obviously provide further insights. The automatic recognition of step patterns in the OA population may not always work optimally. Nevertheless, step counts are a good marker for specific recommendations to maintain health.51
The separate investigation of leisure time was conducted in our study for several reasons. Firstly, to compensate for the imbalance between the target and control couples in terms of employment status and thereby gain insight into their habitual behavior. From our point of view, it is not easy to achieve a balance with regard to occupational activity between groups in general, since it is also necessary to differentiate between jobs that demand different levels of PA. In this context, Abdallah et al recently showed that even in young adults there is a significant connection between serious illness and the extent of PA at the workplace. They demonstrated that individuals with low physically active occupations are more prone to develop a stroke as compared to workers who have a moderate amount of PA in their jobs.53 The second reason for this separate time window was the gender-specific imbalance with regard to housework and shopping, which was very often reported in the personal conversations about typical daily routines. It is known that even in addition to their occupation, females however engage in domestic activities more regularly.54 According to the subjects included in this study, this work also took place predominantly in the first half of the day. In contrast to our expectations, we finally found lower hourly activity levels for leisure time in all three groups than compared to the hourly daily average. Especially regarding the control group with a comparatively high proportion of employed persons, this finding was remarkable and confirms the general trend towards an inactive lifestyle.
SB in Patients and Their Spouses
Physical inactivity is a lifestyle-related risk factor for the major noncommunicable chronic diseases such as cardiovascular disease, diabetes mellitus, cancer, depression, obesity, hypertension and osteoporosis.17 Additionally, it accelerates disease progression in OA patients. For young people, it was shown that SB seems to be a matter of getting used to and may track into adulthood.55 Most adults do not obtain the recommended amount of activity and the prevalence of those meeting the recommendations decreases with age, which results in increased mortality.56,57 In order to gain an insight into the extent of typical inactivity of OA patients and spouses during the day, the number of (completed) sedentary bouts was assessed. Additionally, the total time spent sedentary was also measured. Surprisingly, there were no significant differences between the three groups for either parameter. These results indicate that the patients’ spouses and controls spend a comparatively large amount of time sitting without any specific health restriction. For the patients, a high proportion of SB and sedentary time were to be expected, as painful movements and strain on the damaged joint can be avoided in this way. Considering the comparatively low pain medication consumption of the end-stage OA patients in our study (mostly irregular to weekly intake) the extent of their inactivity is plausible. An inversely proportional relationship between the consumption of analgesics and PA in OA patients could be assumed. On the other hand, absence of pain does not automatically guarantee sufficient PA. In this context, patients with end-stage OA should discuss with their doctor whether a (drug-assisted) mobilization is nevertheless advisable in order to increase PA before the pending arthroplasty in order to improve the outcome and the effectiveness of postoperative rehabilitation. The relatively high proportion of sedentary time in the control group can partially be explained by a distinct higher level of professional activity in this group. Professional activities in industrial countries are typically associated with an extremely high proportion of sedentary activities.8
Sliepen and co-workers proved in a recent accelerometry study in German knee OA patients the independence of PA and SB. Their male patients climbed more stairs and slopes and performed better in functional tests but were also more sedentary compared to women.52 The data of our study confirm their findings that PA and SB are two distinct dimensions that should be assessed separately to get a comprehensive overview of activity-related health risks in specific populations.58 We were surprised to see that the spouses’ and controls’ time spent sitting could hardly be distinguished from the data of the patients. This result even persisted if only the leisure time was examined, which in turn illustrates the general trend towards a lifestyle with a high proportion of SB especially in older elderly.59
Spousal PA and SB Behavior
Couples as social unity have already been identified as intervening points for PA promotion years ago.60 A special focus of research was placed on the influence of one partner’s health behavior change on the likelihood of the other partner making positive changes to the same health behavior.30 Although a number of studies reported results in this context, only a few studies examined the situation where partners suddenly (due to certain triggering circumstances) change to a healthier lifestyle in contrast to consistently healthy living partners.24,25,30 Furthermore, investigations on special health conditions, like coronary heart disease, have been conducted in couples, as shared environment may put partners at increased risk for certain diseases.61 Recently, an evaluation of hourly accelerometric data from two large cohorts of healthy German couples (18–87 years) showed a strong correlation between PA and SB. This pair-related synchronicity was higher in the morning and afternoon hours, more pronounced at weekends, and generally dependent on time spent together, the relationship duration, and emotional closeness between partners.20 Another group examined OA patients’ PA depending on the activity and support of their spouses. They found that the spouses’ autonomy support (for patient PA), as well as their own level of activity, was concurrently associated with patients’ greater MVPA and steps. On the other hand, they were able to show that exerting pressure on patients might lead to paradox effects as the patients react with reduced activity.34
The controlled study presented here generally confirms the high degree of couple-specific behavioral conformity in PA and SB parameters in a cohort of OA patients. For all PA parameters, a significant difference in performance-ratios between the target group (patients and spouses) and the control couples could be demonstrated. With reference to the couples of the target group, the hourly deviances were always lower than those of the control couples, which was all the more evident in leisure time. For both groups, smaller deviations in the morning and evening hours could be shown, which is in agreement with the above-mentioned research results. Finally, it could be observed that the described coherences in PA between the patients and their spouses even increase with age, which was not the case for the couples of the control group. Therefore, there is a high probability that it could be a development related to the patients’ disease. Exactly this finding gives the first indication that the role as “informal helper of the OA patient” might not be easily fulfilled by the relatives in old age, as they themselves are at high risk of developing inactivity-related diseases. Regarding the couple-specific deviations of the two investigated SB parameters, the results were different than previously described for PA parameters. The average hourly deviances of the total time in SB were higher in the target group than in the control couples. This might be explained by the fact that end-stage OA patients are regularly forced to rest in a seated position and relieve the affected joint. The comparatively irregular use of pain medication in the group of patients supports this assumption.62 In contrast, no significant differences between the couples could be observed concerning the number of completed SB bouts. This finding could not be reproduced based on the second SB parameter (number of SB bouts), which may be due to the fact that a bout (i.e. 10 mins) is too rough a measure in relation to the hourly evaluation of our study. For this type of evaluation, it may also be necessary to adjust the tolerances for stopping the bout count (here exceeding 99 cpm).
In summary, our results show that the spouses of OA patients generally adapt to the poor PA level of their diseased partners. This development increases with age. Although the cumulative duration of sitting spouses does not differ much from that of patients, there are increased deviations on an hourly basis. This result can be evaluated positively, since the patients interrupt the sitting activities obviously more frequently and pursue in the meantime other activities with increased energy consumption. The results also confirm the need to assess both, PA and SB, to get a comprehensive overview of the spousal habitual coherency.
This study has some limitations that should be acknowledged. First, radiographic imaging was not available for a large number of the OA patients, which resulted in the inability to grade the structural degeneration of the joint using common radiographic scales. Nevertheless, a previously published review found that PA does not differ in knee OA patients with mild to severe symptoms.15 The analyses presented here are based on relatively small patient and control samples which of course could have reduced the likelihood of detecting a true effect.63 In addition, differences (in particular the extent of professional activity) between the target and control group had to be statistically controlled. This discrepancy was compensated, on the one hand, by data acquisition on weekends (at least one of the 4–7 days was a weekend day) and, on the other hand, by time-of-day-dependent analyses, in which the typical period of leisure time was examined separately. Furthermore, some limitations that can occur while examining PA with accelerometers should also be recognized. Not all types of physical activities could be recorded (i.e. water-based activities, cycling, climbing stairs), which could have led to errors, especially in couple-specific analyses applied in our study. Finally, the subjects might have adjusted their behavior as a response to wearing an accelerometer, although this effect is suggested to last only briefly in general.64
Conclusion
Severe osteoarthritis affects the PA of affected patients and leads to a sedentary lifestyle in the long term. In our study, we were able to provide evidence that patients’ spouses are highly likely to be affected by this development as they seem to adapt to the reduced level of PA and spend more time sedentary.
On the one hand, this investigation was of epidemiological interest, as spouses of OA patients seem to represent a so far unknown risk group for inactivity-related diseases. The presented behavioral adaptation highlights the need to provide medical consultation to spouses and family members of OA patients. To this purpose, they should be actively involved in therapeutic programs whether they are before or after arthroplasty.
Ethics Statement
Informed consent was obtained from all individual participants included in the study. All procedures were conducted in accordance with the ethical standards of the responsible committee on human experimentation (Ethik-Kommission der Ärztekammer Westfalen-Lippe und der Westfälischen Wilhelms-Universität Münster) and with the Helsinki Declaration.
Author contributions
All authors contributed to data analysis, drafting or revising the article, gave final approval of the version to be published, and agree to be accountable for all aspects of the work.
Disclosure
Dr Ralf Dieckmann reports non-financial support from Implantcast Germany, outside the submitted work. The authors declare that they have no other conflicts of interest in this work.
References
1. Cross M, Smith E, Hoy D, et al. The global burden of hip and knee osteoarthritis: estimates from the global burden of disease 2010 study. Ann Rheum Dis. 2014;73(7):1323–1330.
2. Murphy L, Schwartz TA, Helmick CG, et al. Lifetime risk of symptomatic knee osteoarthritis. Arthritis Care Res. 2008;59(9):1207–1213. doi:10.1002/art.24021
3. Murphy LB, Helmick CG, Schwartz TA, et al. One in four people may develop symptomatic hip osteoarthritis in his or her lifetime. Osteoarthritis Cartilage. 2010;18(11):1372–1379. doi:10.1016/j.joca.2010.08.005
4. De Groot I, Bussmann J, Stam H, Verhaar J. Actual everyday physical activity in patients with end-stage hip or knee osteoarthritis compared with healthy controls. Osteoarthritis Cartilage. 2008;16(4):436–442. doi:10.1016/j.joca.2007.08.010
5. Dunlop DD, Song J, Semanik PA, et al. Objective physical activity measurement in the osteoarthritis initiative: are guidelines being met? Arthritis Rheum. 2011;63(11):3372–3382. doi:10.1002/art.v63.11
6. Holsgaard-Larsen A, Roos E. Objectively measured physical activity in patients with end stage knee or hip osteoarthritis. Eur J Phys Rehabil Med. 2012;48(4):577–585.
7. Barnes J, Behrens TK, Benden ME, et al. Letter to the Editor: standardized use of the terms” sedentary” and” sedentary behaviours”. Appl Physiol Nutr Metab. 2012;37(3):540–542. doi:10.1139/h2012-024
8. Colley RC, Garriguet D, Janssen I, Craig CL, Clarke J, Tremblay MS. Physical activity of Canadian adults: accelerometer results from the 2007 to 2009 Canadian Health Measures Survey. Health Rep. 2011;22(1):7.
9. Wilmot EG, Edwardson CL, Achana FA, et al. Sedentary time in adults and the association with diabetes, cardiovascular disease and death: systematic review and meta-analysis. Diabetologia. 2012;55(11):2895–2905. doi:10.1007/s00125-012-2677-z
10. Teychenne M, Ball K, Salmon J. Sedentary behavior and depression among adults: a review. Int J Behav Med. 2010;17(4):246–254. doi:10.1007/s12529-010-9075-z
11. Dallal CM, Brinton LA, Matthews CE, et al. Accelerometer-based measures of active and sedentary behavior in relation to breast cancer risk. Breast Cancer Res Treat. 2012;134(3):1279–1290. doi:10.1007/s10549-012-2129-y
12. Matthews CE, George SM, Moore SC, et al. Amount of time spent in sedentary behaviors and cause-specific mortality in US adults. Am J Clin Nutr. 2012;95(2):437–445. doi:10.3945/ajcn.111.019620
13. Jefferis BJ, Sartini C, Lee I-M, et al. Adherence to physical activity guidelines in older adults, using objectively measured physical activity in a population-based study. BMC Public Health. 2014;14(1):382. doi:10.1186/1471-2458-14-382
14. Buman MP, Hekler EB, Haskell WL, et al. Objective light-intensity physical activity associations with rated health in older adults. Am J Epidemiol. 2010;172(10):1155–1165. doi:10.1093/aje/kwq249
15. Wallis JA, Webster KE, Levinger P, Taylor NF. What proportion of people with hip and knee osteoarthritis meet physical activity guidelines? A systematic review and meta-analysis. Osteoarthritis Cartilage. 2013;21(11):1648–1659. doi:10.1016/j.joca.2013.08.003
16. Nüesch E, Dieppe P, Reichenbach S, Williams S, Iff S, Jüni P. All cause and disease specific mortality in patients with knee or hip osteoarthritis: population based cohort study. BMJ. 2011;342:d1165. doi:10.1136/bmj.d1165
17. Lee I-M, Shiroma EJ, Lobelo F, et al. Effect of physical inactivity on major non-communicable diseases worldwide: an analysis of burden of disease and life expectancy. Lancet. 2012;380(9838):219–229. doi:10.1016/S0140-6736(12)61031-9
18. Hoppmann C, Gerstorf D. Spousal interrelations in old age–a mini-review. Gerontology. 2009;55(4):449–459. doi:10.1159/000211948
19. Hoppmann CA, Gerstorf D. Biobehavioral pathways underlying spousal health dynamics: its nature, correlates, and consequences. Gerontology. 2014;60(5):458–465. doi:10.1159/000357671
20. Pauly T, Keller J, Knoll N, et al. Moving in sync: hourly physical activity and sedentary behavior are synchronized in couples. Ann Behav Med. 2019.
21. Akers RL. Deviant Behavior: A Social Learning Approach. Wadsworth Publishing Company; 1985.
22. Meyler D, Stimpson JP, Peek MK. Health concordance within couples: a systematic review. Soc Sci Med. 2007;64(11):2297–2310. doi:10.1016/j.socscimed.2007.02.007
23. Walker RB, Luszcz MA. The health and relationship dynamics of late-life couples: a systematic review of the literature. Ageing Soc. 2009;29(3):455–480. doi:10.1017/S0144686X08007903
24. Li -K-K, Cardinal BJ, Acock AC. Concordance of physical activity trajectories among middle-aged and older married couples: impact of diseases and functional difficulties. Gerontol B Psychol Sci Soc Sci. 2013;68(5):794–806. doi:10.1093/geronb/gbt068
25. Falba TA, Sindelar JL. Spousal concordance in health behavior change. Health Serv Res. 2008;43(1p1):96–116. doi:10.1111/j.1475-6773.2007.00754.x
26. Kolonel LN, Lee J. Husband-wife correspondence in smoking, drinking, and dietary habits. Am J Clin Nutr. 1981;34(1):99–104. doi:10.1093/ajcn/34.1.99
27. Ainsworth BE, Haskell WL, Whitt MC, et al. Compendium of physical activities: an update of activity codes and MET intensities. Med Sci Sports Exerc. 2000;32(9 Suppl):S498–S504. doi:10.1097/00005768-200009001-00009
28. Berli C, Lüscher J, Luszczynska A, Schwarzer R, Scholz U. Couples’ daily self-regulation: the health action process approach at the dyadic level. PLoS One. 2018;13(10):e0205887. doi:10.1371/journal.pone.0205887
29. Harada K, Masumoto K, Kondo N. Spousal concordance for objectively measured sedentary behavior and physical activity among middle-aged and older couples. Res Q Exerc Sport. 2018;89(4):440–449. doi:10.1080/02701367.2018.1510171
30. Jackson SE, Steptoe A, Wardle J. The influence of partner’s behavior on health behavior change: the English Longitudinal Study of Ageing. JAMA Intern Med. 2015;175(3):385–392. doi:10.1001/jamainternmed.2014.7554
31. Smith KR, Zick CD. Linked lives, dependent demise? Survival analysis of husbands and wives. Demography. 1994;31(1):81–93. doi:10.2307/2061909
32. Skoyen JA, Blank E, Corkery SA, Butler EA. The interplay of partner influence and individual values predicts daily fluctuations in eating and physical activity. J Soc Pers Relat. 2013;30(8):1000–1019. doi:10.1177/0265407513479214
33. Badr H, Acitelli LK. Re-thinking dyadic coping in the context of chronic illness. Curr Opin Psychol. 2017;13:44–48. doi:10.1016/j.copsyc.2016.03.001
34. Martire LM, Stephens MAP, Mogle J, Schulz R, Brach J, Keefe FJ. Daily spousal influence on physical activity in knee osteoarthritis. Ann Behav Med. 2012;45(2):213–223. doi:10.1007/s12160-012-9442-x
35. Bellettiere J, Carlson JA, Rosenberg D, et al. Gender and age differences in hourly and daily patterns of sedentary time in older adults living in retirement communities. PLoS One. 2015;10(8):e0136161. doi:10.1371/journal.pone.0136161
36. Doherty A, Jackson D, Hammerla N, et al. Large scale population assessment of physical activity using wrist worn accelerometers: the UK biobank study. PLoS One. 2017;12(2):e0169649. doi:10.1371/journal.pone.0169649
37. Herbolsheimer F, Schaap LA, Edwards MH, et al. Physical activity patterns among older adults with and without knee osteoarthritis in six European countries. Arthritis Care Res (Hoboken). 2016;68(2):228–236. doi:10.1002/acr.22669
38. Liu S-H, Eaton CB, Driban JB, McAlindon TE, Lapane KL. Comparison of self-report and objective measures of physical activity in US adults with osteoarthritis. Rheumatol Int. 2016;36(10):1355–1364. doi:10.1007/s00296-016-3537-9
39. Hansen BH, Kolle E, Dyrstad SM, Holme I, Anderssen SA. Accelerometer-determined physical activity in adults and older people. Med Sci Sports Exerc. 2012;44(2):266–272. doi:10.1249/MSS.0b013e31822cb354
40. Thiel C, Gabrys L, Vogt L. Registrierung körperlicher Aktivität tragbaren Akzelerometern. Dtsch Z Sportmed. 2016;67(2):44–48. doi:10.5960/dzsm.2016.220
41. Sallis JF, Saelens BE. Assessment of physical activity by self-report: status, limitations, and future directions. Res Q Exerc Sport. 2000;71(sup2):1–14. doi:10.1080/02701367.2000.11082780
42. Migueles JH, Cadenas-Sanchez C, Ekelund U, et al. Accelerometer data collection and processing criteria to assess physical activity and other outcomes: a systematic review and practical considerations. Sports Med. 2017;47(9):1821–1845. doi:10.1007/s40279-017-0716-0
43. Trost SG, McIver KL, Pate RR. Conducting accelerometer-based activity assessments in field-based research. Med Sci Sports Exerc. 2005;37(11 Suppl):S531–S543. doi:10.1249/01.mss.0000185657.86065.98
44. Choi L, Ward SC, Schnelle JF, Buchowski MS. Assessment of wear/nonwear time classification algorithms for triaxial accelerometer. Med Sci Sports Exerc. 2012;44(10):2009. doi:10.1249/MSS.0b013e318258cb36
45. Freedson PS, Melanson E, Sirard J. Calibration of the computer science and applications, Inc. accelerometer. Med Sci Sports Exerc. 1998;30(5):777–781. doi:10.1097/00005768-199805000-00021
46. Lesack K, Naugler C. An open-source software program for performing Bonferroni and related corrections for multiple comparisons. J Pathol Inform. 2011;2.
47. Stucki G, Sangha O, Stucki S, et al. Comparison of the WOMAC (Western Ontario and McMaster Universities) osteoarthritis index and a self-report format of the self-administered Lequesne–algofunctional index in patients with knee and hip osteoarthritis. Osteoarthritis Cartilage. 1998;6(2):79–86. doi:10.1053/joca.1997.0097
48. Hagströmer M, Oja P, Sjöström M. Physical activity and inactivity in an adult population assessed by accelerometry. Med Sci Sports Exerc. 2007;39(9):1502–1508. doi:10.1249/mss.0b013e3180a76de5
49. Wilcox S, Der Ananian C, Abbott J, et al. Perceived exercise barriers, enablers, and benefits among exercising and nonexercising adults with arthritis: results from a qualitative study. Arthritis Care Res. 2006;55(4):616–627. doi:10.1002/art.22098
50. Arnold JB, Walters JL, Ferrar KE. Does physical activity increase after total hip or knee arthroplasty for osteoarthritis? A systematic review. J Orthop Sports Phys Ther. 2016;46(6):431–442. doi:10.2519/jospt.2016.6449
51. Tudor-Locke C, Craig CL, Aoyagi Y, et al. How many steps/day are enough? For older adults and special populations. Int J Behav Nutr Phys Act. 2011;8(1):1.
52. Sliepen M, Mauricio E, Lipperts M, Grimm B, Rosenbaum D. Objective assessment of physical activity and sedentary behaviour in knee osteoarthritis patients–beyond daily steps and total sedentary time. BMC Musculoskelet Disord. 2018;19(1):64. doi:10.1186/s12891-018-1980-3
53. Abdalla THB, Rutkofsky IH, Syeda JN, Saghir Z, Muhammad AS. Occupational physical activity in young adults and stroke: was it due to my job? Cureus. 2018;10:8.
54. Van Domelen DR, Koster A, Caserotti P, et al. Employment and physical activity in the US. Am J Prev Med. 2011;41(2):136–145. doi:10.1016/j.amepre.2011.03.019
55. Biddle SJ, Pearson N, Ross GM, Braithwaite R. Tracking of sedentary behaviours of young people: a systematic review. Prev Med. 2010;51(5):345–351. doi:10.1016/j.ypmed.2010.07.018
56. Ekelund U, Ward HA, Norat T, et al. Physical activity and all-cause mortality across levels of overall and abdominal adiposity in European men and women: the European Prospective Investigation into Cancer and Nutrition Study (EPIC). Am J Clin Nutr. 2015;101(3):613–621. doi:10.3945/ajcn.114.100065
57. Haskell WL, Lee I-M, Pate RR, et al. Physical activity and public health: updated recommendation for adults from the American College of Sports Medicine and the American Heart Association. Circulation. 2007;116(9):1081.
58. Owen N, Sugiyama T, Eakin E, Gardiner P. Adults’ sedentary behavior: determinants and interventions. AJOL Pract J SL Participants. 2014;3(1):1–4.
59. Bernaards CM, Hildebrandt VH, Hendriksen IJ. Correlates of sedentary time in different age groups: results from a large cross sectional Dutch survey. BMC Public Health. 2016;16(1):1121.
60. Burke V, Giangiulio N, Gillam HF, Beilin LJ, Houghton S. Physical activity and nutrition programs for couples: a randomized controlled trial. J Clin Epidemiol. 2003;56(5):421–432. doi:10.1016/S0895-4356(02)00610-8
61. Macken LC, Yates B, Blancher S. Concordance of risk factors in female spouses of male patients with coronary heart disease. J Cardiopulm Rehabil Prev. 2000;20(6):361–368. doi:10.1097/00008483-200011000-00005
62. Kingsbury SR, Hensor EM, Walsh CA, Hochberg MC, Conaghan PG. How do people with knee osteoarthritis use osteoarthritis pain medications and does this change over time? Data from the osteoarthritis initiative. Arthritis Res Ther. 2013;15(5):R106. doi:10.1186/ar4286
63. Button KS, Ioannidis JP, Mokrysz C, et al. Power failure: why small sample size undermines the reliability of neuroscience. Nat Rev Neurosci. 2013;14(5):365. doi:10.1038/nrn3475
64. Hills AP, Mokhtar N, Byrne NM. Assessment of physical activity and energy expenditure: an overview of objective measures. Front Neurol. 2014;1:5. doi:10.3389/fnut.2014.00005
 © 2020 The Author(s). This work is published and licensed by Dove Medical Press Limited. The
full terms of this license are available at https://www.dovepress.com/terms
and incorporate the Creative Commons Attribution
- Non Commercial (unported, 3.0) License.
By accessing the work you hereby accept the Terms. Non-commercial uses of the work are permitted
without any further permission from Dove Medical Press Limited, provided the work is properly
attributed. For permission for commercial use of this work, please see paragraphs 4.2 and 5 of our Terms.
© 2020 The Author(s). This work is published and licensed by Dove Medical Press Limited. The
full terms of this license are available at https://www.dovepress.com/terms
and incorporate the Creative Commons Attribution
- Non Commercial (unported, 3.0) License.
By accessing the work you hereby accept the Terms. Non-commercial uses of the work are permitted
without any further permission from Dove Medical Press Limited, provided the work is properly
attributed. For permission for commercial use of this work, please see paragraphs 4.2 and 5 of our Terms.