Back to Journals » Risk Management and Healthcare Policy » Volume 13
Bayesian Joint Modeling of Longitudinal and Survival Time Measurement of Hypertension Patients
Authors Erango MA
Received 9 July 2019
Accepted for publication 14 January 2020
Published 4 February 2020 Volume 2020:13 Pages 73—81
DOI https://doi.org/10.2147/RMHP.S222425
Checked for plagiarism Yes
Review by Single anonymous peer review
Peer reviewer comments 3
Editor who approved publication: Dr Kent Rondeau
Markos Abiso Erango
College of Natural Science, Department of Statistics, Arba Minch University, Arba Minch, Ethiopia
Correspondence: Markos Abiso Erango Email [email protected]
Background: High blood pressure is a health risk for all populations, worldwide. Globally the number of people with uncontrolled hypertension rose by 70% between 1980 and 2008.
Objective: This paper aims to investigate the association of survival time and fasting blood sugar levels of hypertension patients and identify the risk factors that affect the survival time of the patient.
Methods: We considered a total of 430 random samples of hypertension patients who were followed-up at Yekatit-12 Hospital in Ethiopia from January 2013 to January 2019. A linear mixed effects model was used for the longitudinal outcomes (fasting blood sugar) with normality assumption, although four parametric accelerated failure time distributions: exponential, Weibull, lognormal and loglogistic are studied for the time-to-event data. The Bayesian joint models were defined through latent variables and association parameters and with specified noninformative prior distributions for the model parameters. Simulations are conducted using Gibbs sampler algorithm implemented in the WinBUGS software. The model selection criteria DIC is employed to identify the model with best fit to the data.
Results: The findings from Bayesian joint models are consistent. The association parameter in each Bayesian joint model is significant. This implies that there is dependence between the two processes: longitudinal fasting blood sugar level and the time-to-death event under joint models. With investigation of the model comparison criteria, the Bayesian–Weibull model was preferred to analysize the current data sets. Based on joint analysis the baseline age, place of residence, family history of hypertension, khat intake, blood cholesterol level of the patient, hypertension disease stage, adherence to the treatment and related disease were associated factors that affect the survival time of hypertension patients.
Conclusion: The analysis suggests that there is strong association between longitudinal process (fasting blood sugar) and time-to-event data. The researcher recommends that all stakeholders should be aware of the consequences of these factors which can influence the survival time of hypertension patients in the study area.
Keywords: Bayesian, joint model, hypertension, survival analysis, parametric models
Background
Hypertension is a major long-term health condition and the leading cause of premature death among adults throughout the world, including developed, developing, and lesser developed countries. Sometimes called arterial hypertension, which is a chronic medical condition in which the blood pressure in the arteries is elevated, this requires the heart to work harder than normal to circulate blood through the blood vessels.1
Hypertension is a worldwide public health challenge and a leading flexible risk factor for cardiovascular disease and death. Globally the number of people with uncontrolled hypertension rose by 70% between 1980 and 2008. The rising epidemic of hypertension is thought to be due to mechanization, population growth, and ageing.2,3
Hypertension doubles the risk of cardiovascular diseases such as coronary heart disease, congestive heart failure, stroke, renal failure, and peripheral arterial disease.4 The global burden of cardiovascular disease over a fairly short period is attributable mainly due to changes in lifestyle such as diet and physical activity.5
Hypertension in Africa has now changed from a relative rarity to a major public health problem.6 Current disease estimates for Sub-Saharan Africa are based on sparse data, but projections indicate increases in noncommunicable diseases caused by demographic and epidemiologic transitions; however, hypertension control assumes a relatively low priority and little experience exists in implementing sustainable and successful programs.
Ethiopia is a country currently prioritizing prevention of communicable and nutritional deficiency diseases. However, it is experiencing double mortality burden as evidenced among the adult population in Addis Ababa.7 A study conducted in Ethiopia in the last decade showed that the prevalence of cardiovascular diseases increase the risk factor rapidly.8 Recently comprehensive assessment of the evidence concerning hypertension in Ethiopia does not exist. However, recent evidence indicates that hypertension and raised blood pressure are increasing partly because of the increase in risk factors. The goal of this study was to investigate the association of survival time and fasting blood sugar levels of hypertension patients and identifying the risk factors that affect the survival time of the patient
Methodology
Data Description
The data for this study was obtained from hypertension patients from Yekatit-12 Hospital under follow-up from January 2013 to January 2019. The data was extracted from the patient’s chart which contains epidemiological, laboratory, and clinical information of all hypertension patients under follow-up. A total of 430 patients were selected using a simple random sampling technique among a total of 2126 hypertension patients under follow-up. The description of the covariates are presented in Table 1.
 |
Table 1 Explanatory Variables with Codes |
Statistical Estimation
The joint models are defined in Henderson et al9, 10 and Guo and Carlin. The longitudinal and survival process is linked through stochastic dependence. Consider that we have a set of n patients followed over a time interval (0, T). The  patient provides a set of longitudinal measurements
  which is fasting blood sugar at a follow-up time
  of visit
  = 1, 2, ⋯
  with
with  number of follow-up of patient
  = 1, 2, ⋯, n.
Survival time of the patients measured by years, months, weeks, or days from the beginning of follow-up until an event occurs. For the survival data, let  be the observed time for the
  patients, where
  is time to death and
  is the censoring time which is assumed independent of
  and
and  =1 if the event is observed,
  =0 otherwise. Let the covariates of the longitudinal and survival processes be respectively denoted by
  and
and  . Some of these covariates may be time dependent.
Linear Mixed Effects Model
The linear mixed effect model is often used in the literature for modeling a longitudinal data and provides a general and flexible modeling framework based on a random effects approach.11,12
For the given k vector of predictors (1) , the linear mixed effects model is given as:
Where  is mean response which is a linear function of
  ,
,  is subject specific random effects having Gaussian distribution, and
  is a sequence of mutually independent measurement errors.
Survival Models
The survival time is a random variable defined on non-negative real numbers. The observed time is taken as the minimum (2) of the time–to–event
  and time to censoring
  .The time variable was modeled with four AFT distributions (exponential, Weibull, lognormal or loglogistic) as considered.10,13,14 The log-linear form of the AFT model for survival time
  is given as:

Where,  is a vector of unknown and fixed coefficient of the covariates,
  refers to subject specific random effects of the survival time having Gaussian distribution,
  is a sequence of mutually independent measurement errors. The random error terms follow a distribution such that the time–to–event, in this case, exponential, Weibull, lognormal and loglogistic distributions. If the error follows normal distribution, the time is lognormal, and the error follows logistic distribution, the time is loglogistic. The Weibull distribution arises as a general linear form of the smallest extreme value distribution.14
The four AFT models considered in this study are exponential, Weibull, lognormal and loglogistic distributions. Table 2 lists their probability densities, hazard rate functions, and survival functions.
 |
Table 2 List of Accelerated Failure Time Distributions |
Bayesian Joint Model
Likelihood Model
The association between the longitudinal and survival processes is assumed to come through stochastic dependences denoted by (3) (4) and
and  . There are many ways of making the linkages.9 Here we consider the links used in Guo and Carlin.10 The linear mixed effects model for the longitudinal process in Equation (1) and the AFT model for the time-to-event in Equation (2) are linked through random effects
  and
and  as follows:
The parameters  ,
,  measure the association between the two sub-models (1) and (2) that are expected to be induced by the longitudinal process to the time-to-event process. They represent random intercept and random slope terms in model (1). The variables
  and
and  are assumed independent latent variables representing subject-specific random effects having normal distributions with mean zeros and precisions
  and
and 
The respective likelihood function of interest is:
(5)
where  are population parameters in the linear mixed effects model,
  are the population parameters in the survival model,
  are regression parameters in the mixed effects model,
  is the variance of the Fasting blood sugar,
  are the variance of subject specific random effects,
 are regression coefficients in the AFT model,
  is the variance of the transformed event time,
  represent the association parameters
  and
and  ,
,  and
and  are probability density and distribution functions, respectively
Prior Distribution
Noninformative joint prior distribution of the parameters are considered:  are normally distributed with mean zero and large variance 1000, association parameters
  are each assumed to have normal distribution with mean zero and variance 1000; the shape parameter
  in Weibull and loglogistic distributions follows Gamma(2,0.5); all precisions parameters follow
  .
.
Posterior Distribution
The joint posterior distribution (6) of model parameters
  and random effects
  is given by:
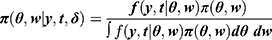
Where,  is the likelihood function,
  is the joint prior probability distribution, and
  is the normalizing constant. It is a high dimensional problem that requires modern computations. Thus inference is based on the Gibbs sampler algorithm using full conditional distributions of the parameters. The Gibbs sampler algorithm is implemented in the WinBUGS software version 14.3.15 Inferences are made based on simulation of 40,000 iterations with burn-in of 20,000 and thinning of 10. Time series plots, autocorrelations and Gelman–Rubin statistics are assessed and they all confirm convergences.
Model Comparisons
In this study, we compare the four Bayesian joint models with the AFT exponential, Weibull, lognormal, loglogistic probability distributions using the deviance information criterion (DIC), Akaike’s information criterion (AIC) and Bayes information criterion (BIC). It measures how best the selected model can predict future observations given that it best fits the data at hand.16
DIC involves posterior mean that takes into account prior information and penalized likelihood. It is computed as:
(7)
Where, (8) (9) is deviance and
  is the posterior mean of the deviance and
  is effective number of parameters. The AIC and BIC are computed as follows:


Where, p is the number of parameters in the model and n is the sample size. The models used in this study involve random effects and so the DIC is more relevant for the model selection.
Results and Discussion
The objective of this study was to investigate the association of survival time and fasting blood sugar levels of hypertension patients and identifying the risk factors that affect the survival time of the patients. The linear mixed effect model was assumed for the longitudinal process, while exponential, Weibull, lognormal, and loglogistic distributions were assumed for the survival time. A random sample of 430 hypertension patients was selected from 2126 hypertension patients under follow-up and the data analyzed using Bayesian joint models. The findings from the models are all interpreted as they are important in many ways. The statistical packages SPSS version 20 (IBM Corporation, Armonk, NY, USA) and WinBUGS software version 14.3 have been used to analyze the data.
Descriptive Survival Analysis
In the data set considered 430 hypertension patients among which 55.3% are females and 44.7% are males. In the survival data, 17.9% are dead and 82.1% are censored. The death proportion of male patients was 23.4% and of a female patient was 13.4%. Among 430 patients 88% of them live in a rural area and only 12% of them reside in an urban area.
To observe the event experiencing time between two or more groups plotting the survival function for the group is recommendable. To obtain a closer look at estimate of the survival time we used the Kaplan–Meier estimation technique. The pattern of survivorship function lying above another means the group defined by the upper curve had a better survival than the group defined by the lower curve. The log rank test also used for comparing two or more independent survival curves, the analysis show that the log rank test for covariate gender (χ2=5 with 1 df, p=0.03), khat intake (χ2=9.7 with 1 df, p=0.002), blood cholesterol (χ2=5.9 with 1 df, p=0.02), stage of hypertension (χ2=59.7 with 3 df, p=0.00), adherence (χ2=12 with 1 df, p=0.00) and related disease (χ2=29.6 with 2 df, p=0.00), at 5% level of significance, there is evidence to reject the null hypothesis. Therefore, they are statistical significant in survival experience of the patients in different categories of gender, khat intake, blood cholesterol, stage of hypertension, adherence and related disease. Also, the log rank test for the covariate place of residence (χ2=0.4 with 1 df, p=0.5), family history of hypertension (χ2=1.4 with 1 df, p=0.2), tobacco use (χ2=0.1 with 2 df, p=0.8), alcohol use (χ2=1.4 with 2 df, p=0.2) and diabetes mellitus status (χ2=1 with 2 df, p=0.3) are not statistically significant at 5% level of significance, therefore they are not statistically significant in survival experience of the patients in different categories of place of residence, family history of hypertension, tobacco use, alcohol use, and diabetes mellitus. Figure 1 shows that there were statistical differences among survival curves of sex group, family history of hypertension, cholesterol level, diabetes mellitus.
 |
Figure 1 Kaplan–Meier survival function curves of hypertension patients. (A) Gender of patient. (B) Family history of hypertension. (C) Cholesterol level. (D) Diabetes mellitus. |
To check the PH assumption, the scaled Schoenfeld residuals were plotted over time and the corresponding p-values, as well as the p-value associated with a global test of non-proportionality are tested. The global test suggested strong evidence of non-proportionality (p <0.025). Figure 2: shows plots of Schoenfeld residuals against transformed time for each covariate. There is a systematic departure from a horizontal line that indicates violation of the proportional hazard assumption.
 |
Figure 2 Plot of scaled-Schoenfeld residuals vs follow-up time. (A) Khat intake. (B) Age. (C) Stages of hypertension. (D) Related disease. |
Inferential Analysis
The Bayesian joint AFT analysis involves the random effects  in the longitudinal and
  in the time-to-event models. Prior distributions used are
  ,
,  ,
,  ,
,  ,
, 
 ,
,  ,
,  ,
,  ,
,  .
.
The posterior means of the parameters, standard deviations, Monte Carlo errors, and 95% credible intervals are estimated. The simulation of the posterior distribution was made using the Gibbs sampler algorithm and produced three realizations of 40,000 iterations with different initial states. A burn-in of 20,000 iterations was considered and convergence diagnoses are assessed. Inferences are then made based on independent samples taken.
Model Comparison
Analysis of data for model comparison is given in Table 3. Estimates of total DIC for the four models are 15,726.8 for BJ-exponential, 15,582.4, for BJ-Weibull, 15,658 for BJ-lognormal, and 15,778.1 for BJ-loglogistic models. The Bayesian–Weibull joint model has the smallest total DIC, AIC and BIC. Based on model comparison, inferential analysis was done using the Bayesian–Weibull joint model.
 |
Table 3 Model Comparison Among the Bayesian Joint Models |
Bayesian Weibull Analysis
The posterior estimates of subject-specific random effects  and
and  are found to be significant as
  and
and  95%CI (0.924, 2.522). It supports the assumption of heterogeneous variance for the repeated fasting blood sugar measurements.
The association parameter  is significant
  but not the intercept
  The significance of the association parameter suggests that there is strong dependence between fasting blood sugar levels and survival time of hypertension patients. The Bayesian–Weibull joint model analysis in Table 4 below show that the longitudinal sub-model and fasting blood sugar were significantly associated with visit time, tobacco and alcohol use and place of residence. In survival sub-model, the survival time of hypertension patients was significantly related with baseline age, gender, family history of hypertension, khat intake, tobacco use, alcohol use, stage of hypertension, and adherence. The posterior means of the parameters, standard deviations, Monte Carlo errors, and 95% credible intervals are estimated and displayed in Table 4.
 |
Table 4 Parameter Estimations of the Bayesian Joint Weibull Models |
The effects of covariates identified in this study are fairly consistent with the previous findings. For example, a researcher17–21 found that family history of patients, alcohol use, baseline age, and stage of hypertension were risk factors associated with survival time of the patients. The four Bayesian models based on the AFT exponential, Weibull, lognormal, loglogistic distributions were studied.
Conclusion
The aim of this study was to investigate the association of survival time and fasting blood sugar levels of hypertension patients and identify the risk factors that affect the survival time of the patients. Bayesian joint models were used with the assumption of linear mixed effect model for the longitudinal fasting blood sugar observations and of four AFT distributions for the survival time of hypertension patients.
Covariates with significant effects are identified from analysis of the Bayesian–Weibull joint model. The findings reveal that the health of hypertension patients under follow-up can be improved over time and female hypertension patients had better survival probability than male hypertension patients. Survival time of a hypertension patient was affected by baseline age, gender, family history of hypertension, khat intake, tobacco use, alcohol use, stage of hypertension, and adherence.
In conclusion, a significant number of patients were found to lack knowledge about behavioral risk factors of hypertension and so they need great attention. Therefore, teaching patients about the effect of behavioral risk factor of hypertension like alcohol use, tobacco use, and khat intake and improvement of the surveillance systems implementation of community based screening programs for early detection of hypertension are highly recommended.
Ethical Consideration
The ethical clearance was checked and approved by ethical clearance committee of Arba Minch University Department of Statistics and the Addis Ababa Administration Health Bureau Yekatit 12 Hospital Medical College medical director’s office granted permission to use the patients’ data for this study. For the purpose of confidentiality, there were no links with individual patients and all data had no personal identifier and were kept confidential and therefore did not require informed consent.
Acknowledgments
The author would like to sincerely thank the Yeketit12 Hospitals for providing the data sets used in this study. The anonymous reviewers are acknowledged for their detailed comments and suggestions.
Disclosure
The author declares no conflicts of interest regarding the publication of this paper.
References
1. Chobanian AV, Bakris GL, Black HR, et al. The seventh report of the joint national committee on prevention, detection, evaluation, and treatment of high blood pressure: the JNC 7 report. JAMA. 2003;289(19):2560–2571. doi:10.1001/jama.289.19.2560
2. Fuster V, Kelly BB. Promoting Cardiovascular Health in the Developing World: A Critical Challenge to Achieve Global Health. Washington, DC: National Academies Press; 2010.
3. Cooper RS, Amoah AG, Mensah GA. High blood pressure: the foundation for epidemic cardiovascular disease in African populations. Ethn Dis. 2003;13(2):S2–48.
4. Ezzati M, Lopez AD, Rodgers A, Vander Hoorn S, Murray CJ; Comparative Risk Assessment Collaborating Group. Selected major risk factors and global and regional burden of disease. Lancet. 2002;360(9343):1347–1360. doi:10.1016/S0140-6736(02)11403-6
5. Kearney PM, Whelton M, Reynolds K, Muntner P, Whelton PK, He J. Global burden of hypertension: analysis of worldwide data. lancet. 2005;365(9455):217–223. doi:10.1016/S0140-6736(05)17741-1
6. Opie LH, Seedat YK. Hypertension in Sub-Saharan African populations. Circulation. 2005;112(23):3562–3568. doi:10.1161/CIRCULATIONAHA.105.539569
7. Tesfaye F, Byass P, Wall S. Population based prevalence of high blood pressure among adults in Addis Ababa: uncovering a silent epidemic. BMC Cardiovasc Disord. 2009;9(1):39. doi:10.1186/1471-2261-9-39
8. Tran A, Gelaye B, Girma B, et al. Prevalence of metabolic syndrome among working adults in Ethiopia. Int J Hypertens. 2011;2011. doi:10.4061/2011/193719
9. Henderson R, Diggle P, Dobson A. Joint modeling of longitudinal measurements and event time data. Biostatistics. 2000;4:465–480. doi:10.1093/biostatistics/1.4.465
10. Guo X, Carlin BP. Separate and joint modeling of longitudinal and event time data using standard computer packages. Am Stat. 2004;58(1):16–24. doi:10.1198/0003130042854
11. Laird NM, Ware JH. Random-effects models for longitudinal data. Biometrics. 1982;38:963–974. doi:10.2307/2529876
12. Wu L. Mixed Effects Models for Complex Data. Boca Raton: CRC Press; 2009. doi:10.1201/9781420074086
13. Erango MA, Goshu AT, Buta GB, Dessiso AH. Bayesian joint modeling of survival of HIV/AIDS patients using AFT data and longitudinal CD4 cell counts. Br J Med Med Res. 2017;20:1–12. doi:10.9734/BJMMR/2017/32123
14. Klein JP, Moeschberger ML. Survival Analysis Techniques for Censored and Truncated Data.
15. Spiegelhalter D, Thomas A, Best N, Lunn D. WinBUGS version 1.4 user manual; 2003.
16. Spiegelhalter DJ, Best NG, Carlin BP. Bayesian Deviance, the Effective Number of Parameters and Comparison of Arbitrarily Complex Models. MRC Biostatistics Unit, Cambridge University; 1998.
17. Cappuccio FP, Micah FB, Emmett L, et al. Prevalence, detection, management and control of hypertension in Ashanti, West Africa: P2. 400. J Hypertens. 2004;22:263–264. doi:10.1097/00004872-200406002-00927
18. Seifu W, Hussein M, Ibrahim M, Sigale A. Behavioral risk factors of hypertension among pastoral and agro pastoral adult communities, Eastern Ethiopia, Somali Regional State, 2016. J Trop Dis. 2017;5(234). doi:10.4172/2329-891X.1000234
19. Meshram II, Laxmaiah A, Mallikharjun RK, Arlappa N, Balkrishna N. Prevalence of hypertension and its correlates among adult tribal population (≥ 20 Years) of Maharashtra State, India. Int J Health Sci Res. 2014;4(1):130–139.
20. Khan RJ, Stewart CP, Christian P. A cross-sectional study of the prevalence and risk factors for hypertension in rural Nepali women. BMC Public Health. 2013;13(1):55. doi:10.1186/1471-2458-13-55
21. Andualem MA, Hassen TS, Yemane T. Effect of khat (Catha edulis Forsk) on blood pressure & heart rate, a community based study. Ethiop J Health Dev. 2002;16(3):325–334.
 © 2020 The Author(s). This work is published and licensed by Dove Medical Press Limited. The
full terms of this license are available at https://www.dovepress.com/terms
and incorporate the Creative Commons Attribution
- Non Commercial (unported, 3.0) License.
By accessing the work you hereby accept the Terms. Non-commercial uses of the work are permitted
without any further permission from Dove Medical Press Limited, provided the work is properly
attributed. For permission for commercial use of this work, please see paragraphs 4.2 and 5 of our Terms.
© 2020 The Author(s). This work is published and licensed by Dove Medical Press Limited. The
full terms of this license are available at https://www.dovepress.com/terms
and incorporate the Creative Commons Attribution
- Non Commercial (unported, 3.0) License.
By accessing the work you hereby accept the Terms. Non-commercial uses of the work are permitted
without any further permission from Dove Medical Press Limited, provided the work is properly
attributed. For permission for commercial use of this work, please see paragraphs 4.2 and 5 of our Terms.