Back to Journals » Journal of Blood Medicine » Volume 12
Basic Coagulation Profiles and Platelet Parameters Among Adult Type 1 and Type 2 Diabetes Patients at Dessie Referral Hospital, Northeast Ethiopia: Comparative Cross-Sectional Study
Authors Ebrahim H ![]() , Asrie F, Getaneh Z
, Asrie F, Getaneh Z ![]()
Received 16 October 2020
Accepted for publication 11 January 2021
Published 27 January 2021 Volume 2021:12 Pages 33—42
DOI https://doi.org/10.2147/JBM.S287136
Checked for plagiarism Yes
Review by Single anonymous peer review
Peer reviewer comments 3
Editor who approved publication: Dr Martin H Bluth
Hussen Ebrahim,1 Fikir Asrie,2 Zegeye Getaneh2
1Department of Medical Laboratory Sciences, College of Medicine and Health Sciences, Wollo University, Dessie, Ethiopia; 2Department of Hematology & Immunohematology, School of Biomedical and Laboratory Sciences, College of Medicine and Health Sciences, University of Gondar, Gondar, Ethiopia
Correspondence: Hussen Ebrahim
Department of Medical Laboratory Sciences, College of Medicine and Health Sciences, Wollo University, Dessie 1145, Ethiopia
Tel +251921332772
Email [email protected]
Background: Diabetes is a heterogeneous group of metabolic disorders characterized by hyperglycemia. The disease is highly associated with micro-vascular and macro-vascular complications. Thus, the main aim of this study was to compare basic coagulation profiles and platelet parameters among type 1 diabetes mellitus (T1DM), type 2 diabetes mellitus (T2DM), and healthy controls.
Methods: A comparative cross-sectional study was conducted at Dessie Referral Hospital from February to April 2019. A total of 180 study participants consisting of (60 T1DM, 60 T2DM, and 60 healthy controls) were enrolled using a systematic random sampling technique. Basic coagulation profiles and platelet parameters were determined using the HUMACLOT JUNIOR coagulometer and DIRUI BF 6500 automated hematology analyzer respectively. Non-parametric Kruskal–Wallis test supplemented with Dunn-Bonferroni correction and Spearman rank-order correlation test were used to compare basic coagulation profiles and platelet parameters among the groups. The test result was expressed in median and interquartile range and presented in texts and tables. P-value < 0.05 was considered to be statistically significant.
Results: Prothrombin time (PT) and international normalization ratio (INR) were significantly reduced in T2DM as compared to T1DM and healthy controls (p < 0.05). Platelet distribution width (PDW) and mean platelet volume (MPV) were significantly increased in both T1DM and T2DM as compared to healthy controls (p < 0.05). Moreover, PT and INR were negatively correlated with fasting blood glucose (FBG) among T1DM and PT, INR and activated partial thromboplastin time (APTT) were negatively correlated with FBG among T2DM.
Conclusion: Basic coagulation profiles and platelet parameters were significantly different between diabetes and controls where PT and INR in T2DM were significantly reduced as compared to T1DM and controls. However, PDW and MPV were significantly elevated in both T1DM and T2DM as compared to controls. Moreover, FBG was significantly negatively correlated with PT and INR among T1DM and FBG was significantly negatively correlated with PT, INR, and APTT among T2DM. Therefore, T2DM may be related to increased risk of thrombosis indicated by reduced PT and INR and high PDW and MPV than T1DM and controls. Basic coagulation profiles and platelet parameters should be regularly tested for early diagnosis and proper management of diabetes-related thrombosis.
Keywords: diabetes mellitus, basic coagulation profiles, platelet parameters, Dessie, Ethiopia
Background
Diabetes mellitus (DM) is a heterogeneous group of metabolic disorders characterized by hyperglycemia due to defects in insulin secretion, insulin action, or both. The disease is highly associated with micro-vascular and macro-vascular complications.1,2 Diabetes can be diagnosed using laboratory test if one or more of the following criteria are met: If fasting plasma glucose level ≥7.0 mmol/l (126 mg/dl) or two-hour plasma glucose level ≥11.1 mmol/l (200 mg/dl) following a 75g oral glucose load or a random glucose level > 11.1 mmol/l (200 mg/dl) or HbA1c ≥ 48 mmol/l (equivalent to 6.5%).1 Moreover, both T1DM and T2DM may be related to multiple consequences as glucose levels are associated with many physiological processes including lipid metabolism, the regulation of inflammation, vasodilatation, basic cell growth, and replication in uncontrolled diabetes.3
Diabetes is a risk factor for cardiovascular disease (CVD). Besides, some antecedent environmental and genetic factors precede the development of both diabetes and CVD. Independent risk factors including obesity, hypertension, toxins, and other genetic factors may be the possible risk factor and significantly related to glucose intolerance, hyperinsulinemia, dyslipidemia, insulin resistance syndrome, inflammation, thrombophilia, dysglycemia, oxidative stress, inflammation, endothelial dysfunction, and the generation of procoagulant and atherogenic lipoproteins which might be the common possible risk factors for both DM and CVD.4–6
The incidence and prevalence of DM rise quickly and becoming one of the most prevalent and costly chronic diseases worldwide.1 International Diabetes Federation (IDF) reported in 2017, the number of people with DM was 424.9 million with an overall prevalence of 8.8%. In the same year, IDF reported an estimated 15.5 million adults aged 20–79 years were living with DM in the Africa region representing a regional prevalence of 3.3%.1 Accelerated micro and macrovascular complications occurred in both types of diabetes. Moreover, both T1DM and T2DM are considered to be the risk factors for increased cardiovascular disease and stroke in unmanaged and poor glycemic control conditions.7,8 Acute complications such as diabetic ketoacidosis, and hyperosmolar hyperglycemic state (HHS) and cardiovascular disease, stroke, chronic kidney failure, foot ulcers, impotence, and damage to the eyes commonly manifested as chronic complications of diabetes.9
Diabetes is significantly associated with metabolic and vascular disturbances.10 An atherothrombotic disease that can affect the coronary, cerebral circulation and peripheral arteries are accelerated among T1DM and T2DM patient.11,12 Atherothrombosis is the leading cause of morbidity and mortality in diabetes as it increases the risk of coronary heart disease, stroke, and peripheral arterial disease by 2- to 4-folds.12 Eighty percent of the patient with DM died due to thrombotic complications and 75% of these death being due to cardiovascular complications.11–14 The pathophysiological mechanisms related to the diabetic pro-thrombotic state are endothelial dysfunction, platelet hyperactivation, and increased activation of pro-thrombotic coagulation factors coupled with decreased fibrinolysis. Hyperglycemia and insulin deficiency in T1DM and hyperglycemia, IR, dyslipidemia, low-grade inflammation, oxidative stress, and other metabolic disorder in T2DM are the main contributors to the occurrence of diabetic pro-thrombotic conditions.15
Hyperglycemia, IR, dyslipidemia, hypertension, and the presence of excess free fatty acids may cause endothelial dysfunction through multiple mechanisms.11 In most cases, hyperglycemia can directly influence the vulnerability of vascular endothelium by changing its glycocalyx layers thereby this process enhances platelet-endothelial cell adhesion and release of coagulation factors and therefore, triggers occlusive thrombus formation.16,17 Besides, hyperglycemia and IR increase the accumulation of reactive oxygen species and reactive nitrogen species through the process of oxidative stress that can change the structure and functional activity of vascular endothelium. In general, hyperglycemia and IR could cause the disturbance between vasodilators and vasoconstrictors which increases the risk of atherosclerosis and thrombus formation.11,18
Hyperglycemia and IR in diabetes can change and up-regulate the gene expression pathway involving the coagulation protein as it may increase the generation of oxidative stress. Therefore, this process increases the synthesis of pro-thrombotic coagulation factors such as fibrinogen, tissue factor (TF) and factor VII (FVII), plasminogen activator inhibitor-1 (PAI-1), and other pathological pro-inflammatory cytokines. Moreover, hyperglycemia can trigger the formation of glycated fibrinogen through the glycation process resulted in the formation of fibrin clot which is dense in structure and resistant to fibrinolysis. Therefore, this change may increase the risk of atherothrombosis and CVD.11,12,18
In diabetes, hyperglycemia, insulin resistance, insulin deficiency, cellular abnormalities, metabolic disorder, inflammation, and oxidative stress are involved in dysregulation of several signaling pathways stimulating platelet enhanced adhesion, activation, and aggregation.15 It is found that hyperglycemia causes platelet to become large and hyperactivated. Therefore, larger platelets release more prothrombotic factors such as thromboxane A2.19 In addition, markers of fibrinolysis are abnormal in people with metabolic syndrome, and fibrinolytic dysfunction is markedly increased.20
Different studies involved coagulation profiles and platelet parameters among diabetic patient-reported contrasting findings. Some studies reported that normal APTT and PT,21,22 and some other studies reported that significantly prolonged APTT and PT among patients with T2DM23,24 and some other related studies also reported that shortened APTT and PT among T2DM patient.25,26 Activated partial thromboplastin time is a screening test for intrinsic and common pathways of coagulation and PT is a screening test for extrinsic and common pathways of coagulation systems standardized by using INR to normalize for the variable responsiveness of thromboplastin reagents.27 Platelet count and platelet indices are important parameters that can reflect the number, size, and activity of platelets.28 Basic coagulation tests and platelet parameters serve as important biomarkers to assess the coagulation factors and platelet parameters to predict the progression of cardiovascular and thrombosis complications among diabetic patients.
Methods and Materials
Study Design, Period, and Area
A comparative cross-sectional study was conducted from February to April 2019 at Dessie Referral Hospital, Northeast Ethiopia. The hospital provides emergency, antiretroviral therapy services, chronic care, surgical, dental, medical, pediatric, gynecologic, obstetric, and other services for more than 4 million clients.
Study Participants
The study was conducted on a total of 180 study participants. Study participants who had a history of known inherited bleeding disorders, hypertension, chronic renal disease, chronic liver disease, any history of malignancy, infectious diseases (human immunodeficiency virus (HIV), hepatitis B virus (HBV) and hepatitis C virus (HCV)), those with the habit of smoking, regular chat chewing and alcohol drinker were excluded from the study. Moreover, pregnant and lactating mothers, patients receiving anticoagulant and antiplatelet agent therapy, and oral contraceptive users were also excluded from the study.
Sample Size Determination and Sampling Techniques
The rule of thumb that has been recommended by van Voorhis and Morgan, has been applied to determine the sample size.29 Thus, a total of 180 study participants (60 T1DM, 60 T2DM, and 60 age and gender-matched controls) were enrolled in the study. A systematic random sampling technique was employed to recruit diabetic cases from Dessie referral hospital chronic care clinics and controls from Dessie Blood Bank.
Data Collection and Laboratory Analysis
Socio-demographic characteristics and clinical information of study participants were collected using a structured questionnaire. Blood sample was collected from the study participants following standard operating procedures (SOPs) by qualified laboratory personnel after informed consent has been obtained. Following an aseptic vein puncture, about 5.7 mL of fasting blood sample was collected with a sterile disposable syringe then; about 2.7 mL of the collected blood sample was dispensed into the test tube containing 0.3 mL of 3.2% trisodium citrate. Platelet-poor plasma (PPP) was obtained by centrifuging at 1500 g for 15 minutes. APTT, PT, and INR were determined using the HUMAN CLOT JUNIOR coagulation analyzer (Wiesbaden, Germany). First, 50 microliters (μL) of test PPP were warmed at 37°C for 5 minutes. At the same time, the APTT reagent and calcium chloride buffer solution were simultaneously incubated then, 50 μL of APTT reagents were added to the warmed platelet-poor plasma and then incubated at 37°C for 3 minutes followed by the addition of 50 μL pre-warmed calcium chloride buffer solution. Therefore, the analyzer read the clotting time of APTT and displayed the result in seconds. The PT reagent which contains lyophilized thromboplastin of rabbit brain was reconstituted by mixing one vial of thromboplastin reagent and one vial calcium chloride buffer solution followed by the vial stand undistributed for 30 minutes at room temperature then, the mixture incubated at 37°C for 10 minutes. One hundred μL of the test PPP was added into the test cuvette followed by incubation at 37°C for 3 minutes. Subsequently, 200 μL of the pre-warmed PT reagent rapidly added and the time is taken for clot formation (in seconds) was recorded and at the same time, INR was calculated and displayed from PT output. For platelet analysis, about 3 mL of whole blood was dispensed into EDTA test tube and properly mixed. Platelet parameters were determined using DIRUI BF 6500 automated hematology analyzer (DIRUI INDUSTRIAL CO. LTD., P.R., CHINA).
Data Quality Management
Blood sample was collected and processed according to the SOPs. Samples were properly mixed and homogenized by inverting 8–10 times and safety procedures and specimen handling procedures were strictly followed. The performance of automated instruments was maintained by daily running of two-level controls (Normal and pathological) for coagulometer and daily background checking for hematology analyzer was conducted. Daily cleaning of automated analyzers and other equipment before leaving the laboratory was conducted. Training was given and daily regular supervision was conducted for data collectors.
Data Management and Analysis
Data were coded, entered, and cleaned using Epi Data 3.1 version and then exported to statistical package for social sciences (SPSS) version 21.0 (IBM Corporation, Armonk, NY, USA). The Kolmogorov–Smirnov test was conducted to check the normality of continuous variables. Levene’s tests were conducted to check the homogeneity of variance. Kruskal–Wallis test supplemented with Dun-Bonferroni correction was used to compare the median of continuous variables. Spearman rank-order correlation test was used to determine the correlation between fasting blood glucose (FBG), PT, INR, APTT, platelet count, PDW, and MPV. The results were summarized using median and interquartile range (IQR) and presented using tables and texts. P-value < 0.05 was considered as statistically significant.
Results
Socio-Demographic Characteristics of Study Participants
In this study, a total of 180 adult study participants were included. The study participants were categorized into three groups; T1DM, T2DM, and healthy blood donors as a control, and 60 adult individuals were involved in each study group. The median age of the study participants were 30, 34.5, and 31.0 years for the respective T1DM, T2DM, and control groups. From the total study participants, 95 of them (52.8%) were males (Table 1).
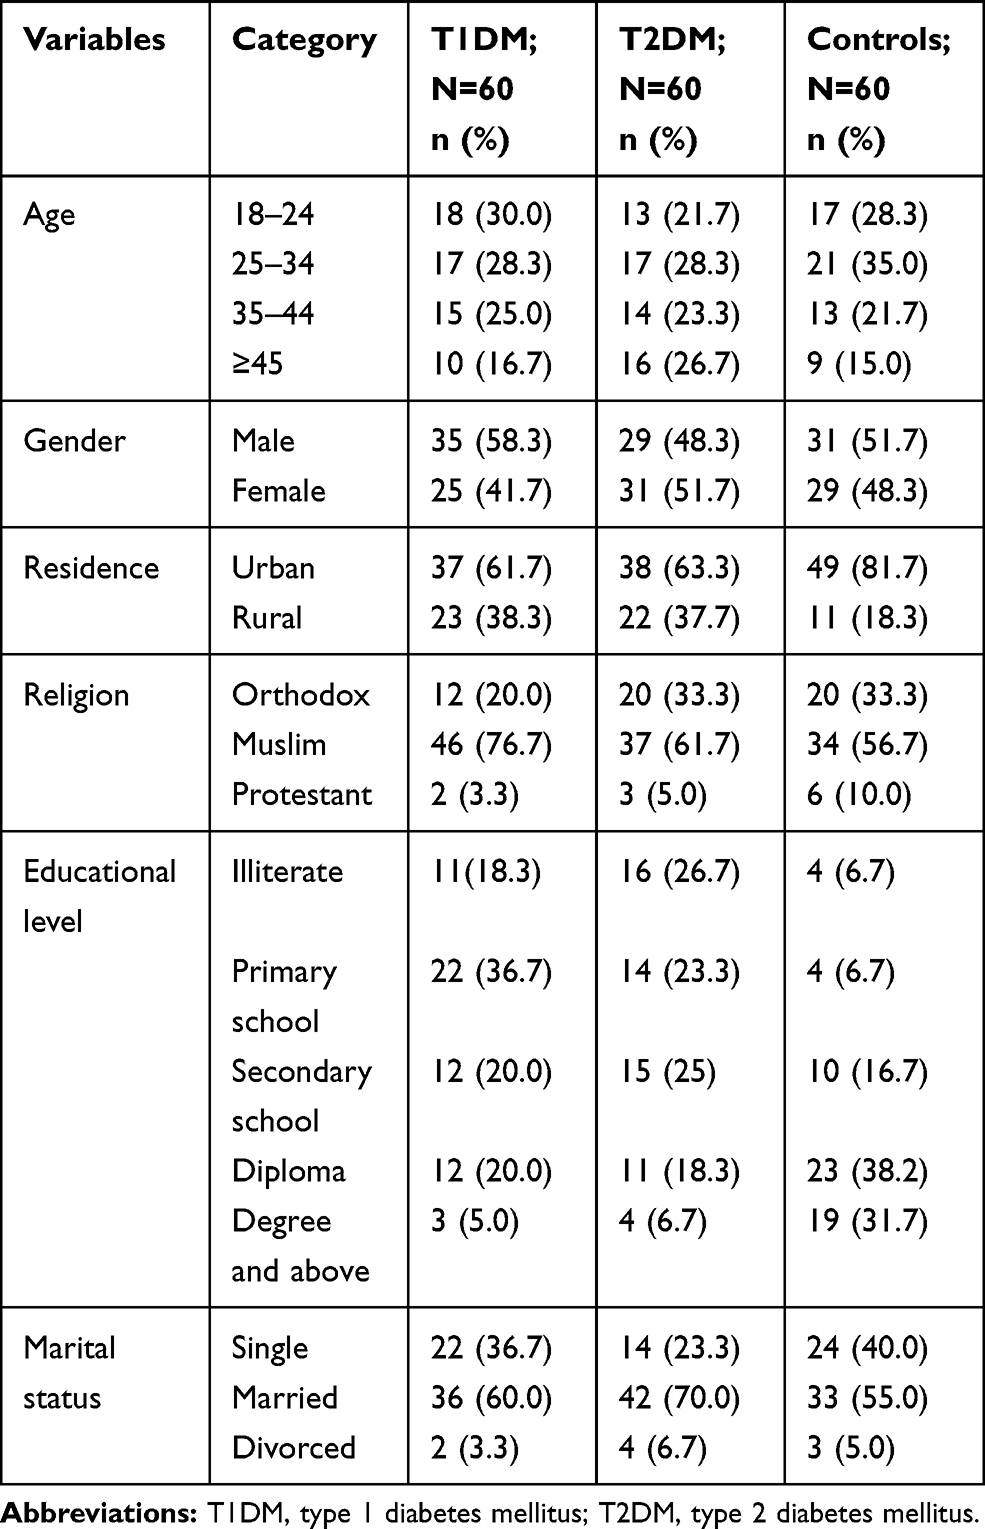 |
Table 1 Socio-Demographic Distribution of Study Participants at Dessie Referral Hospital, Northeast Ethiopia from February to April 2019 (N=180) |
Clinical Characteristics of Study Participants on Diabetes
A total of 120 DM study participants comprised of 38 (63.3%) of T1DM and 33 (55%) of T2DM were below 5 years based on the duration of treatment (Table 2).
 |
Table 2 Clinical Characteristics of T1DM and T2DM Study Participants at Dessie Referral Hospital, Northeast Ethiopia from February to April 2019 (N=120) |
Basic coagulation abnormality was high in T2DM in which 11.7% of T1DM and 16.7% of T2DM had shortened PT whereas 53.3% of T1DM and 63.3% of T2DM had shortened APTT (Table 3).
 |
Table 3 Basic Coagulation Profiles and Platelet Parameters of Study Participants at Dessie Referral Hospital, Northeast Ethiopia from February to April 2019 (N=180) |
Comparison of Basic Coagulation Profiles and Platelet Parameters Among T1DM, T2DM, and Healthy Controls
The non-parametric Kruskal–Wallis test was used to compare the median value among the groups. The finding of the Kruskal–Wallis test for PT, INR, PDW, and MPV showed a statistically significant median (IQR) difference among T1DM, T2DM, and healthy controls (p <0.05) (Table 4).
 |
Table 4 Comparison of Coagulation Profiles (PT, INR, and APTT) and Platelet Parameters (Platelet Count, PDW, and MPV) Among Study Groups at Dessie Referral Hospital, Northeast Ethiopia from February to April 2019 (Kruskal–Wallis Test) |
Multiple Comparisons of Basic Coagulation Profiles and Platelet Parameters Among T1DM, T2DM, and Healthy Controls
Dunn-Bonferroni correction was conducted for multiple comparisons between the groups. In multiple pairwise comparisons with Dunn-Bonferroni correction, the median and IQR of PT and INR among T2DM were the statistically significant difference as compared to T1DM and healthy controls (p<0.05). The median and IQR of PDW and MPV in both T1DM and T2DM showed a statistically significant difference as compared to healthy controls (p <0.05) (Table 5).
 |
Table 5 Post Hoc Test with Dunn-Bonferroni Correction for Multiple Comparisons Among Study Groups at Dessie Referral Hospital, Northeast Ethiopia from February to April 2019 (Pairwise Multiple Comparisons) |
Correlation of FBG with Basic Coagulation Profiles and Platelet Parameters Among T1DM and T2DM
In this study, Spearman rank order correlation showed that there were statistically significant negative correlation between FBG, PT and INR in T1DM (rho= - 0.260, p =0.045), rho = −0.273, p =0.035)) respectively and there were statistically significant negative correlation between FBG, PT, INR and APTT in T2DM (rho = −0.399, P=0.002), rho =0.392, p=0.002), rho=−0.303, p=0.019)) (Table 6).
 |
Table 6 Correlation of FBG with Basic Coagulation Profiles and Platelet Parameters Among T1DM and T2DM at Dessie Referral Hospital, Northeast Ethiopia from February to April 2019 (Spearman Rank-Order Correlation Test) |
Discussion
Atherothrombotic disease is the leading cause of morbidity and mortality in patients with diabetes which is usually associated with both metabolic and vascular abnormalities.10 Diabetes considered to be the independent risk factor for the development of atherosclerosis. Therefore, atherosclerosis is the main cause of macrovascular complications,1,24 and therefore, causes increased platelet activation, activation of coagulation factors, and hypo fibrinolysis significantly associated with an increased risk of cardiovascular disease.1,24–26
In this study, PT and INR were significantly reduced in T2DM patients as compared to T1DM and healthy controls. This result was similar to the finding reported in India and Nigeria30,31 where PT was reduced among T2DM and in Gahanna26 PT and INR was found significantly reduced among T2DM as compared to controls (p<0.05). The possible reason for this might be due to the presence of different factors associated with hyperglycemia, IR, dyslipidemia, low-grade inflammation, and oxidative stress possibly the common contributors for endothelial dysfunction, platelet hyperactivation, and increased activation of prothrombotic coagulation factors.15,18
On contrary, a study conducted in Egypt10 and Sudan32 showed that PT between T2DM and controls had no significant difference. The reason for this variation might be due to sample size variation, variation in study design, and the variation in the study population. On the other hand, a study finding in Nigeria showed PT was significantly elevated in T2DM as compared to controls.23 This variation might be due to the presence of elevated levels of in vitro inhibitor of coagulation such as D-dimer, thrombin-antithrombin complex, and prothrombin activation fragment 1+2 which are markers of coagulation activation that may cause prolonged PT.23 In this study, PT and INR revealed a statistically significant difference between T1DM and T2DM individuals. This variation might be due to T2DM have elevated levels of free fatty acids, elevated insulin levels accompanied with insulin resistance, and elevated levels of PAI-1 but reduced in T1DM, which can affect the regulation of many physiological processes, including alterations in fibrin clot parameters, endothelial dysfunction, atherosclerotic plaque formation and cardiac lipotoxicity.3
In this study, platelet parameters (PDW and MPV) showed that there was a statistically significant increase among T1DM and T2DM as compared to healthy controls (P<0.05). This finding was in agreement with the studies done in India and Ethiopia which reported an increased in PDW and MPV in T2DM than controls, respectively.32,33 Similarly, other studies conducted in Turkey and Nigeria reported that MPV was significantly increased in T2DM as compared to controls.34–36 Moreover, this study was in concurrent finding in Poland reported that increased MPV and PDW in T1DM as compared to controls,37 and a similar finding was reported in Nigeria where high MPV in T1DM as compared to controls.38 The reason might be since hyperglycemia causes non-enzymatic glycation of proteins on the surface of the platelet thereby reduces membrane fluidity and its elasticity and increases its reactivity through direct osmotic effects on platelets. This results in osmotic swelling of platelets and may cause an increased rate of platelet turnover.39 On the other hand, discordance finding was reported in China found that no significant PDW difference between T2DM and controls.40 The reason for this variation might be due to variation in sample size and variation in a population.
The present study finding showed that FBG in T1DM was statistically negatively correlated with PT and INR and FBG in T2DM was negatively correlated with PT, INR, and APTT. This finding was in agreement with a study done in Indonesia that revealed a negative correlation between FBG and PT among T2DM.41 The reason might be since hyperglycemia exerted a procoagulant effect indicated by the elevation of thrombin-antithrombin complexes,soluble tissue factor, increased levels of thromboxane A2, VWF, FVIII, tissue plasminogen activator (TPA), fibrinogen, and increased the level of PAI. The differential effects of hyperglycemia and IR suggested that patients with hyperglycemia due to IR are especially susceptible to thrombotic events by concurrent insulin-induced impairment of fibrinolysis and glucose-induced activation of coagulation.11,16 On the other hand, Nnenna et al, and Fadairo et al, in Nigeria reported that a positive correlation existed between FBG and APTT, PT, and INR in DM patients.23,42 The reason for this variation might be due to variation in sample size and coagulation analyzer.
The present study showed that no significant correlation between FBG and APTT, platelet count, PDW, and MPV in T1DM and no significant correlation between FBG and platelet count, PDW, and MPV in T2DM. A similar finding was reported in Iran which found that no statistically significant correlation between FBG and platelet count in DM patients.43 The contrary finding was reported in China which found a significant positive correlation between FBG and platelet count, PDW, and MPV in T2DM patients,40 and in Nigeria reported a significant positive correlation between FBG and platelet count in T1DM.38 The reason for this variation might be due to variation in the population, variation sample size, and variation in automated hematology analyzer.
Conclusion
In this study, basic coagulation profiles and platelet parameters were significantly different between diabetes and controls where PT and INR in T2DM were significantly reduced as compared to T1DM and controls. However, PDW and MPV were significantly elevated in both T1DM and T2DM as compared to controls. Moreover,FBG was significantly negatively correlated with PT and INR among T1DM and FBG was significantly negatively correlated with PT, INR, and APTT among T2DM. Therefore, T2DM may be related to increased risk of thrombosis indicated by reduced PT and INR and high PDW and MPV than T1DM and controls. Basic coagulation profiles and platelet parameters should be regularly tested for early diagnosis and proper management of diabetes-related thrombosis. A longitudinal study should be conducted to establish the cause-effect relationship between DM, coagulation profiles, and platelet parameters. Further study will be required to determine the association between diabetes-related complications, coagulation profiles, and platelet parameters.
Abbreviations
APTT, activated partial thromboplastin time; CVD, cardiovascular disorder; DM, diabetes mellitus; FBG, fasting blood glucose; FVII, factor VII; IDF, International Diabetes Federation; INR, international normalization ratio; IR, insulin resistance; MPV, mean platelet volume; PAI-1, plasminogen activator inhibitor-1; PDW, platelet distribution width; PT, prothrombin time; SOP, standard operating procedure; T1DM, type 1 diabetes mellitus; T2DM, type 2 diabetes mellitus; TF, tissue factor.
Data Sharing Statement
The authors confirmed that all the data for this manuscript are available; if someone wants to request the data they can contact the corresponding author.
Ethics and Consent Statement
The study was approved by the School of Biomedical and Laboratory Sciences Research and Ethical Review Committee (SBMLS/21/23/11). A letter of support was secured from the zonal health office and a permission letter was obtained from the clinical director of the hospital. Written informed consent was taken from each study participant. Individuals who had coagulation abnormality were linked to the responsible clinician in Dessie referral hospital for proper treatment. This study was conducted in accordance with the declaration of Helsinki.
Acknowledgments
The authors would like to thank the University of Gondar, Dessie referral hospital management, and laboratory staff for their kind cooperation during data collection. We would also like to thank all the study participants for their voluntary participation. Finally, we would like to thank staff members of the Dessie referral hospital laboratory for the cooperation during data collection.
Author Contributions
All authors made a significant contribution to the work reported, whether that is in the conception, study design, execution, acquisition of data, analysis and interpretation, or in all these areas; took part in drafting, revising or critically reviewing the article; gave final approval of the version to be published; have agreed on the journal to which the article has been submitted; and agree to be accountable for all aspects of the work.
Disclosure
The authors declare that they have no conflicts of interest.
References
1. International Diabetes Federation. Diabetes Atlas. sixth edition, 2013. Available from: http://www.diabetesatlas.org.
2. Gundogan K, Bayram F, Capak M, Tanriverdi F, Karaman A. Prevalence of metabolic syndrome in the Mediterranean region of Turkey: evaluation of hypertension, diabetes mellitus, obesity, and dyslipidemia. Metab Syndr Relat Disord. 2009;7:427–434. doi:10.1089/met.2008.0068
3. Sobczak, Amélie IS, Alan SJ. Coagulatory Defects in Type-1 and Type-2 Diabetes. Int J Mol Sci. 2019;20:6345. doi:10.3390/ijms20246345
4. Odegaard AO, Jacobs DR, Sanchez OA, Goff DC, Reiner AP, Gross MD. Oxidative stress, inflammation, endothelial dysfunction, and incidence of type 2 diabetes. Cardiovasc Diabetol. 2016;15(1):51. doi:10.1186/s12933-016-0369-6
5. Soedamah-Muthu SS, Chaturvedi N, Toeller M, et al. Risk Factors for Coronary Heart Disease in Type 1 Diabetic Patients in Europe: the Eurodiab Prospective Complications Study. Diab Care. 2004;27(2):530–537. doi:10.2337/diacare.27.2.530
6. Kendall DM, Harmel AP. The metabolic syndrome, type 2 diabetes, and cardiovascular disease: understanding the role of insulin resistance. Am J Manag Care. 2002;8(20 Suppl):S635–S653.
7. Yngen DM. Platelet Hyperactivity in Diabetes Mellitus. Eur Cardiol Rev. 2005;1(1):1–5. doi:10.15420/ECR.2005.1o
8. Wou C, Unwin N, Huang Y, Roglic G. Implications of the growing burden of diabetes for premature cardiovascular disease mortality and the attainment of the Sustainable Development Goal target. Cardiovasc Diagn Ther. 2019;9(2):140–149. doi:10.21037/cdt.2018.09.04
9. Use of glycated hemoglobin. (HbA1c) in the diagnosis of diabetes mellitus. Diabetes Res Clin Pract. 2011;93(3):299–309. doi:10.1016/j.diabres.2011.03.012
10. Fattah MA, Shaheen MH, Mahfouz MH. Disturbances of Haemostasis in Diabetes Mellitus. Dis Markers. 2004;19(6):251–258. doi:10.1155/2004/797458
11. Grant PJ. Diabetes mellitus as a prothrombotic condition. J Intern Med. 2007;262(2):157–172. doi:10.1111/j.1365-2796.2007.01824.x
12. Carr ME. Diabetes mellitus A hypercoagulable states. J Diabetes Complications. 2001;15(11):44–54. doi:10.1016/S1056-8727(00)00132-X
13. Kim JH, Bae HY, Kim SY. Clinical Marker of Platelet Hyperreactivity in Diabetes Mellitus.Diabetes. Metab J. 2013;37(6):423–428. doi:10.4093/dmj.2013.37.6.423
14. Stamler J, Vaccaro O, Neaton JD, Wentworth D. Diabetes, other risk factors, and 12-yr cardiovascular mortality for men screened in the Multiple Risk Factor Intervention Trial. Diab Care. 1993;16:434–444. doi:10.2337/diacare.16.2.434
15. Vazzana N, Ranalli P, Cuccurullo C, Davì G. Diabetes mellitus and thrombosis. Thromb Res. 2012;129(3):371–377. doi:10.1016/j.thromres.2011.11.052
16. Lemkes BA, Hermanides J, Devries JH, Holleman F, Meijers JCM, Hoekstra JBL. Hyperglycemia: a prothrombotic factor?: hyperglycemia and hypercoagulability. J Thromb Haemost. 2010;8(8):1663–1669. doi:10.1111/j.1538-7836.2010.03910.x
17. Byberg L, Siegbahn A, Berglund L, McKeigue P, Reneland R, Lithell H. Plasminogen Activator Inhibitor-1 Activity Is Independently Related to Both Insulin Sensitivity and Serum Triglycerides. Arterioscler Thromb Vasc Biol. 1998;18(2):258–264. doi:10.1161/01.ATV.18.2.258
18. Alzahrani S, Ajjan R. Review article on coagulation and fibrinolysis in diabetes. Diab Vasc Dis Res. 2010;7(4):260–273. doi:10.1177/1479164110383723
19. Ulutas KT, Dokuyucu R, Sefil F, et al. Evaluation of mean platelet volume in patients with type 2 diabetes mellitus and blood glucose regulation: a marker for atherosclerosis? Int J Clin Exp Med. 2014;7(4):955–961.
20. Sapkota B, Shrestha S, Poudel S. Association of activated partial thromboplastin time and fibrinogen level in patients with type II diabetes mellitus. BMC Res Notes. 2013;6:485. doi:10.1186/1756-0500-6-485
21. Erem C, Hacıhasanoğlu A, Ş Ç, et al. Coagulation and Fibrinolysis Parameters in Type 2 Diabetic Patients with and without Diabetic Vascular Complications. Med Princ Pract. 2005;14(1):22–30. doi:10.1159/000081919
22. Abdulla AM, Elmissbah TE, Hamid EM, A-ltom FO, Faisal M. Assessment of Coagulation Process in Diabetic Patients using Prothrombin Time and Activated Thromboplastin Time Tests. Int J Multidiscip Curr Res. 2017;4(3):84–88.
23. Fadairo JK, Atere AD, Odunayo T, Abiodun OP. Assessment of Some Coagulation Indices among Type II Diabetic Subjects in a Tertiary Facility in South West Region, Nigeria. IOSR J Dent Med Sci:. 2016;15(6):159–163.
24. Thukral S, Hussain S, Bhat S, Kaur N, Reddy A. Prothrombin Time (PT) and Activated Partial Thromboplastin Time (APTT) in Type 2 Diabetes Mellitus, a Case-Control Study. Diab Mellit. 2018;5(8):H5–H9.
25. Banini AE, Boyd LC, Hoffman M. Elevated prothrombin level and shortened clotting times in subjects with type 2 diabetes. J Thromb Haemost. 2007;5(3):638–639. doi:10.1111/j.1538-7836.2007.02366.x
26. Awuku YA, Adu P, Ampomah LTW, et al. High risk of coagulopathy among Type-2 Diabetes Mellitus clients at a municipal hospital in Ghana. Ghana Med J. 2017;51(3):101–107. doi:10.4314/gmj.v51i3.2
27. George LA, Lambert MP. Coagulation Cascade and Fibrinolysis Pathway: Assessment In Nonmalignant Hematology. Cham: Springer International Publisher; 2016:221–233.
28. Swaminathan A, Amitkumar K, Ganapathy S, Ayyavoo S. Evaluation of mean platelet volume and other platelet parameters in subjects with Type-2 diabetes mellitus. Natl J Physiol Pharm Pharmacol. 2017;7(1):51–54. doi:10.5455/njppp.2016.6.0719518072016
29. Wilson Van Voorhis CR, Morgan BL. Understanding Power and Rules of Thumb for Determining Sample Sizes. Tutor Quant Methods Psychol. 2007;3(2):43–50. doi:10.20982/tqmp.03.2.p043
30. Onyema Eledo B. Assessment of some haemostatic parameters among diabetes mellitus patients in bayelsa state: a case study at the federal medical centre, Yenagoa. Eur J Clin Biomed Sci. 2017;3(5):91–96. doi:10.11648/j.ejcbs.20170305.12
31. Dhule S, Gawali S. Platelet aggregation and clotting time in type 2 diabetic males. Natl J Physiol Pharm Pharmacol. 2014;4(2):121–123. doi:10.5455/njppp.2014.4.290920131
32. Pujani M, Gahlawat H, Agarwal C, Chauhan V, Singh K, Lukhmana S. Platelet parameters: can they serve as biomarkers of glycemic control or development of complications in the evaluation of type 2 diabetes mellitus? Iraqi J Hematol. 2018;7(2):72–78. doi:10.4103/ijh.ijh_8_18
33. Biadgo B, Melku M, Mekonnen Abebe S, Abebe M. Hematological indices and their correlation with fasting blood glucose level and anthropometric measurements in type 2 diabetes mellitus patients in Gondar, Northwest Ethiopia. DiabetesMetabSyndrObes. 2016;9:91–99. doi:10.2147/DMSO
34. Dindar S, Cinemre H, Sengul E, Annakkaya A. Mean Platelet Volume is Associated with Glycaemic Control and Retinopathy in Patients with Type 2 Diabetes Mellitus. West Indian Med J. 62(6):519–523. doi: 10.7727/wimj.2012.284.
35. Akinsegun A, Olusola DA, Sarah J-O, et al. Mean platelet volume and platelet counts in type 2 Diabetes: mellitus on treatment and non-diabetic mellitus controls in Lagos, Nigeria. Pan Afr Med J. 2014;18:42. doi:10.11604/pamj.2014.18.42.3651
36. Citirik M, Beyazyildiz E, Simsek M, Beyazyildiz O, Haznedaroglu IC. MPV may reflect subclinical platelet activation in diabetic patients with and without diabetic retinopathy. Eye. 2015;29(3):376–379. doi:10.1038/eye.2014.298
37. Malachowska B, Tomasik B, Szadkowska A, et al. Altered Platelets’ morphological parameters in children with type 1 diabetes – a case-control study. BMC Endocr Disord. 2015;15(17):1–7. doi:10.1186/1472-6823-15-1
38. Isaac IZEO. Some Haematological Parameters in Patients with Type-1 Diabetes in Sokoto, North-Western Nigeria. J Blood Lymph. 2012;03(01):1–4. doi:10.4172/2165-7831.1000110
39. Keating FK, Sobel BE, Schneider DJ. Effects of increased concentrations of glucose on platelet reactivity in healthy subjects and patients with and without diabetes mellitus. Am J Cardiol. 2003;92(11):1362–1365. doi:10.1016/j.amjcard.2003.08.033
40. Chen X, Fang L, Lin H, et al. The Relationship between Type 2 Diabetes and Platelet Indicators. Iran J Public Health. 2017;46(6):1211–1216.
41. Indranila KS. Molecular aspect correlation between glycated hemoglobin (hba1c), prothrombin time (pt) and activated partial thromboplastin time (aptt) on type 2 diabetes mellitus (t2dm). Indones J Clin Pathol Med Lab. 2016;23(1):1–6.
42. Nnenna I, Obioma A. Evaluation of Haemostatic Parameters of Diabetic Patients Accessing Care in Some Selected Health Care Facilities in Port Harcourt Metropolis, Nigeria. Sci Technol. 2016;3(2):119–134.
43. Ziaee A, Ghorbani A, Kalbasi S, Hejrati A, Moradi S. Association of hematological indices with prediabetes: A cross-sectional study. Electron Physician. 2017;9(9):5206–5211. doi:10.19082/5206
 © 2021 The Author(s). This work is published and licensed by Dove Medical Press Limited. The
full terms of this license are available at https://www.dovepress.com/terms
and incorporate the Creative Commons Attribution
- Non Commercial (unported, 3.0) License.
By accessing the work you hereby accept the Terms. Non-commercial uses of the work are permitted
without any further permission from Dove Medical Press Limited, provided the work is properly
attributed. For permission for commercial use of this work, please see paragraphs 4.2 and 5 of our Terms.
© 2021 The Author(s). This work is published and licensed by Dove Medical Press Limited. The
full terms of this license are available at https://www.dovepress.com/terms
and incorporate the Creative Commons Attribution
- Non Commercial (unported, 3.0) License.
By accessing the work you hereby accept the Terms. Non-commercial uses of the work are permitted
without any further permission from Dove Medical Press Limited, provided the work is properly
attributed. For permission for commercial use of this work, please see paragraphs 4.2 and 5 of our Terms.