Back to Journals » Clinical Ophthalmology » Volume 15
Axial Length in Patients with Myopia and Interpretation of Pattern Electroretinogram Recordings
Authors Grudzińska E ![]() , Modrzejewska M
, Modrzejewska M ![]()
Received 3 March 2021
Accepted for publication 7 May 2021
Published 29 June 2021 Volume 2021:15 Pages 2815—2821
DOI https://doi.org/10.2147/OPTH.S308604
Checked for plagiarism Yes
Review by Single anonymous peer review
Peer reviewer comments 3
Editor who approved publication: Dr Scott Fraser
Ewa Grudzińska, Monika Modrzejewska
2nd Department of Ophthalmology, Pomeranian Medical University, Szczecin, Poland
Correspondence: Monika Modrzejewska
2nd Department of Ophthalmology, Pomeranian Medical University, Powstańców Wielkopolskich 72, Szczecin, 70-111, Poland
Tel +48 91 4661293
Fax +48 91 466 1294
Email [email protected]
Purpose: To assess pattern electroretinogram (PERG) recordings in patients with axial myopia with a special focus on the correct interpretation of findings.
Patients and Methods: Sixty patients divided into three groups according to the spherical equivalent of refractive error (group 1, error − 3 D to − 6 D; group 2, error > − 6 D; and controls, error − 1 D to +1 D) were examined. Data for the right eye of every patient were considered in the statistical analysis. All patients had a full ophthalmic examination including the measurement of visual acuity, intraocular pressure, degree of refractive error, axial length, biomicroscopic evaluation of the anterior segment, fundoscopy and PERG. The differences of basic parameters and P50 and N95 amplitudes as well as P50 implicit time between groups were studied. Correlations between P50 and N95 amplitudes and P50 implicit time were axial length and refractive error was established.
Results: The P50 amplitude, N95 amplitude and P50 peak time differed significantly between the groups (P< 0.01). No significant differences were found for the N95/P50 ratio. Significantly lower P50 and N95 amplitudes (r=− 0.42, P< 0.01; r=− 0.42, P< 0.01) and increased P50 peak time (r=0.64, P< 0.01) correlated with elongated axial length. A 1-mm increase in axial length corresponded with a 0.41 μV decrease in the P50 amplitude and 0.55 μV reduction of the N95 amplitude. There was also 1.11 ms increase of P50 wave peak time per 1 mm increase of axial length. Significantly lower amplitudes and longer peak times are associated with increased axial length and increased refractive error.
Conclusion: According to results observed in this study, the correct interpretation of PERG recordings requires the consideration of axial length.
Keywords: refractive error, P50 amplitude, N95 amplitude, P50 peak time, eyeball length
Introduction
Pattern electroretinography (PERG) provides a measure of retinal function. The PERG signal evoked by stimulation with a reversing pattern is the response of retinal cells in the form of changing potentials. The signal mainly comes from retinal ganglion cells, photoreceptors and bipolar cells, and thus allows for the assessment of their functional integrity.1 With this technique, functional changes can be detected before the onset of structural changes, and thus appropriate early treatment can be introduced.2 PERG is a diagnostic technique used for the differentiation between retinal and optic nerve dysfunction, and also for the detection of retinal ganglion cell dysfunctions, particularly in patients with glaucoma or optic neuropathies.1
Myopia is the most common refractive error. Because of the increase in its incidence and potential clinically significant complications, many studies have investigated this problem. The relationship between the axial length and responses in flash ERG have been well investigated. Studies revealed a significant reduction in a- and b-wave amplitudes that was more closely associated with the axial length than the degree of the refractive error. Researchers have suggested that the interpretation of ERG recordings from individuals with increased axial length has to be very careful.3,4 Another study investigating ERG in myopic eyes reported a relationship between longer peak times and reduced amplitude.5
We searched for reports on the use of PERG in myopia, and because of their limited number decided to perform a study to assess the relationship between PERG recordings in healthy people with axial myopia, with a particular focus on the correct interpretation of tests in this population of patients.6–9 Lubiński found abnormal ganglion cell function in 30% patients with myopia, suggesting that reduction of PERG waves could predict progression of the disease.6 Whereas Hidajat et al calculated P50 amplitude change per 1 mm elongation of axial length.7 Furthermore Oner et al showed correlations between amplitudes of P50 and N95 waves and axial length, but they have not calculated a change of amplitudes per 1 mm elongation of axial length, which could be clinically useful.8,9
Materials and Methods
The study protocol was compliant with the requirements of the Declaration of Helsinki and approved by the Bioethics Committee of the Pomeranian Medical University in Szczecin (Approval No. KB-0012/154/17). Participants in the study were referred to this research project from ophthalmological clinics in Szczecin and the surrounding area. Sixty participants who signed informed consent were included in the study. Three groups were established, with 20 people in each group: controls with emmetropia (refractive error between +1 D and −1 D), subjects with moderate myopia (error between −3 D and −6 D) and subjects with high myopia (error greater than −6 D). In each group, the ratio of women to men was 3:1 (15 women: 5 men). Inclusion criteria were: patients with myopia, age 20–40 years, no systemic or ophthalmological comorbidities. The exclusion criteria were: taking any medications, either systemic or topical, degenerative changes in the eye fundus, except retinal thinning, history of ophthalmic surgery, amblyopia and strabismus. Additional exclusion criteria were: astigmatism >2 Dcyl, corneal disease, cataract, intraocular pressure >21 mmHg, c/d>0.6, best corrected visual acuity worse than 0.0 logMAR, optic disc hemorrhages, notches or local pallor.
All subjects had a full ophthalmic examination to assess best corrected visual acuity (ETDRS charts), intraocular pressure (Pascal, Swiss), degree of refractive error after the application of 1% tropicamide (Topcon KR-800 autorefractometer, Tokyo, Japan), axial length (IOL Master 700, Carl Zeiss, Meditec AG, Jena, Germany), the anterior segment of the eye using a slit lamp, and fundus examination by indirect ophthalmoscopy (Volk 90 D lens). Refractive error was converted into spherical equivalent. The threshold for cylindrical correction was −2.0 Dcyl.
PERG was performed consistently with the ISCEV standard.1 The RetiPort (Roland Consult) electordiagnostic system with a 21“ CRT display and a frequency of 75 Hz was used. The test was done in a room with ordinary lighting. The stimulus for PERG was a black and white reversing checkerboard, with a check size of 0.96°. The contrast between black and white squares was set at 97% (reversal contrast modulation mode) and luminance of display at 120 cd/m2. The frequency of stimulus was 2.35 Hz (4.7 reversals/second). The PERG was recorded without dilation of the pupils, and patients were wearing optical correction for the 0.5 m test distance (appropriate trial lenses), seated and with chin supported. The system of electrode leads included: an active corneal electrode (DTL-fiber electrode),1 positioned above the lower eyelid, in constant contact with the cornea; a passive gold cup electrode, positioned in the outer canthus of the eye; and a ground gold cup electrode, positioned on the forehead. The electrical resistance was maintained at <5 kΩ. One eye was tested at a time, with a central fixation. An average value from 200 runs was calculated, and then the two series of responses were additionally averaged in the off-line procedure. The bandwidth of recording was 1–100 Hz, and analysis time 250 ms with switched off notch filters. The P50 amplitude, the N95 amplitude, the P50 peak time, and the N95/P50 amplitude ratios were measured.
Acquired data were analyzed using Statistica 13 software (Tibco Software Inc., Tulsa, OK, USA). Results were considered significant at P<0.05. Only data for the right eye of each participant were included in the analysis. The following tests were used for statistical analysis: Kruskal–Wallis ANOVA, the Shapiro–Wilk test, the r-Pearson test, the Spearman rank test and regression analysis. Correlation analysis was done for data acquired from all study participants.
Results
There were no significant differences between the groups in terms of sex, age, body height and weight, BMI, blood pressure, or heart rate. Detailed parameters of patients are presented in Table 1. Axial length was in the range of 21.83–29.06 mm, and the spherical equivalent of refractive error ranged from 1 D to −13.5 D. Figure 1 shows PERG traces representative for individuals of the particular group.
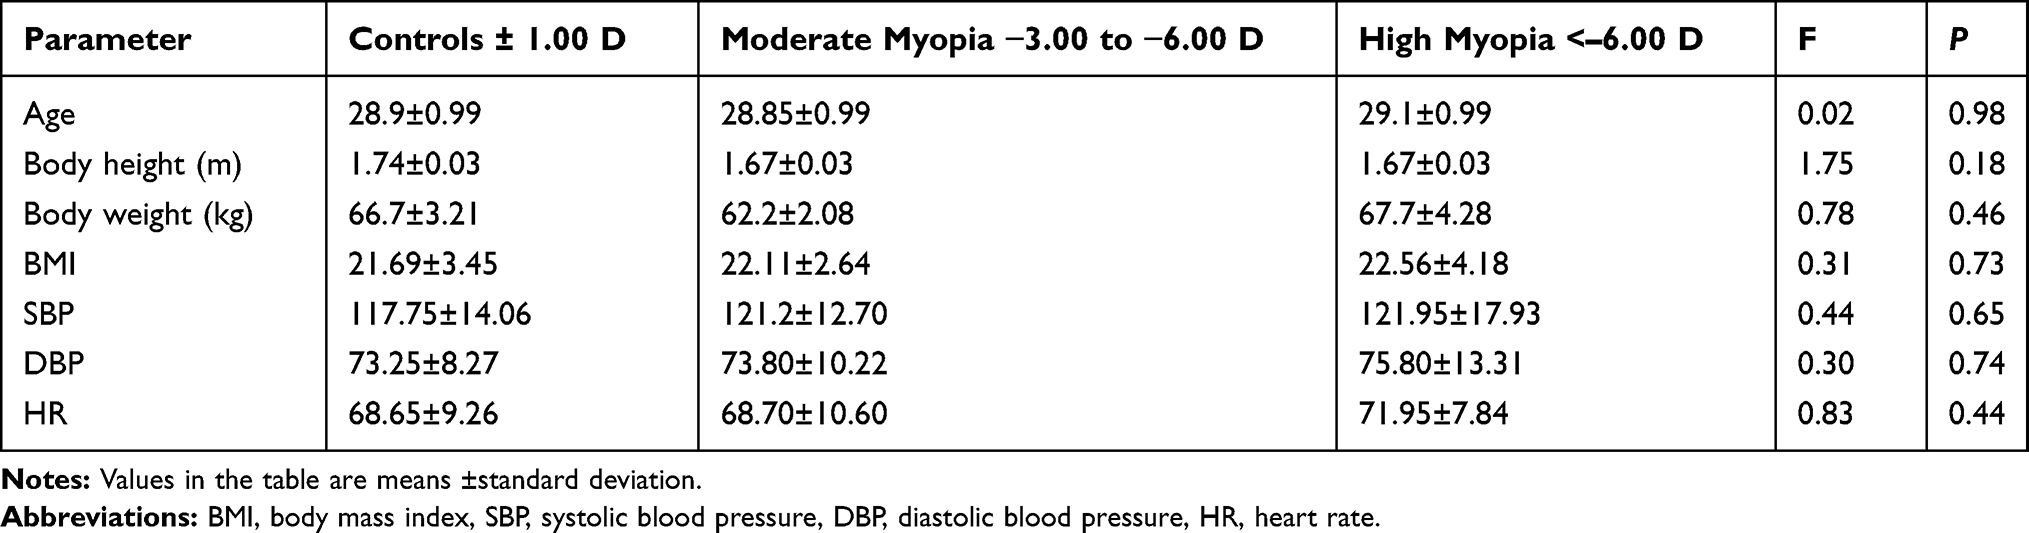 |
Table 1 Basic Parameters of the Analyzed Subjects |
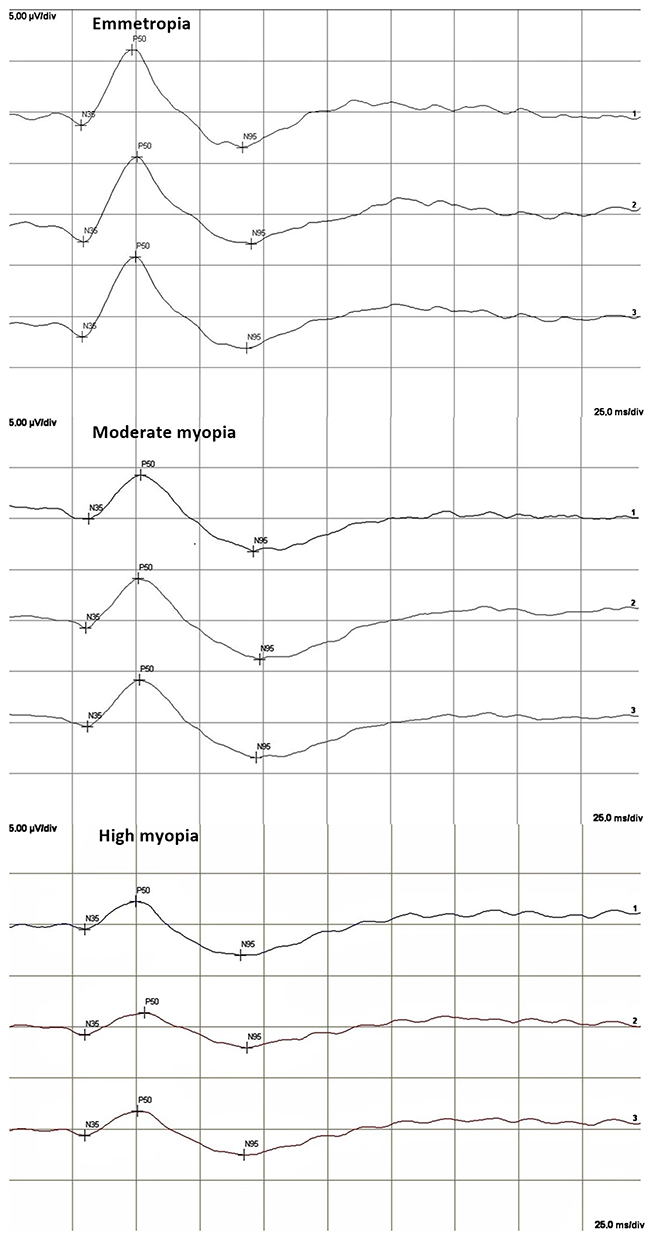 |
Figure 1 PERG-traces representative for individuals of the particular group. |
A significant correlation was found between reduced P50 and N95 amplitudes and increased axial length (r=−0.45, P<0.01; r=−0.44, P<0.01, respectively) (Figure 2). There was a significant positive correlation between the P50 peak time and axial length (r=0.56, P<0.01) (Figure 2). Similar but inverse correlations were found between amplitudes and peak time, and spherical equivalent of refractive error (Figure 2). Table 2 presents mean values of parameters measured in all the examined groups. The post hoc test revealed significant differences in P50 wave peak time between controls and subjects with moderate myopia or high myopia (P<0.05), but not between those with moderate and high myopia. The analysis of P50 and N95 amplitudes showed significant differences between controls and subjects with high myopia (P<0.05). No significant differences between groups were found for the N95/P50 ratio.
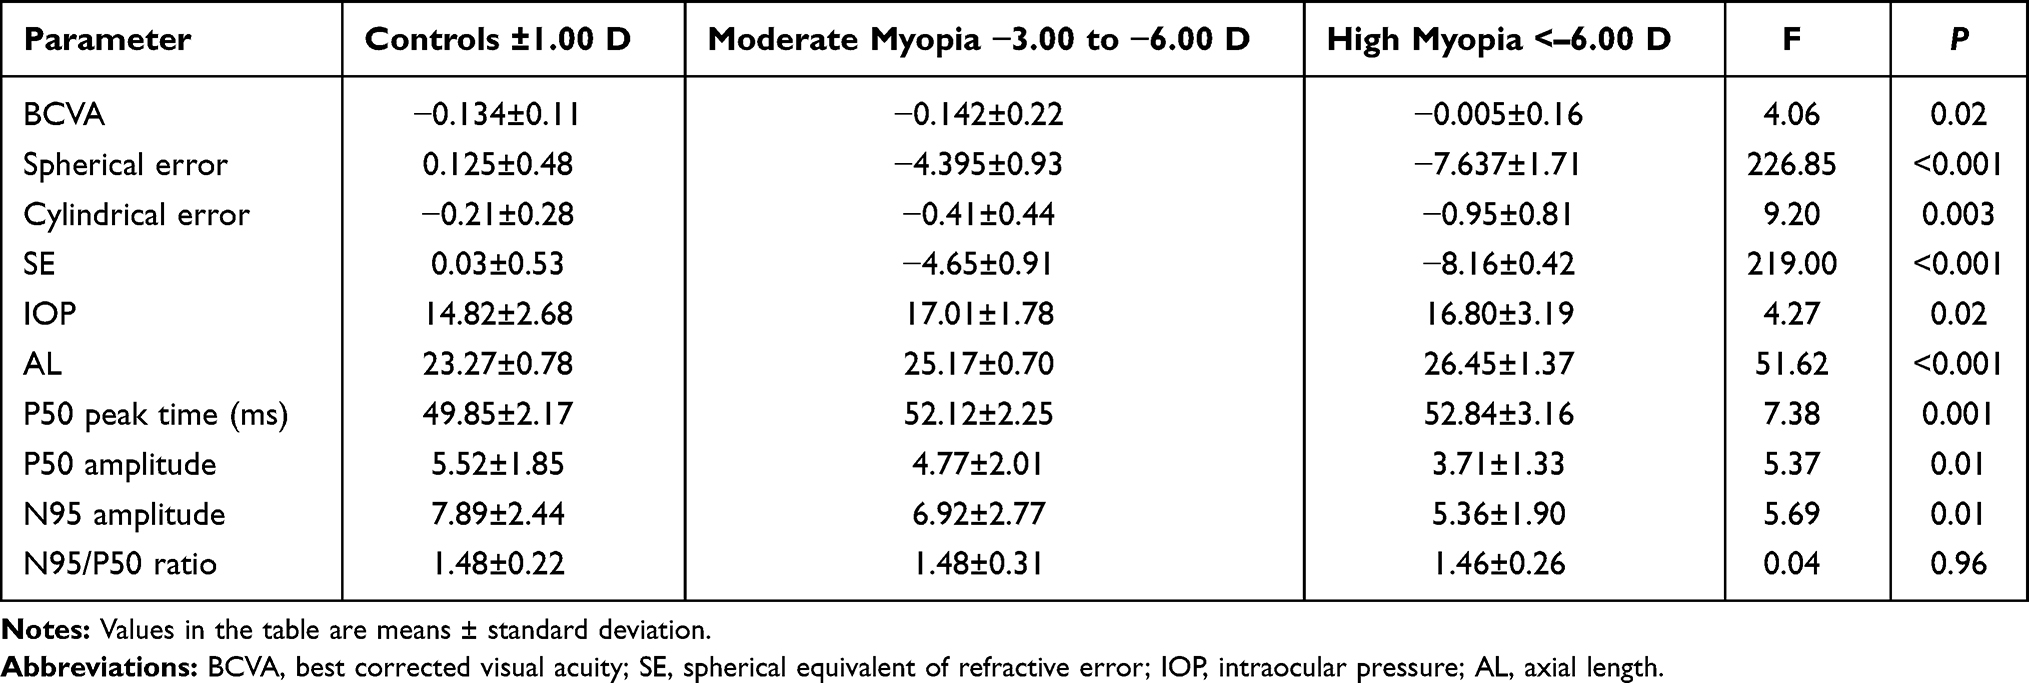 |
Table 2 Parameters Measured in Analyzed Groups |
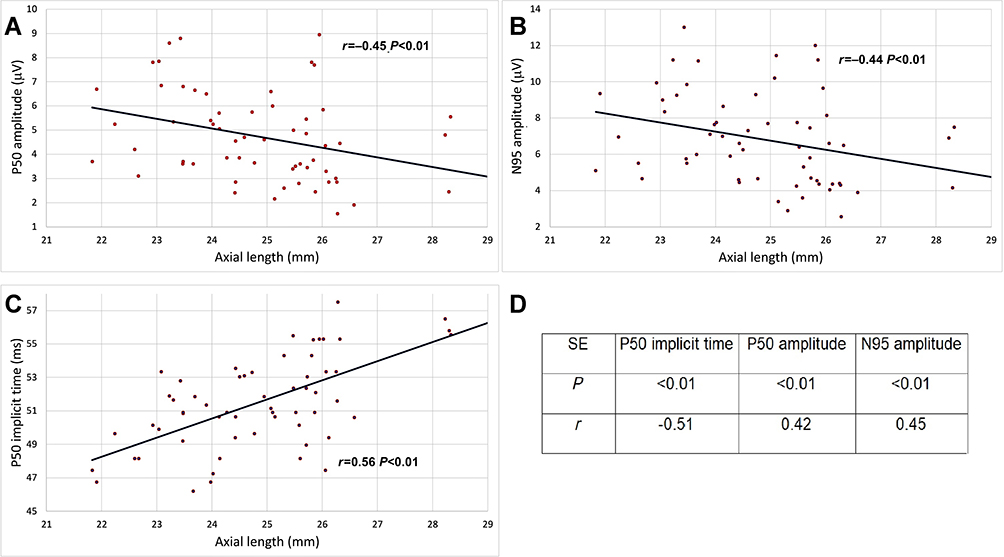 |
Figure 2 (A) Correlation of P50 amplitude and AL. (B) Correlation of N95 amplitude and AL. (C) Correlation of P50 implicit time and AL, (D) Correlation between spherical equivalent of refractive error and P50 and N95 amplitude and P50 implicit time. Abbreviations: AL, axial length; SE, spherical equivalent of refractive error; P, level of significance; r, coefficient of correlation. |
A 1-mm increase in axial length corresponded with a 0.41 µV decrease in the P50 amplitude, which for the mean axial length of 23.3 mm corresponded with a marked 7.3% decrease (Figure 2). The analysis also demonstrated that reduction of the N95 amplitude per 1 mm eyeball elongation was 0.55 µV (6.8%) (Figure 2). There was also 1.11 ms increase of P50 wave peak time per 1 mm increase of axial length (2.2%) (Figure 2).
Discussion
The analysis of findings from PERG should take into account the effect of degeneration in individual layers of the retina on recordings. PERG is a special type of electroretinography, so the principles used for the interpretation of results are similar. Studies employing ERG demonstrated that damage to the peripheral layers of the retina corresponds with reduced response amplitudes, while delayed responses with normal amplitude result from damage in other retinal layers, which may be associated with disturbed synaptic transmission or damage to the inner plexiform layer.10 Conversely, Wolsley et al emphasized the relationship between abnormal function of the post-receptor retina (including the effect of bipolar cells on MF-ERG) and retinal structure (from the middle to the inner layers) in high myopia, where retinal thickness is decreased.11 Chen et al reported that increased axial length alone does not explain increased amplitudes measured by MF-ERG. He suggested that there must be some difference in the retinal function in myopic subjects, which could be explained by abnormal synaptic transport to the system of bipolar cells or a change in the dopaminergic system that affects ganglion cell function.12
Furthermore, Kader found a decrease in the amplitude of b-wave and a delay in the latency of standard ERG in high myopia. In her study, there was significant difference of ERG values between high myopia and emmetropia while there was no significant difference between mild and medium myopia and emmetropia. There were also marked reductions of amplitudes of b-waves of ERG in pathological myopia which were proportional to the axial length.13
Previous reports on the use of PERG in myopic subjects have suggested impaired retinal response, but the small number of studies and the different methodologies used by their authors do not allow for a conclusive determination of the correct interpretation of PERG recordings in myopia.6–9
Only one report by Hidajat et al showed the change in P50 values per 1 mm elongation of the eyeball. Hidajat et al analyzed values for a mean axial length of 23.8 mm and found an 11.6% decrease in the P50 amplitude for every millimeter increase in axial length.7 Our analysis demonstrated that a 1-mm increase in axial length corresponded with a 0.41 µV decrease in P50 amplitude, which for a mean axial length of 23.3 mm means a marked 7.3% decrease in P50 amplitude per mm increase in axial length. The study by Hidajat et al showed a significant negative correlation between P50 amplitude and axial length, which is consistent with our findings. Hidajat et al did not present details on the correlation between P50 peak time and axial length, which was clear in our study. The discrepancy may result from a wider range of axial length in the reported study (21.83–29.06 mm vs 21.8–25.7 mm), and the fact that patients with a refractive error > −6D were included in the analysis, but excluded in the previous research project.7 This explanation is supported by the observations of other authors, who found significant differences in MF-ERG peak times between emmetropes, and patients with moderate (−3.25 to −6.0 D) and high myopia (greater than −6.25 D), but no differences in peak times between patients with mild myopia (−0.5 D to −3.0 D) and emmetropia.13
Another study which analyzed PERG in myopic patients was conducted by Lubiński, but they used a steady-state variant of PERG and analyzed peak-to-peak values, which does not allow for a direct comparison to the results obtained in our study. Lubiński found abnormal bioelectrical function of ganglion cells in as many as 30% of the examined eyes with myopia grade −4 to −8 D, which resulted in a significant reduction of PERG peak-to-peak values compared to the control group. The researchers suggested that PERG may be useful for predicting the progression of the disease.6 In contrast, our study revealed the dysfunction of retinal ganglion cells reflected in the values of N95 amplitude in 70% of patients with moderate myopia and in 95% of patients with high myopia.
Oner et al reported findings from PERG in four groups divided depending on the grade of myopia, but the analysis included left and right eyes in every patient, which could slightly bias results. Consistently with our study, Oner et al found differences between groups in P50 and N95 amplitudes and correlations between the refractive error and P50 and N95 amplitudes, but no differences in peak times between the groups.8 In an earlier study following the same methodology, Oner et al analyzed only the right eye in every patient. They reported a positive correlation between the refractive error and axial length, and a negative correlation between the refractive error and P50 and N95 amplitudes, which conforms with our findings. Oner et al concluded that the lower P50 amplitude may be associated with macular dysfunction despite its normal appearance in fundoscopy and good visual acuity,9 while reduced N95 amplitude implies the abnormal function of ganglion cells.8 In the study by Oner et al there were also significant differences between the analyzed groups in P50 and N95 amplitudes, but not in P50 wave peak time. The identified correlation between peak times and axial length was not analyzed.9 Differences in the N95/P50 ratio were also observed, and this ratio was markedly lower in subjects with moderate and high myopia, which could be associated with the fact that subjects with myopic maculopathy were included.9 The present study did not reveal significant differences in the N95/P50 ratio, which may indicate a coexisting dysfunction of the macula and ganglion cells in myopic subjects.
Most probably, there are many mechanisms in myopia which are responsible for changes in PERG waves, such as decreased circulation, retina stretching, lower dopamine levels, which are more pronounced when minus spherical equivalent is rising. Presumably some of these changes may be due to myopic maculopathy the incidence of which rises with the increase of the value of refractive error.
A further problem is the magnification of the stimulation pattern due to the use of correction lenses. In our examination the check size was 0.96°. As we found in the literature, checks lower than 2° not only decrease check size, but also retinal contrast that could result in a decline of amplitude, especially when the check size becomes smaller than 0.8°. That effect is caused by optical properties of the eye and declining number of correspondingly small receptive fields.14 We calculated that with the use of −10 D lens check size is about 0.92°, however, we can not predict its influence on PERG results. This effect needs further research and with high probability it has influence on our findings.
Conclusion
The correct interpretation of PERG recordings requires the consideration of axial length. Reduced P50 and N95 amplitudes and delayed P50 peak time are correlated with increased axial length and degree of refractive error. The pathomechanism of these changes remains unclear. Research in a larger population of patients is required to determine appropriate conversion factors for the correct interpretation of PERG recordings in subjects with high grade myopia.
Acknowledgments
This research received no specific grant from any funding agency in the public, commercial, or not-for-profit sectors.
Disclosure
The authors report no conflicts of interest in this work.
References
1. Bach M, Brigell MG, Hawlina M, et al. ISCEV standard for clinical pattern electroretinography (PERG): 2012 update. Doc Ophthalmol. 2013;126(1):1–7. doi:10.1007/s10633-012-9353-y
2. North RV, Jones AL, Drasdo N, Wild JM, Morgan JE. Electrophysiological evidence of early functional damage in glaucoma and ocular hypertension. Investig Ophthalmol Vis Sci. 2010;51(2):1216–1222. doi:10.1167/iovs.09-3409
3. Sachidanandam R, Ravi P, Sen P. Effect of axial length on full-field and multifocal electroretinograms. Clin Exp Optom. 2017;100(6):668–675. doi:10.1111/cxo.12529
4. Westall CA, Dhaliwal HS, Panton CM, et al. Values of electroretinogram responses according to axial length. Doc Ophthalmol. 2001;102(2):115–130. doi:10.1023/A:1017535207481
5. Ismael ZF, El-Shazly AAEF, Farweez YA, Osman MMM. Relationship between functional and structural retinal changes in myopic eyes. Clin Exp Optom. 2017;100(6):695–703. doi:10.1111/cxo.12527
6. Lubiński W. Elektroretinogram typu “pattern” w oczach z krótkowzrocznością średniego stopnia. Klin Oczna. 2020;93(10–11):284–285.
7. Hidajat R, Mclay J, Burley C, Elder M, Morton J, Goode D. Influence of axial length of normal eyes on PERG. Doc Ophthalmol. 2003;107(2):195–200. doi:10.1023/A:1026282425885
8. Oner A, Gumus K, Arda H, Karakucuk SME. Pattern electroretinographic recordings in eyes with myopia. Erciyes Med J. 2011;33(1):017–022e.
9. Oner A, Gumus K, Arda H, Karakucuk S, Mirza E. Pattern electroretinographic recordings in eyes with myopia. Eye Contact Len. 2009;35(5):238–241. doi:10.1097/ICL.0b013e3181b343d9
10. Hood DC. Assessing retinal function with the multifocal technique. Prog Retin Eye Res. 2000;19:607–646.
11. Wolsley CJ, Saunders KJ, Silvestri G, Anderson RS. Investigation of changes in the myopic retina using multifocal electroretinograms, optical coherence tomography and peripheral resolution acuity. Vision Res. 2008;48(14):1554–1561. doi:10.1016/j.visres.2008.04.013
12. Chen JC, Brown B, Schmid KL. Delayed mfERG responses in myopia. Vision Res. 2006;46(8–9):1221–1229. doi:10.1016/j.visres.2005.06.030
13. Kader MA. Electrophysiological study of myopia. Saudi J Ophthalmol. 2012;26(1):91–99. doi:10.1016/j.sjopt.2011.08.002
14. Heckenlively JR, Arden GB, Nusinowitz S, Holder GE, Bach M. Principles and Practice of Clinical Electrophysiology of Vision. MIT Press; 2006.
 © 2021 The Author(s). This work is published and licensed by Dove Medical Press Limited. The
full terms of this license are available at https://www.dovepress.com/terms
and incorporate the Creative Commons Attribution
- Non Commercial (unported, 3.0) License.
By accessing the work you hereby accept the Terms. Non-commercial uses of the work are permitted
without any further permission from Dove Medical Press Limited, provided the work is properly
attributed. For permission for commercial use of this work, please see paragraphs 4.2 and 5 of our Terms.
© 2021 The Author(s). This work is published and licensed by Dove Medical Press Limited. The
full terms of this license are available at https://www.dovepress.com/terms
and incorporate the Creative Commons Attribution
- Non Commercial (unported, 3.0) License.
By accessing the work you hereby accept the Terms. Non-commercial uses of the work are permitted
without any further permission from Dove Medical Press Limited, provided the work is properly
attributed. For permission for commercial use of this work, please see paragraphs 4.2 and 5 of our Terms.