Back to Journals » Neuropsychiatric Disease and Treatment » Volume 16
Autonomic Nervous System Is Related to Inhibitory and Control Function Through Functional Inter-Region Connectivities of OFC in Major Depression
Authors Zhou H, Hua L, Jiang H, Dai Z, Han Y ![]() , Lin P, Wang H, Lu Q, Yao Z
, Lin P, Wang H, Lu Q, Yao Z
Received 10 November 2019
Accepted for publication 30 December 2019
Published 21 January 2020 Volume 2020:16 Pages 235—247
DOI https://doi.org/10.2147/NDT.S238044
Checked for plagiarism Yes
Review by Single anonymous peer review
Peer reviewer comments 2
Editor who approved publication: Dr Yu-Ping Ning
Hongliang Zhou, 1 Lingling Hua, 1 Haiteng Jiang, 2 Zongpeng Dai, 2 Yinglin Han, 1 Pinhua Lin, 1 Haofei Wang, 1 Qing Lu, 2, 3 Zhijian Yao 1, 4
1Department of Psychiatry, The Affiliated Brain Hospital of Nanjing Medical University, Nanjing 210029, People’s Republic of China; 2School of Biological Sciences & Medical Engineering, Southeast University, Nanjing 210096, People’s Republic of China; 3Child Development and Learning Science, Key Laboratory of Ministry of Education, Nanjing 210096, People’s Republic of China; 4Nanjing Brain Hospital, Medical School of Nanjing University, Nanjing 210093, People’s Republic of China
Correspondence: Zhijian Yao
Department of Psychiatry, The Affiliated Brain Hospital of Nanjing Medical University, Nanjing 210029, People’s Republic of China
Tel +8625 8229600
Fax +8625 82296000
Email [email protected]
Qing Lu
School of Biological Sciences & Medical Engineering, Southeast University, Nanjing 210096, People’s Republic of China
Tel/Fax +8625 83792349
Email [email protected]
Objective: To investigate the mechanism of interactions between autonomic nervous system (ANS) and cognitive function in Major depression (MD) with Magnetoencephalography (MEG) measurements.
Methods: Participants with MD (n = 20), and Health controls (HCs, n = 18) were completed MEG measurements during the performance of a go/no-go task. Heart rate variability (HRV) indices (SDANN, and RMSSD) were derived from the raw MEG data. The correlation analysis of the HRV and functional connectivities in different brain regions was conducted by Pearson’s r in two groups.
Results: The go/no-go task performances of HCs were better than MD patients; HRV indices were lower in the MD group. Under the no-go task, a brain MEG functional connectivity analysis based on the seed regions of the orbitofrontal cortex (OFC) displayed increased functional inter-region connectivity networks of OFC in MD group. HRV indices were correlated with different functional inter-region connectivity networks of OFC in two groups, respectively.
Conclusion: ANS is related to inhibitory and control function through functional inter-region connectivity networks of OFC in MD. These findings have important implications for the understanding pathophysiology of MD, and MEG may provide an image-guided tool for interventions.
Keywords: major depression, magnetoencephalography, heart rate variability, functional connectivity, the orbitofrontal cortex
Introduction
Major depression (MD) is a more severe state of depressive symptomatology in which patients present multiple depressive symptoms and show significant distress or impaired functioning. Of multiple depressive symptoms, cognitive impairments are common in MD.1
Cognitive function refers to the ability to conduct the mental actions or processes of knowledge acquisition and understanding through thought, experience, and the senses. Cognitive dysfunction is prevalent and is associated with earlier onset of depression and longer episode of duration in MD patients, and it has an adverse impact on treatment outcomes as well as on functional recovery.2 Inhibitory and control function is a critical cognitive function (executive function) of the cerebrum and is necessary for the cognitive control of behavior. The go/no-go task has been used to investigate response inhibition.3 Under the go/no-go task, previous many studies with event-related potentials (ERPs) and functional magnetic resonance imaging (fMRI) reported that MD patients displayed impairments of inhibitory and control function.4–7 However, a recent study showed that MD patients displayed no abnormal neural responses to the go/no-go task.8 One reason why these study results did not come to an agreement may be the deficient spatial resolution of ERPs and the temporal resolution of fMRI.
Magnetoencephalography (MEG) is a noninvasive functional neuroimaging technique that has better temporal and spatial resolution, and it maps brain activity by using very sensitive magnetometers to record the magnetic fields that are produced by the electrical currents that naturally occur in the brain, and it has been used for the investigations of the neural mechanism of many cognitive functions.9–11 Functional connectivity measures how brain regions are temporally coordinated and is employed to probe brain network architecture.12 In recent decades, MEG has been used for the study of the pathogenic mechanisms of MD and is particularly useful for investigations of brain cortical activity and functional connectivity.13,14 A number of network-based studies have indicated that MD is receiving increased recognition for its abnormal inter-regional and intraregional connectivity interactions in both local and distributed networks within the brain.15
Individual’s autonomic nervous system (ANS) functioning relies on a balance between the activities of the sympathetic and parasympathetic nervous systems, which can be measured with heart rate variability (HRV). HRV refers to the variation in time between consecutive heartbeats, and it has been used as a non-invasive marker of ANS function.16 Time-domain analysis, frequency-domain analysis and a non-linear complexity measure were used for HRV analysis. The standard deviation of all RR intervals (SDNN) and the square root of the mean squared differences of successive normal sinus intervals (RMSSD) are components of HRV by the time-domain analysis. Studies indicated that variations in the high-frequency bandwidth of the heart rate represent ANS activity, and RMSSD is sensitive to high-frequency heart period fluctuations in the respiratory frequency range; therefore, RMSSD can be regarded as representing the flexibility of vagal (parasympathetic) tone and the general capacity of the ANS to respond to changing environmental conditions in an adaptive way.17–19
Autonomic dysfunction is found in MD and may be a central biological substrate linking major depression to a number of physical dysfunctions. Alterations of autonomic nervous system functioning that promotes vagal withdrawal are reflected in the decreased HRV indices.20 Many studies have displayed that MD patients present the decreased HRV indices and HRV can be used as an index of the association between major depression and autonomic dysregulation.21–23 Additionally, the combined positron emission tomography (PET) or fMRI and electrocardiography (ECG) study have confirmed that the neural correlates of autonomic control by measuring both HRV and associated brain activity during the measurement of neuropsychological tests.24,25
Previous studies showed that HRV has a critical effect on cognitive function in humans.26–28 Furthermore, many studies reported the major role of biofeedback training for MD patients is the improvement of the cognitive functions by regulating the balance between the parasympathetic and sympathetic nervous system function.29–31 These results may confirm that the regulation of the ANS can improve cognitive function in MD.
To sum up, MD patients present cognitive dysfunctions, and the regulation of the ANS can improve cognitive function in MD. MEG in humans allows inter-regional and intraregional connectivity interactions in brain function to be related to perception, thinking, reasoning and feeling, which can provide mechanistic insight into interactions between the autonomic nervous system and the cognitive function. Understanding the neural mechanisms of interactions between the ANS and cognitive function in MD is helpful for its prevention, diagnosis and treatment. However, up to date, the neural mechanism of interactions between the ANS and inhibitory and control function in MD has been still unclear.
In this study, the ANS function was assessed with HRV indices (SDANN and RMSSD), the cognitive function (inhibitory and control function) was measured with a go/no-go task, and brain cortical activity and functional connectivity were measured with MEG. In order to guarantee cognition along different psychophysiological dimensions, the HRV indices (RR interval segment duration (RR), SDANN and RMSSD) were derived from the raw MEG data. The simultaneous measurement of an autonomic parameter during MEG of cognitive processing provided a means of dissecting neural substrates. The purpose of this study was to determine the mechanism of interactions between ANS and cognitive function (inhibitory and control function) in MD. We hypothesized the interactions between the ANS and cognitive dysfunction (inhibitory and control function) were formed through some functional inter-region connectivities in MD.
Method
Time and Setting
The experiment was completed in Department of Psychiatry, Affiliated Nanjing Brain Hospital of Nanjing Medical University, Nanjing, People’s Republic of China, from January 01, 2018, to February 28, 2019.
Diagnostic Approaches and Participants
The present study included an MD group and an HC group. The criteria for inclusion in the MD group included 1) met only the criteria for major depression in the Diagnostic and Statistical Manual of Mental Disorders, Fifth edition (DSM-5); 2) age range from 18 years old to 60 years old; 3) Hamilton Depression Scale (17-item edition, HAMD) scores were no less than 17; 4) the onset of depression was no less than twice; 5) did not take any medicine within the last 2 weeks; 6) did not receive electroconvulsive treatment within the last month; 7) did not have a prior diagnosis of alcohol, nicotine or other substance dependence or of any type of head injury, neurological disorder or systemic disease that might affect the central nervous system; and 8) had no contraindication for the MEG measurements. The criteria of for inclusion in the HC group included: 1) did not meet the criteria for any DSM-5 axis I disorder or personality disorders, as determined by the Structured Clinical Interview for DSM-5 (SCID-5, Chinese version); 2) age range from 18 years old to 60 years old; 3) HAMD (17-item edition) scores were no more than 17; 4) no history of any kind of mental disorder; 5) did not have a prior diagnosis of alcohol, nicotine or other substance dependence; and 6) did not have a prior diagnosis of any kind of head injury, neurological disorder or systemic disease that might affect the central nervous system.
In this study, 20 patients with MD were recruited as subjects (they all were inpatients) according to their order of hospitalization. Eighteen healthy persons were recruited as healthy controls. The healthy controls were recruited from a group of citizens who lived in Nanjing City, Jiangsu Province, People’s Republic of China, through local advertisement. All of the participants were Chinese.
All participants were forbidden to drink any coffee or tea on the day of the test session. In addition, to reduce the stress caused by the MEG examination, patients were informed the whole process of the research and were asked to fit the environment in advance after 8 mins resting.
On the day of the MEG recording, the participants were interviewed by a psychiatric associate chief physician and a psychiatric resident physician to collect their medication information, demographic data, clinical characteristics, and confirm/exclude a diagnosis of major depressive disorder. The Annett handedness scale32 was used for the assessments of handedness, and the handedness was defined as follows: Annett score (1) = right, (2–7) = mixed, (8) = left.
All of the experimental procedures were approved by the Ethics Committee on Human Studies, Affiliated Nanjing Brain Hospital of Nanjing Medical University, Nanjing, People’s Republic of China, and they were conducted in accordance with the Declaration of Helsinki. All of the patients and healthy controls provided their written informed consent to participate, and all were compensated 300.00 Chinese Yuan (CNY) plus travel expenses for their participation. Since the ability of the patients to consent was considered to be compromised, written informed consent on the behalf of each patient was also obtained from their legal guardians, who were also provided with the content of all of the experimental procedures.
MEG Task and Procedure
The Go/No-Go Task
BrainX software, which was based on DirectX software (Microsoft Corporation, Redmond, WA, USA), was used for editing the experimental procedures for the go/no-go task. There are 352 stimuli in this task that total 5 mins in duration. The go/no-go task consisted of three stimuli: red lamp picture, green lamp picture and gray cross. These stimuli with white on a black background (1.5×1.5 cm in size) and were serially presented on a computer screen. The procedures for the go/no-go task first included a 2500 ms (ms) gray cross presentation followed by a 500 ms green lamp presentation, a 150 ms blank, and then a 400 ms red lamp; after the red lamp presentation, there was a 300 ms intertrial interval (ITI). The red lamp picture randomly appeared. In this task, the green lamp was the go trial, and the red lamp was the no-go trial. Using a response box, participants were required to press the button with their left digit or right digit as quickly as possible when the gray cross and green lamp were presented according to their handedness, while the participants were required to refrain from pressing the buttons when the red lamp was presented. The practice phase consisted of 20 go and 5 no-go trials in this experiment, and the practice phase was not used for the MEG recording and analysis (Figure 1).
 |
Figure 1 A cartoon illustrating the go/no-go task. ms, millisecond. |
Behavioral Data Measurements
At the behavioral level, the accuracy rate (hit rate, i.e., the percentage of correct responses) for the go trials and the false alarm rate (error rate, i.e., the opposite of the intended action) were counted for the no-go trials. The (Reaction times, RTs) were recorded for the go trials.
MEG Data Acquisition
A 275-channel whole-head CTF MEG system (Omega 2000, VSM Med Tech Inc, Port Coquitlam, Canada) at a sampling rate of 1200 Hz was employed for the MEG recordings in a special magnetically shielded room. The participants were instructed to remove any pieces of metal and lay in the supine position. The system had a third-order synthetic gradient that was guaranteed to cancel background and noise interference. During the MEG measurements, the head motion and localization were supervised with a motion tolerance of 5 mm within the MEG helmet. A Siemens Verio 3.0 Tesla MRI scanner (Erlangen, Germany) was used for the T1-weighted imaging data acquisition. The T1-weighted axial images parameters included repetition time/echo time (TR/TE) = 1900/2.48 ms, thickness/gap = 1.0/0 mm, field of view (FOV) = 240×240 mm2, matrix = 256×256×192, and voxel size = 1×1×1 mm3. Three energizing coils were placed at the nasion, left preauricular and right preauricular to measure the participant’s head location within the scanner and for the offline coregistration of the MRI and MEG data.
Preprocessing
The MEG data were preprocessed by an offline analysis with the Filedtrip toolbox (http://www.ru.nl/fcdonders/fieldtrip/) in a MATLAB software environment (http://www.mathworks.com). The raw MEG data were converted to go/no-go epochs, followed by removing 49.5 Hz to 50.5 Hz power. Only the correct no-go epochs were used in the MEG analysis. The data for each subject were time-locked to the onset of the stimulus (no-go trial), and the signal epochs were selected as 200 ms for the prestimulus and 900 ms for the poststimulus. The data were screened for head motion using the SPM megheadloc function, which removed any epochs with a motion greater than 5mm or when the intertrial movement was >10 mm. The Independent Component Analysis (ICA) was performed to eliminate eye movement and cardiac artifacts. Data were filtered into a 1–120 Hz frequency band for the analysis.
Source Reconstruction and Functional Connectivity Calculations
After preprocessing the raw MEG data, we completed the source reconstruction by a minimum-norm estimates algorithm.33 To further compare the differences in the brain regions of depressed patients and healthy people under the go/no-go task, we then used the method of computing function connectivity. Previous studies have shown that the frontal lobe is abnormally activated during the go/no-go task in patients with unipolar depression compared with healthy people.34 Although it can be used as a potential biological indicator of top-down regulation of self-regulation, HRV is closely related to the central autonomic network (CAN).35 Moreover, the anterior cingulate cortex (ACC) and the orbitofrontal cortex (OFC) of the frontal lobe are important components of the CAN. Therefore, to further explore the relationship between abnormally activated brain regions and HRV under the go/no-go task, we chose 6.0 mm as the radius to obtain spherical brain regions based on an Automated Anatomical Labeling 90 (AAL90) template36 that included our regions of interest (ROIs). We were sure that these ROIs did not overlap with each other and that the signal we obtained was clear and reliable. Then, we chose the bilateral dorsolateral superior frontal gyrus (−18.45, 34.81, 42.20) (21.90, 31.12, 43.82), bilateral orbital part of the superior frontal gyrus (−16.56, 47.32, −13.31)(18.49, 48.10, −14.02), bilateral orbital part of the middle frontal gyrus (−30.65, 50.43, −9.62)(33.18, 52.59, −10.73) and bilateral orbital part of the inferior frontal gyrus (−35.98, 30.71, −12.11)(41.22, 32.23, −11.91) as seed points and used a Pearson correlation analysis to calculate the functional connection of the other 89 brain regions in the AAL90 template both under “go” task and “no-go” task. Each sample functional map was entered into a two-tailed independent sample t-test to determine which brain regions were significantly correlated with the seeds, and all p values were corrected by the false-discovery rate (FDR). The statistical threshold was set at p < 0.001.
HRV Data Acquisition
The HRV data derived from MEG data. For measurement of MEG only was continued for 5 mins; therefore, the HRV components, MEAN, SDANN, and RMSSD, were selected for analysis. The pan-tompkin function in the Matlab software environment was carried out to lock the R wave, then by measuring the interval of R-R, we could get the data of MEAN, SDANN, and RMSSD. The calculation formulas for above three HRV components were as follows: MEAN presents R-R interval (RR) and  ; SDANN presents the slowly varying component of HRV, and
 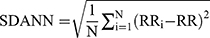 RMSSD presents the quickly varying component of HRV, and
 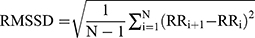 . Because a substantial part of the long-term variability is day-night differences in time domain analysis method, MEG was measured at afternoon 2:00 to 5:00.
Data Analysis
Data are presented as the means (standard deviation, SD). Statistical Program for Social Sciences software version 19.0 (SPSS, IBM Corporation, Armonk, NY, USA) was used for the data statistical analysis. Mean age, education (Hamilton Anxiety Scale, HAMA) scores, HAMD scores, behavioral data, HRV values and functional connectivity in the different brain regions were compared between the MD and HC group using independent-sample t-tests, and the sex ratio and handedness were compared using the Pearson chi-square test. The correlation analysis of the HRV values and functional connectivity in different brain regions and HAMD scores were conducted by Pearson’s r in the MD group. To account for multiple comparisons and counteract the likelihood of false positives, FDR correction was applied.37 Stepwise regression was used to analyze the relationship between HRV data (SDANN, RMSSD) and “go” task or “no-go” task. ROC analysis was used to further verify that HRV is a characteristic biological marker for MD. Alpha values of 0.05 were considered significant throughout.
Results
Demographic Characteristics of Participants
The demographic and clinical data of all subjects are shown in Table 1. There were no significant differences in the sex ratio, mean age, mean education years, and handedness between the MD group and HC group. Although the mean of the HAMA scores was higher in the MD group than that of the HC group, there were no significant differences. There were significant differences in the HAMD scores between two groups, and the HAMD scores in MD the group were higher than those of the HC group.
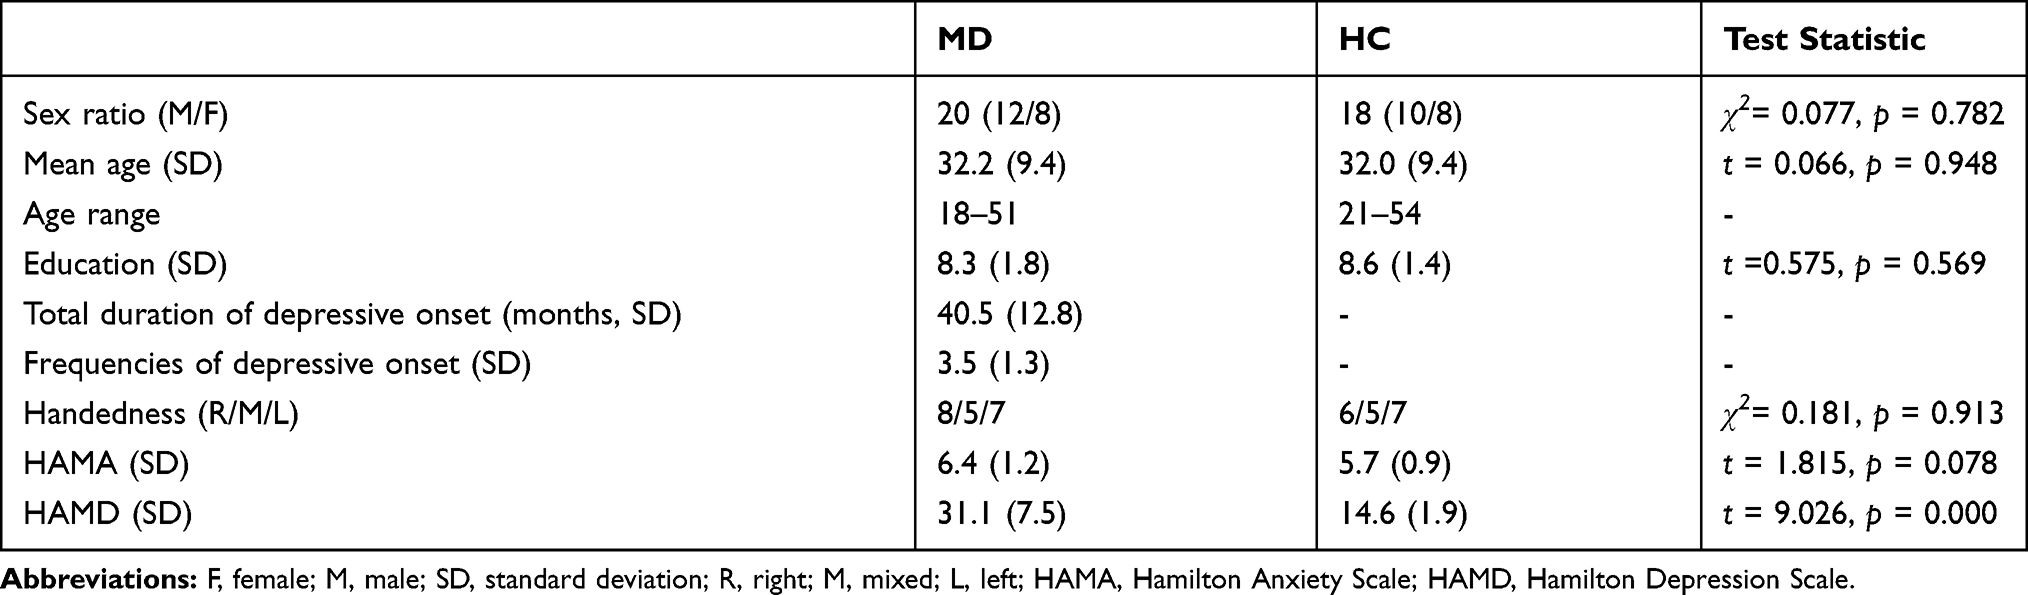 |
Table 1 Demographic and Clinical Characteristics of Participants |
Behavioral Data Analysis
1. As shown in Figure 2, the RTs for the go trials in the MD group were longer than those in the HC group (t = 10.725, p = 0.000); the hit rate for the go trials in the MD group was lower than that in the HC group (t = 8.185, p = 0.000), and the false alarm rate for the no-go trials in the MD group was higher than that in the HC group (t = 3.546, p = 0.002).
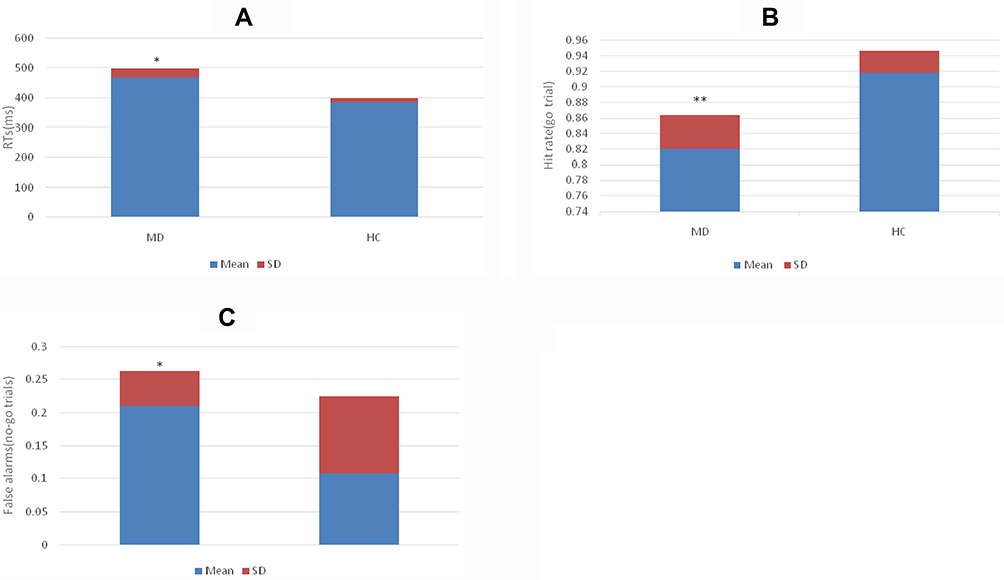 |
Figure 2 (A) Comparison of RTs for the go trials in the MD and HC group. (B) Comparison of hit rate for go trials in the MD and HC group. (C) Comparison of false alarm rate for the no-go trials in the MD and HC group. *p<0.01; **p<0.001. Abbreviations: MD, major depression group; HC, healthy control group; ms, millisecond. |
HRV Indices Analysis
As shown in Figures 3 and 4, the electrocardiographic components were collected from the cardiac artifacts within 300 s by manual operation. Although the RR in the MD group was higher than that of the HC group, there were no significant differences (t = 0.584, p = 0.563). There were significant differences in the RMSSD and the SDANN between the MD group and HC group, and the RMSSD and SDANN in the MD group were lower than those in the HC group (t = 3.257, 3.117, p = 0.003, 0.003).
By Pearson correlation analysis, the RR was not associated with the HAMD scores in the MD group (r = - 0.150; p = 0.529); however, the RMSSD and SDANN were negativity associated with the HAMD scores (r = - 0.484 and - 0.549; p = 0.031 and 0.012)
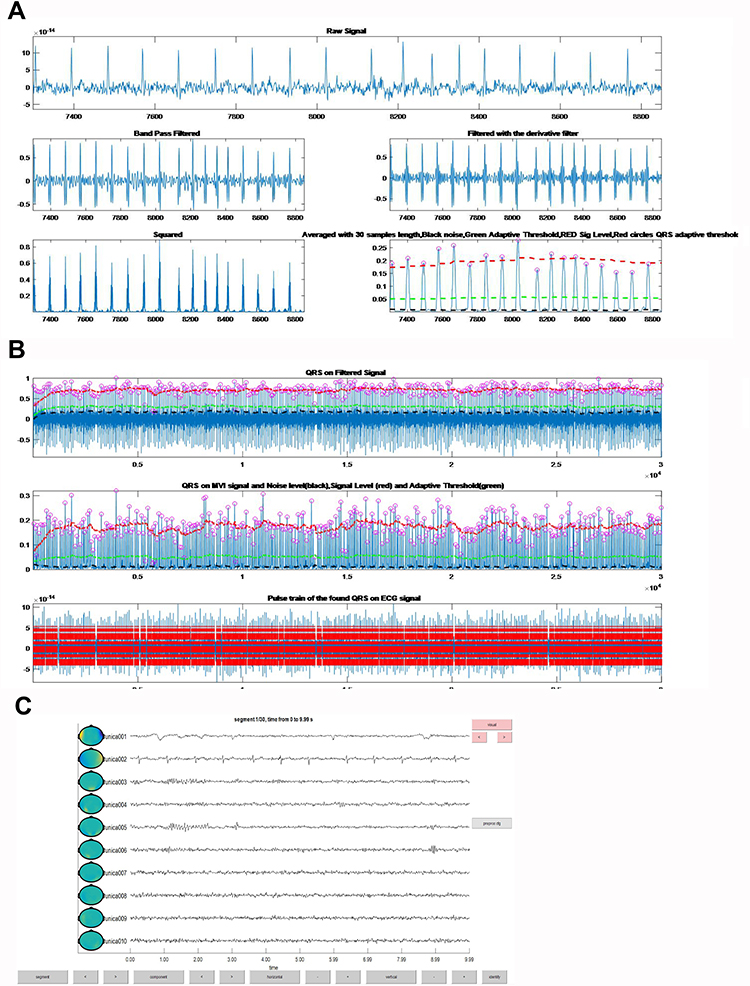 |
Figure 3 The electrocardio components were collected from the cardiac artifacts within 300 s by manual operation. (A) Raw signal, band pass filtered, filtered with the derivative filter, squared and averaged with 30 samples length (Black – noise, Green – adaptive threshold, Red – sig level, and Red circles – QRS adaptive threshold); (B) QRS on filtered signal, QRS on MVI signal and noise level (black), signal level (red) and adaptive threshold (green), and pulse train of the found QRS on ECG signal; (C) the figure presents segment 30/30, and time from 290 to 299.99 s. |
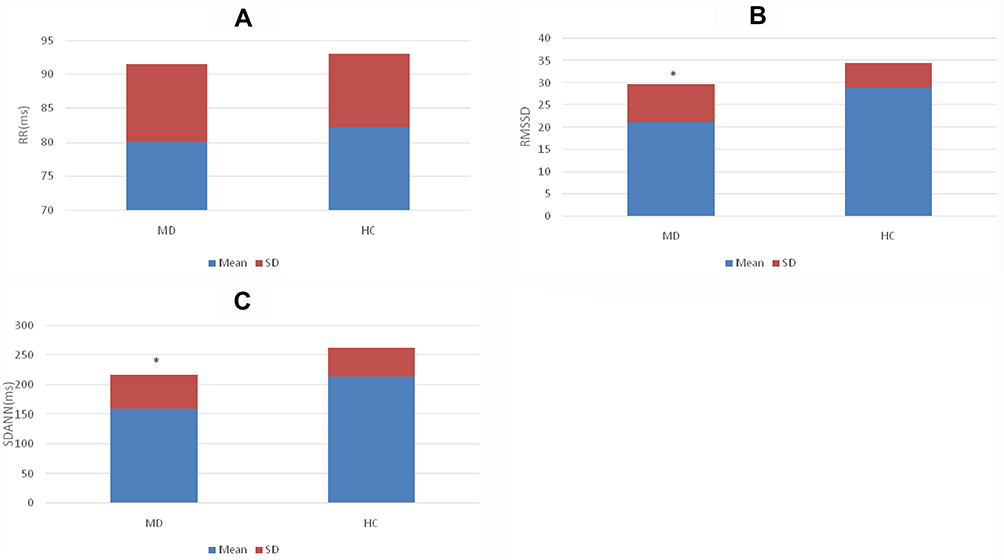 |
Figure 4 (A) Comparison of RR in the MD and HC group. (B) Comparison of RMSSD in the MD and HC group. (C) Comparison of SDANN in the MD and HC group. *p<0.01. Abbreviations: MD, major depression group; HC, healthy control group; ms, millisecond; RR, RR interval segment duration; RMSSD, root mean square of successive differences; SDANN, the standard deviation of the average NN intervals. |
Functional Connectivity Analysis
Under the No-Go Task
As shown in Figure 5 and Table 2, a brain MEG functional connectivity analysis based on the seed regions of the orbitofrontal cortex (OFC) showed that, compared to the brain regions in the HC group, the brain regions that were involved in the functional connectivity network of OFC in the MD group included the following: the functional connectivity between the left superior frontal gyrus (orbital part) and the right inferior frontal gyrus (orbital part), the functional connectivity between the left superior frontal gyrus (orbital part) and the right amygdala, and the functional connectivity between the left superior frontal gyrus (orbital part) and the right parahippocampal gyrus. These brain region functional connectivities usually represent inhibitory and control function under the no-go task, and all these connectivity networks were increased.
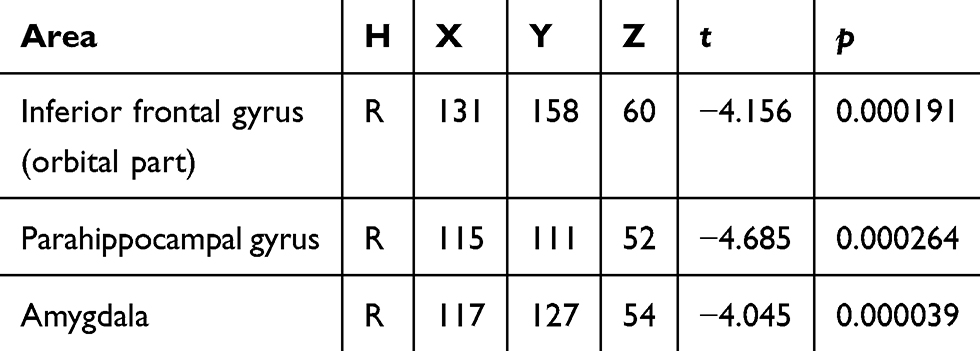 |
Table 2 Brain Regions for the Whole Brain Connectivity with the Left Superior Frontal Gyrus (Orbital Part) Under No-Go Task (MNI Coordinates) |
There were no significant differences between all the other brain regions that were involved in the functional connectivity network of the OFC in the MD group and those in the HC group (all p > 0.00056).
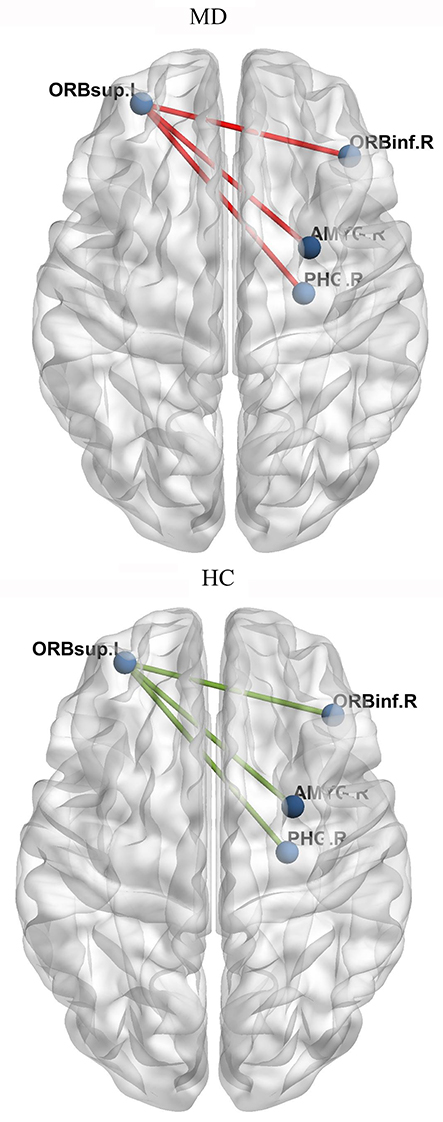 |
Figure 5 A brain MEG functional connectivity analysis based on seed regions of the orbitofrontal cortex (OFC) showed that, compared to HC group, brain regions involved in the functional connectivity network of OFC in MD group included: the functional connectivity between the left superior frontal gyrus (orbital part) and the right inferior frontal gyrus (orbital part), right amygdale and right parahippocampal gyrus. |
Under the Go Task
Under the go task, compared to the HC group, the brain regions that were involved in the functional connectivity network of OFC in the MD group included the following: the functional connectivity between the middle frontal gyrus (orbital part) and precentral gyrus (t = - 4.011, p = 0.000292), the functional connectivity between the middle frontal gyrus (orbital part) and the inferior frontal gyrus (triangular part) (t = - 4.304, p = 0.000123) and the functional connectivity between the superior frontal gyrus (orbital part) and precentral gyrus (t = - 4.019, p = 0.000286).
Correlation Stepwise Regression Analysis Between HRV and Functional Connectivities of Inter-Regions
When participants performed no-go task, the following results were made by Pearson correlation analysis: 1) the RMSSD and SDANN are negatively correlated with it in the MD group (r = - 0.468 and - 0.517, p = 0.038 and 0.020); however, the SDANN and RMSSD are not correlated with the functional connectivity between the left superior frontal gyrus (orbital part) and the right inferior frontal gyrus (orbital part) in the HC group (r = 0.005 and 0.012, p = 0.986 and 0.963); 2) the RMSSD is positively correlated with the functional connectivity between the left superior frontal gyrus (orbital part) and the right amygdala in the HC group (r = 0.545, p = 0.019), however, the RMSSD and SDANN are not associated with in the MD group (r = - 0.172 and - 0.211, p = 0.469 and 0.372); 3) the RMSSD is positively correlated with the functional connectivity between the left superior frontal gyrus (orbital part) and the right parahippocampal gyrus in the HC group (r = 0.519, p = 0.027); however, the RMSSD and SDANN are not correlated with it in the MD group (r = - 0.118 and - 0.138, p = 0.619 and 0.561).
When participants performed go task, the following results were made by Pearson correlation analysis: 1) SDANN and RMSSD are negatively correlated with the functional connectivity between the middle frontal gyrus (orbital part) and precentral gyrus (SDANN: r = - 0.465, p = 0.039; RMSSD: r = - 0.472, p = 0.036); 2) SDANN and RMSSD are negatively correlated with the functional connectivity between the superior frontal gyrus (orbital part) and precentral gyrus (SDANN: r = - 0.453, p = 0.045; RMSSD: r = - 0.457, p = 0.043).
By stepwise regression analysis, we found that the functional connectivity between the superior frontal gyrus (orbital part) and precentral gyrus was excluded and two formulas were obtained.
Formula (1)
(Y = SDANN, X 1= the functional connectivity between the left superior frontal gyrus (orbital part) and the right inferior frontal gyrus (orbital part), X 2 = the functional connectivity between the middle frontal gyrus (orbital part) and precentral gyrus, Formula (2) p = 0.009, R = 0.655,
 )
)

(Y = RMSSD, X 1 = the functional connectivity between the left superior frontal gyrus (orbital part) and the right inferior frontal gyrus (orbital part), X 2 = the functional connectivity between the middle frontal gyrus (orbital part) and precentral gyrus, p = 0.036, R = 0.472,
 )
)
From formula 1 and formula 2, since the regression coefficient of the functional connectivity between the left superior frontal gyrus (orbital part) and the right inferior frontal gyrus (orbital part) is bigger than that of the functional connectivity between the middle frontal gyrus (orbital part) and precentral, the functional connectivity between the left superior frontal gyrus (orbital part) and the right inferior frontal gyrus (orbital part) contributes more to the changes of HRV, which suggests that the differences of HRV between MD group and HC group mainly caused by “no-go” task.
Correlation Analysis Between HAMD and Abnormal Functional Connectivity in the MD Group
By Pearson correlation analysis, the HAMD scores in the MD group were found to be positively associated with the functional connectivity between the left superior frontal gyrus (orbital part) and the inferior frontal gyrus (orbital part), the functional connectivity between the left superior frontal gyrus (orbital part) and the right parahippocampal gyrus, and the functional connectivity between the left superior frontal gyrus (orbital part) and the right amygdale (r = 0.808, 0.609 and 0.637; p = 0.000, 0.004 and 0.003).
Discussion
This study is the first to clarify the neural mechanisms of interactions between the autonomic nervous system and cognitive function (inhibitory and control function), with the correlation analysis of the HRV indices and MEG functional inter-region connectivity networks of OFC under the go/no-go task, in major depression.
Consistent with the previous studies,4–7,21–23 our behavioral outcome showed that MD patients displayed poor inhibitory and control function. Previously, many electrophysiological and neuroimaging studies on inhibitory and control function have been conducted in MD patients. For example, a study using ERPs indicated the amplitudes of error-related negativity (ERN), which were evoked by a go/no-go task, were reduced in error trials, and this result might reflect impaired response-monitoring processes in MD patients.4 However, another study showed that the amplitudes of ERN, which were evoked by a go/no-go task, were increased in remitted MD patients, and the results may implicate an overactive anterior cingulate cortex (ACC) that is associated with a hypervigilant error-monitoring system.5 Another study reported that MD patients present reduced no-go P3 amplitudes.6 A recent study used fMRI with a go/no-go task and facial emotion processing task to evaluate the activation levels of the brain region in the salience and emotional network and the cognitive control network (CCN) and showed a deficient CCN engagement during cognitive control in remitted MD patients.7 However, another study that used a go/no-go task to assess the ability of learning to emit or withhold actions to obtain monetary rewards or avoid losses showed that MD patients were not impaired in their overall performance or learning and displayed no abnormal neural responses.8 A previous fMRI study used a go/no-go task, which comprises stimuli without emotional characteristics to disentangle the effects of altered affect processes, to investigate the neural mechanisms of dysfunctional inhibitory in MD.38 And the findings showed that in MD patients, greater neural activation in frontal, limbic, and temporal regions during the no-go task. In contrast to ERPs and fMRI, MEG has better temporal and spatial resolution. In this study, we used a brain MEG functional connectivity analysis to study the neural substrates of inhibitory and control function in MD patients, and displayed the functional connectivity between the left superior frontal gyrus (orbital part) and the right inferior frontal gyrus (orbital part), the right amygdala, and the right parahippocampal gyrus were increased. This result mostly consistent with previous researches. However, the appearance of the right amygdala and the right parahippocampal gyrus under the go/no-go task suggested that these two brain regions which used to be considered to be related to the regulation of emotions might have associated with the regulation of the inhibitory and control function.
In our study, we employed a new method for the acquisition of HRV indices. The HRV indices (RR, SDANN, and RMSSD) were derived from the raw MEG data. First, the ICA was used to separate the various components of the raw MEG data, and the following step was the collection of the electrocardiographic component of the cardiac artifacts by manual operation. Since the pan-tompkin function was performed in the MATLAB software environment to lock the R wave and the RR, SDANN, and RMSSD data were calculated by measuring the R-R interval, the HRV should be effective. The biggest advantage of this method over other methods that have been used in the previous research is that the ECG component is extracted from the MEG data and more reliably reflects the transient change of vagal-sympathetic balance under the task. Under a larger number of researches testing, the go/no-go task is the most reliable task to measure control inhibition function. However, the HRV indices are continuous and the “no-go” in the go/no-go task is discontinuous. For the changes of HRV indices under the go/no-go task may result from “go” and “no-go”, we have to figure out if the changes of HRV indices under the go/no-go task mainly affected by control inhibition function. We measured the all meaningful brain regions no matter under “go” and “no-go”, and calculated their respective influences by stepwise regression. The result showed although “no-go” merely accounts for about 5% of the whole task, it has a greater impact on HRV indices than “go”, which suggests the use of the go/no-go task can effective reflect the relationship between HRV and control inhibition function.
Studies as early as 1993 showed that autonomic neural function was mainly influenced by the central autonomic network (CAN), which includes the prefrontal cortex, the limbic system and the brain stem structure,39 and OFC, right amygdala, and the right parahippocampal gyrus in our study belong to CAN. In addition, according to the dysfunction of limbic-hypothalamic-pituitary-adrenal axis (LHPA axis) in MD patients, as important components of the limbic system, the amygdala and hippocampus gyrus can regulate the work of hypothalamic-pituitary-adrenal axis (HPA axis).40,41 And a recent research shows that HPA axis can regulate autonomic neural function by glucocorticoids, which can further affect HRV.42 Our study shows the functional connectivity between the left superior frontal gyrus (orbital part) and the right amygdala, and the right parahippocampal gyrus of healthy people have correlation with HRV while these correlations disappear in MD patients. In this point, we suggest that MD patients due to the abnormal effect of the amygdala and hippocampus gyrus resulting in this association disappeared. At the same time, function connectivity between internal OFC which is associated with control inhibition function is abnormal activated and can affect HRV through the function of HPA axis. This may lead to the correlation between abnormal control inhibition function and abnormal HRV in MD patients.43
The self-regulation of an individual refers to the multidimensional characteristics of temperament that are involved in the flexible regulation of emotion, behavior, and cognition through means of “top-down” and “bottom-up” neural mechanisms.44,45 Top-down self-regulation includes emotional regulation and behavioral regulation.45 A number of studies have reported that HRV can tentatively be used as a biomarker of top-down self-regulation.46 Recent studies have shown that HRV is decreased in MD and that HRV can be used as an index of the association between depression and autonomic dysregulation; therefore HRV may be an indicator of a clinical state of MD.21–23,47 Neuroimaging studies have indicated the neural correlates of autonomic control by measuring both HRV and associated brain activity during the measurement of neuropsychological tests. For instance, a previous study that used positron emission tomography (PET) to investigate the association between HRV and regional cerebral blood flow (rCBF) during the performance of a handgrip motor task and an n-back task showed that the activity in both the medial and lateral orbital cortices was correlated with differences in the rCBF and HRV between MD patients and normal controls.24 Another study that used fMRI to investigate the associations between HRV and specific brain activity during the performance of an emotional category task indicated that a reduced rostral anterior cingulate cortex (rACC)-subcortical functional connectivity in MD patients may account for autonomic dysregulation.25 Similar to these studies, our results showed that MD patients present the decreased RMSSD and SDANN, and HRV has an association with the severity of depressive state.
In summary, our study showed that MD patients displayed poor inhibitory and control function and presents the decreased HRV indices. Additionally, MD patients display the increased functional connectivity networks of OFC under the no-go task; and most importantly, the SDANN and RMSSD are correlated with the functional connectivity between the left superior frontal gyrus (orbital part) and the right inferior frontal gyrus (orbital part) in MD patients. According to these results, we conclude that autonomic nervous system is related to inhibitory and control function through functional inter-region connectivity networks of OFC in major depression.
Our findings have important implications for the understanding pathophysiology of major depression, and MEG may provide an image-guided tool for interventions.
There are two limitations in this study. First, because of the small sample size, the results must be considered as preliminary. Further studies with larger sample sizes are needed to further replicate the results of this study. Second, the HRV data that were derived from the preprocessed MEG data, i.e., the electrocardiographic components, were collected from the cardiac artifacts, and the measurement of MEG was only conducted for 5 mins; therefore, the time-domain analysis was used for the HRV analysis instead of frequency-domain analysis. Since only the HRV components, R-R interval, SDANN, and RMSSD were selected for the analysis, they do not represent the entirety of the HRV characters. Future studies using the specific apparatus facilities for ECG data acquisition should be conducted to further verify our HRV outcome.
Acknowledgments
This work was supported by the National Natural Science Foundations of China (No. 81871066 and No. 81571639), Jiangsu Provincial Medical Innovation Team of the Project of Invigorating Health Care through Science, Technology and Education (No. CXTDC2016004), and Jiangsu Provincial key research and development program (No. BE2018609).
Author Contributions
All authors contributed to data analysis, drafting and revising the article, gave final approval of the version to be published, and agree to be accountable for all aspects of the work.
Disclosure
The authors report no conflicts of interest in this work.
References
1. Marazziti D, Giorgio C, Michela P, et al. Cognitive impairment in major depression. Eur J Pharmacol. 2010;626(1):83–86. doi:10.1016/j.ejphar.2009.08.046
2. Papakostas GI. Cognitive symptoms in patients with major depressive disorder and their implications for clinical practice. J Clin Psychiatry. 2014;75(1):8–14. doi:10.4088/JCP.13r08710
3. Chikazoe J. Localizing performance of go/no-go tasks to prefrontal cortical subregions. Curr Opin Psychiatry. 2010;23(3):267–272. doi:10.1097/YCO.0b013e3283387a9f
4. Ruchsow M, Herrnberger B, Beschoner P, et al. Error processing in major depressive disorder: evidence from event-related potentials. J Psychiatr Res. 2006;40(1):37–46. doi:10.1016/j.jpsychires.2005.02.002
5. Georgiadi E, Liotti M, Nixon NL, et al. Electrophysiological evidence for abnormal error monitoring in recurrent major depressive disorder. Psychophysiology. 2011;48(9):1192–1202. doi:10.1111/psyp.2011.48.issue-9
6. Ruchsow M, Groen G, Kiefer M, et al. Electrophysiological evidence for reduced inhibitory control in depressed patients in partial remission: a go/no-go study. Int J Psychophysiol. 2008;68(3):0–218. doi:10.1016/j.ijpsycho.2008.01.010
7. Stange JP, Jenkins LM, Hamlat EJ, et al. Disrupted engagement of networks supporting hot and cold cognition in remitted major depressive disorder. J Affect Disord. 2018;227:183–191. doi:10.1016/j.jad.2017.10.018
8. Michael M, Rutledge RB, Gita P, et al. Neural activity and fundamental learning, motivated by monetary loss and reward, are intact in mild to moderate major depressive disorder. PLoS One. 2018;13(8):e0201451. doi:10.1371/journal.pone.0201451
9. Luo H, Liu Z, Poeppel D, Zatorre R. Auditory cortex tracks both auditory and visual stimulus dynamics using low-frequency neuronal phase modulation. PLoS Biol. 2010;8(8):e1000445. doi:10.1371/journal.pbio.1000445
10. Liu L, Wang F, Zhou K, et al. Perceptual integration rapidly activates dorsal visual pathway to guide local processing in early visual areas. PLoS Biol. 2017;15(11):e2003646. doi:10.1371/journal.pbio.2003646
11. Alamian G, Hincapié AS, Pascarella A, et al. Measuring alterations in oscillatory brain networks in schizophrenia with resting state MEG: state-of-the-art and methodological challenges. Clin Neurophysiol. 2017;128(9):1719–1736. doi:10.1016/j.clinph.2017.06.246
12. Yamashita M, Yoshihara Y, Hashimoto R, et al. A prediction model of working memory across health and psychiatric disease using whole-brain functional connectivity. eLife. 2018;7:e38844. doi:10.7554/eLife.38844
13. Tian S, Chattun MR, Zhang S, et al. Dynamic community structure in major depressive disorder: a resting state MEG study. Prog Neuropsychopharmacol Biol Psychiatry. 2019;92:39–47. doi:10.1016/j.pnpbp.2018.12.006
14. Nugent AC, Robinson SE, Coppola R, et al. Group differences in MEG-ICA derived resting state networks: application to major depressive disorder. NeuroImage. 2015;118:1–12. doi:10.1016/j.neuroimage.2015.05.051
15. Kaiser RH, Andrews-Hanna JR, Wager TD, et al. Large-scale network dysfunction in major depressive disorder: a meta-analysis of resting-state functional connectivity. JAMA Psychiatry. 2015;72(6):603–611. doi:10.1001/jamapsychiatry.2015.0071
16. Evans S, Seidman LC, Tsao JC, et al. Heart rate variability as a biomarker for autonomic nervous system response differences between children with chronic pain and healthy control children. J Pain Res. 2013;6:449–457. doi:10.2147/JPR.S43849
17. Levy MN. Autonomic interactions in cardiac control. Ann N Y Acad Sci. 1990;601:209–221. doi:10.1111/j.1749-6632.1990.tb37302.x
18. Haapaniemi TH, Pursiainen V, Korpelainen JT, et al. Ambulatory ECG and analysis of heart rate variability in parkinson’s disease. J Neurol Neurosurg Psychiatry. 2001;70(3):305–310. doi:10.1136/jnnp.70.3.305
19. Agelink MW, Majewski T, Wurthmann C, et al. Effects of newer atypical antipsychotics on autonomic neurocardiac function: a comparison between amisulpride, olanzapine, sertindole, and clozapine. J Clin Psychopharmacol. 2001;21(1):8–13. doi:10.1097/00004714-200102000-00003
20. Sgoifo A, Carnevali L, Pico Alfonso MDLA, et al. Autonomic dysfunction and heart rate variability in depression. Stress. 2015;8(3):1–10.
21. Jandackova VK, Britton A, Malik M, et al. Heart rate variability and depressive symptoms: a cross-lagged analysis over a 10-year period in the whitehall II study. Psychol Med. 2016;46(10):2121–2131. doi:10.1017/S003329171600060X
22. Huang M, Shah A, Su S, et al. Association of depressive symptoms and heart rate variability in vietnam war-era twins: a longitudinal twin difference study. JAMA Psychiatry. 2018;75(7):705–712. doi:10.1001/jamapsychiatry.2018.0747
23. Hartmann R, Schmidt FM, Sander C, et al. Heart rate variability as indicator of clinical state in depression. Front Psychiatry. 2019;9:735. doi:10.3389/fpsyt.2018.00735
24. Nugent AC, Bain EE, Thayer JF, et al. Heart rate variability during motor and cognitive tasks in females with major depressive disorder. Psychiatry Res. 2011;191(1):1–8. doi:10.1016/j.pscychresns.2010.08.013
25. Ryan S, John JBA, Julian FT, et al. Altered functional connectivity between medial prefrontal cortex and the inferior brain stem in major depression during appraisal of subjective emotional responses: a preliminary study. Biol Psychol. 2015;108:13–24. doi:10.1016/j.biopsycho.2015.03.007
26. Luft CDB, Emílio T, Darby D. Heart rate variability and cognitive function: effects of physical effort. Biol Psychol. 2009;82(2):164–168. doi:10.1016/j.biopsycho.2009.07.007
27. Alderman BL, Olson RL. The relation of aerobic fitness to cognitive control and heart rate variability: a neurovisceral integration study. Biol Psychol. 2014;99:26–33. doi:10.1016/j.biopsycho.2014.02.007
28. Luquecasado A, Perales JC, Cárdenas D, et al. Heart rate variability and cognitive processing: the autonomic response to task demands. Biol Psychol. 2016;113:83–90. doi:10.1016/j.biopsycho.2015.11.013
29. Klee S, Meyer RG. Alleviation of performance deficits of depression through thermal biofeedback training. J Clin Psychol. 1981;37(3):515–518. doi:10.1002/1097-4679(198107)37:3<515::AID-JCLP2270370312>3.0.CO;2-P
30. Karavidas MK, Lehrer PM, Vaschillo E, et al. Preliminary results of an open label study of heart rate variability biofeedback for the treatment of major depression. Appl Psychophysiol Biofeedback. 2007;32(1):19–30. doi:10.1007/s10484-006-9029-z
31. Caldwell YT, Steffen PR. Adding HRV biofeedback to psychotherapy increases heart rate variability and improves the treatment of major depressive disorder. Int J Psychophysiol. 2018;131:96–101. doi:10.1016/j.ijpsycho.2018.01.001
32. Annett M. A classification of hand preference by association analysis. Br J Psychol. 1970;61(3):303–321. doi:10.1111/bjop.1970.61.issue-3
33. Hauk O. Keep it simple: a case for using classical minimum norm estimation in the analysis of EEG and MEG data. Neuroimage. 2004;21(4):1612–1621. doi:10.1016/j.neuroimage.2003.12.018
34. Gyurak A
35. Thayer JF, Brosschot JF. Psychosomatics and psychopathology: looking up and down from the brain. Psychoneuroendocrinology. 2005;30(10):1050–1058. doi:10.1016/j.psyneuen.2005.04.014
36. Tzourio-Mazoyer N, Landeau B, Papathanassiou D, et al. Automated anatomical labeling of activations in SPM using a macroscopic anatomical parcellation of the MNI MRI single-subject brain. Neuroimage. 2002;15(1):273–289. doi:10.1006/nimg.2001.0978
37. Storey JD. The positive false discovery rate: a bayesian interpretation and the q-value. Ann Stat. 2003;31(6):2013–2035. doi:10.1214/aos/1074290335
38. Langenecker SA, Kennedy SE, Guidotti LM, et al. Frontal and limbic activation during inhibitory control predicts treatment response in major depressive disorder. Biol Psychiatry. 2007;62(11):1272–1280. doi:10.1016/j.biopsych.2007.02.019
39. Benarroch EE. The central autonomic network: functional organization, dysfunction, and perspective. Mayo Clin Proc. 1993;68(10):988–1001. doi:10.1016/S0025-6196(12)62272-1
40. Herman JP, Ostrander MM, Mueller NK, Figueiredo H. Limbic system mechanisms of stress regulation: hypothalamo-pituitary-adrenocortical axis. Prog Neuropsychopharmacol Biol Psychiatry. 2005;29(8):1201–1213. doi:10.1016/j.pnpbp.2005.08.006
41. Ulrich-Lai YM, Xie W, Meij JT, et al. Limbic and HPA axis function in an animal model of chronic neuropathic pain. Physiol Behav. 2006;88(1–2):67–76. doi:10.1016/j.physbeh.2006.03.012
42. Agorastos A
43. Ottaviani C. Brain-heart interaction in perseverative cognition. Psychophysiology. 2018;55(7):e13082. doi:10.1111/psyp.2018.55.issue-7
44. Berger A, Kofman O, Livneh U, et al. Multidisciplinary perspectives on attention and the development of self-regulation. Prog Neurobiol. 2007;82(5):256–286. doi:10.1016/j.pneurobio.2007.06.004
45. Bridgett DJ, Burt NM, Edwards ES, et al. Intergenerational transmission of self-regulation: a multidisciplinary review and integrative conceptual framework. Psychol Bull. 2015;141(3):602–654. doi:10.1037/a0038662
46. Holzman JB, Bridgett DJ. Heart rate variability indices as bio-markers of top-down self-regulatory mechanisms: a meta-analytic review. Neurosci Biobehav Rev. 2017;74(Pt A):233–255. doi:10.1016/j.neubiorev.2016.12.032
47. Ha JH, Park S, Yoon D, et al. Short-term heart rate variability in older patients with newly diagnosed depression. Psychiatry Res. 2015;226(2–3):484–488. doi:10.1016/j.psychres.2015.02.005
 © 2020 The Author(s). This work is published and licensed by Dove Medical Press Limited. The
full terms of this license are available at https://www.dovepress.com/terms
and incorporate the Creative Commons Attribution
- Non Commercial (unported, 3.0) License.
By accessing the work you hereby accept the Terms. Non-commercial uses of the work are permitted
without any further permission from Dove Medical Press Limited, provided the work is properly
attributed. For permission for commercial use of this work, please see paragraphs 4.2 and 5 of our Terms.
© 2020 The Author(s). This work is published and licensed by Dove Medical Press Limited. The
full terms of this license are available at https://www.dovepress.com/terms
and incorporate the Creative Commons Attribution
- Non Commercial (unported, 3.0) License.
By accessing the work you hereby accept the Terms. Non-commercial uses of the work are permitted
without any further permission from Dove Medical Press Limited, provided the work is properly
attributed. For permission for commercial use of this work, please see paragraphs 4.2 and 5 of our Terms.