Back to Journals » Clinical Interventions in Aging » Volume 13
Autonomic function as indicated by heart rate deceleration capacity and deceleration runs in type 2 diabetes patients with or without essential hypertension
Authors Wang XD ![]() , Zhou L, Zhu CY, Chen B
, Zhou L, Zhu CY, Chen B ![]() , Chen Z, Wei L
, Chen Z, Wei L
Received 24 August 2017
Accepted for publication 15 April 2018
Published 2 July 2018 Volume 2018:13 Pages 1169—1176
DOI https://doi.org/10.2147/CIA.S149920
Checked for plagiarism Yes
Review by Single anonymous peer review
Peer reviewer comments 2
Editor who approved publication: Dr Zhi-Ying Wu
Xing-De Wang,1 Li Zhou,1 Chao-Yu Zhu,2 Bin Chen,1 Zhong Chen,1 Li Wei2
1Department of Cardiology, Shanghai Jiao Tong University Affiliated Sixth People’s Hospital, Shanghai 200233, China; 2Department of Endocrinology, Shanghai Jiao Tong University Affiliated Sixth People’s Hospital, Shanghai 200233, China
Purpose: Sympathovagal imbalance is a common underlying disorder in hypertension and diabetes. This study characterized autonomic nervous system function, indicated by heart rate deceleration capacity (DC) and deceleration runs (DRs), in patients with type 2 diabetes mellitus (T2DM), with or without concomitant essential hypertension.
Subjects and methods: We recruited 50 healthy subjects, 50 patients with T2DM, and 95 with T2DM and essential hypertension. DC, DRs (DR2, DR4, and DR8, ie, episodes of 2, 4, or 8 consecutive beat-to-beat heart rate decelerations, respectively), and heart rate variability were determined by dynamic electrocardiogram. Biochemical markers of glucose and lipid metabolism, including glycated hemoglobin (HbA1c) and high-density lipoprotein cholesterol (HDL-C), were measured from blood samples.
Results: Both T2DM groups featured lower DC, SD of all normal-to-normal sinus RR intervals over 24 h (SDNN), root mean square of the successive normal sinus RR interval difference, and all DR values, but higher average heart rate (AHR) and acceleration capacity (AC), than healthy subjects. There were significant associations between the following: DC and HbA1c, systolic blood pressure (SBP), AHR, age, and HDL-C; DR2 and AHR, SBP, and HbA1c; DR4 and HbA1c, age, SBP, and HDL-C; and DR8 and HbA1c, AHR, and age. In both T2DM groups, HbA1c correlated negatively with DC, DR2, and SDNN, and positively with AC and AHR; homeostasis model assessment-insulin resistance index correlated negatively with DC, all DRs, and SDNN, and positively with AC.
Conclusion: Compared with healthy subjects, T2DM patients with or without essential hypertension have lower DC and DRs. DC and DRs correlate negatively with blood glucose and insulin resistance index.
Keywords: autonomic nervous system, deceleration capacity of heart rate, heart rate deceleration runs, insulin resistance, type 2 diabetes mellitus, hypertension
Introduction
Autonomic dysfunction is not only an established complication of diabetes,1 but also a risk factor for the development of diabetes in healthy subjects.2 A study showed that in randomly selected asymptomatic individuals with diabetes, approximately 20% had abnormal cardiovascular autonomic function.1 Cardiac autonomic dysfunction (CAN) ranges from vagus nerve impairment in the early stage to sympathetic nerve impairment, impairment in both vagus and sympathetic nerves, and loss of cardiac innervation at the end stage. The reported prevalence of CAN varies substantially, from 1.6% to 90%, in different studies and populations.3–5 CAN can cause asymptomatic myocardial ischemia and myocardial infarction, which in turn increase the risk of malignant arrhythmia and sudden cardiac death.6–9 Hypertension in patients with diabetes can damage further the autonomic nervous system (ANS) and significantly elevate the risk of malignant arrhythmia and sudden death.
The main clinical manifestations of CAN include resting tachycardia, exercise intolerance, orthostatic hypotension, and syncope. In addition to clinical symptoms, laboratory tests are often used for the assessment of ANS function and the diagnosis of CAN in patients with diabetes. These tests include the following: Ewing’s test; assessments of heart rate variability (HRV), baroreflex sensitivity, heart rate turbulence (HRT), cardiac tachycardia, and adrenal function; and QT interval analysis and radionuclide imaging. However, each of these has limitations, and there is no uniform gold standard to evaluate ANS function, or CAN in particular.10
Heart rate deceleration capacity (DC) and deceleration runs (DRs), proposed as a quantitative assessment of vagal tone, may be an early indicator of sudden death in patients with myocardial infarction.11,12 DC refers to extended deceleration in a cardiac cycle compared with the precedent adjacent cycle. Based on the analysis of overall trend and deceleration capability of the 24-h heart rate, it can be used to assess quantitatively the level of vagal tone in subjects. A decreasing DC value indicates a decreased vagal tone, which may increase the risk of sudden death in patients. DRs refer to gradually prolonged RR intervals in the cardiac cycles of the Holter recording, which results from regulation of negative frequency on sinus rhythm by the vagus nerve in a short time. Technically, DC and DRs represent quite similar and complementary physiological processes in heart rate regulation. While DC shows the average intensity in a single heart rate deceleration, DRs reflect regulation by the vagus nerve of sinus rhythm after continuous deceleration. Bauer et al11 reported that DC was a strong predictor of mortality after myocardial infarction, with a higher predictive value than left ventricular ejection fraction (LVEF) and traditional measures of HRV. Another study showed that DC could well discriminate heart failure cases from controls.13
Several studies have shown that heart rate DC and DRs can quantitatively assess the level of autonomic nervous tension and may be acceptable as noninvasive indicators of ANS function.11,12 The DC and DRs are determined over 24 h using phase-rectified signal averaging. In patients with acute myocardial infarction, diabetes, and chronic heart failure, the DC was significantly lower than that of the control group. This may indicate ANS dysfunction and a potential risk of sudden death.14,15
Our previous studies showed a significant reduction in DC in patients with acute hemispheric ischemic stroke16 and chronic obstructive pulmonary disease with ventricular arrhythmias.17 Thus, the DC can reflect an imbalance in ANS function in these patients. Sympathovagal imbalance and insulin resistance are common underlying disorders in hypertension and diabetes.18 Sympathetic hyperactivity may be, either directly or indirectly, a predictor of cardiovascular morbidity and mortality.19 Sympathovagal imbalance is a known independent prognostic factor for cardiovascular-related morbidity or fatal events in patients with heart failure, end-stage renal failure, major cardiac arrhythmias, obstructive pulmonary disease, or acute stroke. The association between sympathetic activation and insulin resistance may also be reciprocal. Elevated glucose levels, even in the nondiabetic range, can damage peripheral nerve fibers, leading to increased sympathetic activity and reduced parasympathetic control. Thus, it is possible that an elevated resting heart rate could be a consequence, and equally, a marker of insulin resistance. However, little is known of the DC and DRs of patients with both type 2 diabetes mellitus (T2DM) and hypertension, and their associations with glycated hemoglobin (HbA1c) and insulin resistance remains unclear.
The primary aim of this study was to characterize ANS function, indicated by DC and DRs, in T2DM patients with or without essential hypertension. In addition, we explored associations between DC and DRs with other clinical markers, including HbA1c and insulin resistance index.
Subjects and methods
The Ethics Committee of Sixth People’s Hospital affiliated with Shanghai Jiao Tong University (No 2016004) approved the study protocol, including monitoring and analysis of dynamic electrocardiogram data. Each study subject provided written informed consent.
Study subjects
We consecutively recruited 50 T2DM patients without hypertension (T2DM group) and 95 T2DM patients with hypertension (T2DM+HT group), aged 36–74 years, at Shanghai Jiao Tong University Affiliated Sixth People’s Hospital from January 2013 to March 2016. Diabetes mellitus was diagnosed in accordance with the American Diabetes Association criteria:20 HbA1c ≥6.5%; or fasting plasma glucose (FPG) ≥7.0 mmol/L; or 2-h plasma glucose in oral glucose tolerance test (OGTT) ≥11.1 mmol/L. Fasting was defined as no food or drink (except water) for at least 8 h.
Essential hypertension21 is defined as high blood pressure in which secondary causes such as renovascular disease, renal failure, pheochromocytoma, and aldosteronism, or other causes of secondary hypertension, are not present. Hypertension was diagnosed in accordance with the 1999 World Health Organization (WHO) diagnostic criteria for essential hypertension: systolic blood pressure (SBP) ≥140 mmHg or diastolic blood pressure (DBP) ≥90 mmHg, in the absence of antihypertensive drugs. Patients who had a past diagnostic history of hypertension and were currently using antihypertensive drugs were also classified as hypertensive, even if their current blood pressure levels were below the WHO diagnostic cutoff points.
Excluded from this study were patients with the following conditions: severe liver or renal insufficiency, cancer, or acute myocardial infarction; using medications that may affect HRV; and secondary hypertension, and presence of non-sinus rhythm (eg, atrial fibrillation or atrial flutter) or using a cardiac pacemaker.
Also enrolled in this study were 50 healthy subjects as the control group, aged 39–72 years. These participants had no history of alcohol drinking or smoking and were without diabetes, hypertension, or other major diseases, based on results of the 75-g OGTT, blood pressure measurements, echocardiography, electrocardiogram, X-ray, and biochemical tests.
Glycemic status assessment
We measured fasting blood glucose (FBG), 2-h postprandial glucose in OGTT (2hPG), HbA1c, and fasting insulin. The homeostasis model assessment-insulin resistance index (HOMA-IR) was calculated by the Matthews et al formula:22 HOMA-IR=FBG×fasting insulin/22.5.
Blood pressure measurement
Blood pressure was measured after at least 5-min rest using a calibrated mercury sphygmomanometer. The measurements were performed twice, and the average value was calculated.
Dynamic electrocardiogram examination
All subjects received a 24-h long-term electrocardiogram examination within a week after enrollment. The recorded data were analyzed using an offline DMS dynamic electrocardiogram analysis system (DM Software, Stateline, NV, USA). The average heart rate (AHR), DC, heart rate acceleration capacity (AC), and DRs were calculated.11,12 DRs included episodes of 2, 4, or 8 consecutive beat-to-beat heart rate decelerations (DR2, DR4, and DR8, respectively).12
Indicators of HRV were determined by time-domain analysis using the DMS analysis software. Specifically, these were the SD of all normal-to-normal sinus RR intervals over 24 h (SDNN) and the root mean square of the successive normal sinus RR interval difference (RMSSD).
Transthoracic echocardiography
The LVEF was measured in all subjects within a week after enrollment by transthoracic echocardiography using the Philips iE33 Ultrasounds System.
Statistical analysis
Data were analyzed using SPSS version 19.0 software (IBM Corporation, Armonk, NY, USA). Each variable was examined for normal distribution, and any variables that were significantly skewed were addressed by log transformation. Continuous variables with normal distribution were expressed as mean±SD. Continuous variables with skewed distribution were expressed as median (25%–75% interquartile range).
Comparisons among groups were evaluated using analysis of variance, with Tukey’s honest significant difference method for post hoc multiple-comparison analysis. Pearson’s or Spearman’s partial correlation, as appropriate, was used to assess correlations between variables. Stepwise multiple regression, with P≤0.05 as entry criteria and P≥0.10 as removal criteria, was used to estimate the association of DC and DRs with other variables in all subjects. P<0.05 was statistically significant.
Results
There was no significant difference in age or gender ratio among the T2DM, T2DM+HT, and control groups (P>0.05; Table 1). Compared with the control group, the T2DM and T2DM+HT groups had significantly higher levels of HOMA-IR, FPG, 2hPG, HbA1c, and SBP and DBP. The triglyceride, SBP, and DBP levels of the T2DM+HT group were significantly higher than that of the T2DM group (P<0.05). In addition, use of angiotensin-converting enzyme inhibitor (ACEI) and angiotensin receptor blocker (ARB) in the T2DM+HT group was significantly more prevalent than T2DM group (P<0.001). As expected, diabetes duration was longer in T2DM patients with hypertension compared with those without hypertension (P<0.05). Regarding indicators of ANS function (Table 2), compared with the control group, the T2DM and T2DM+HT groups had significantly lower DC, AC, SDNN, RMSSD, DR2, DR4, and DR8 (all P<0.05), and significantly higher AHR (P<0.01 and P<0.001 in the T2DM and T2DM+HT groups, respectively). Compared with the T2DM group, the DC value of the T2DM+HT group was significantly lower (P<0.05).
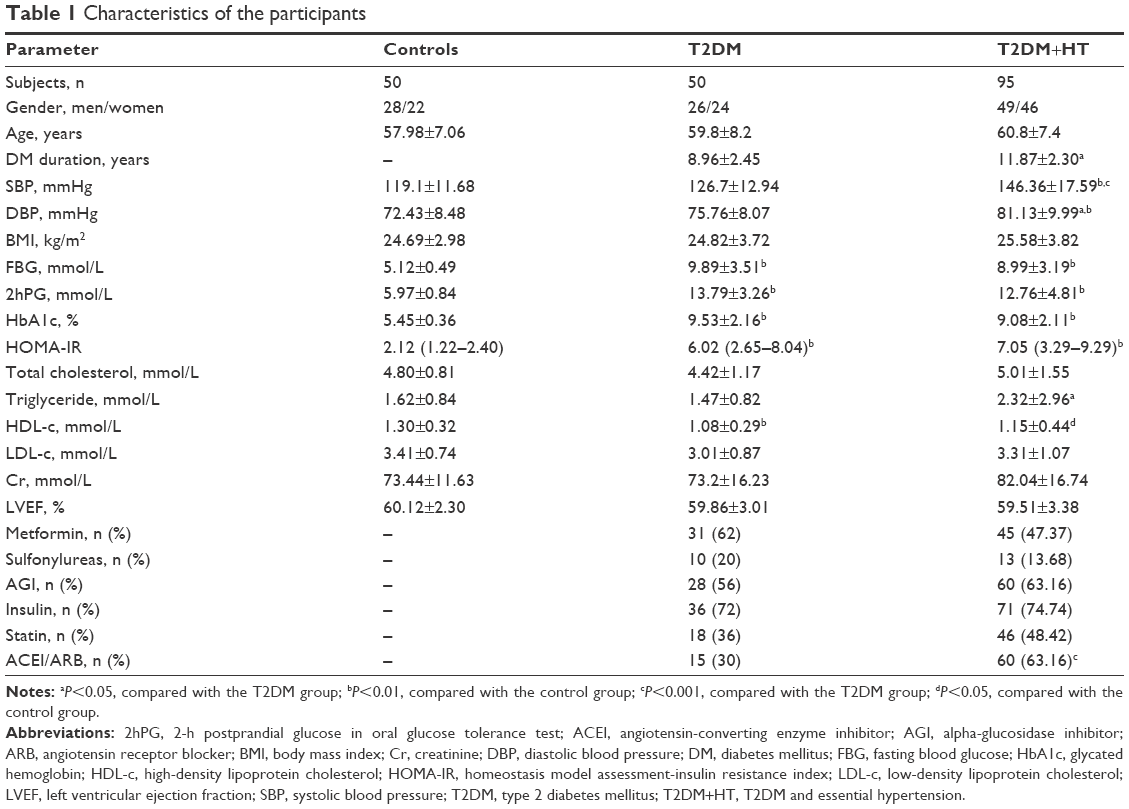 | Table 1 Characteristics of the participants |
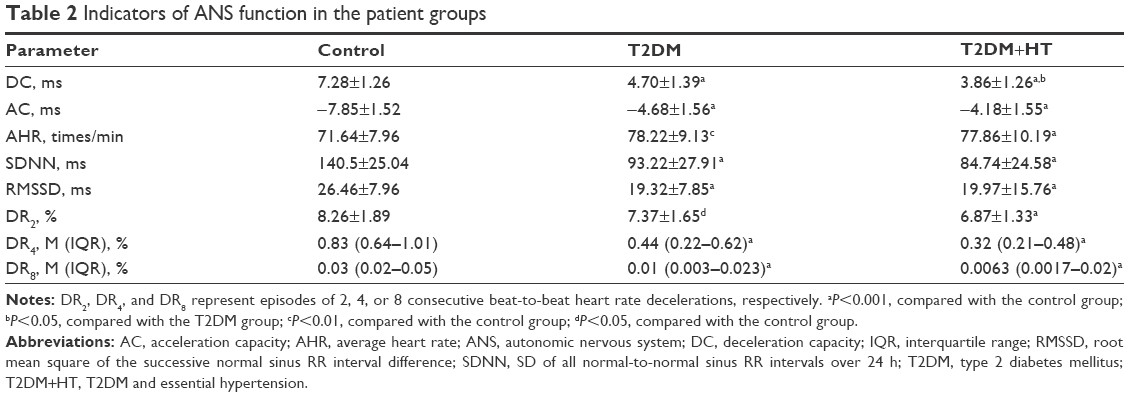 | Table 2 Indicators of ANS function in the patient groups |
Spearman’s correlation analysis (Table 3) showed that DC positively correlated with SDNN and RMSSD, and negatively correlated with SBP, FBG, HbA1c, HOMA-IR, and AHR. DR2 positively correlated with SDNN and RMSSD, and negatively correlated with SBP, HbA1c, HOMA-IR, and AHR. DR4 positively correlated with SDNN and RMSSD, and negatively correlated with HbA1c, HOMA-IR, and AHR. DR8 positively correlated with SDNN and RMSSD, and negatively correlated with HOMA-IR and AHR.
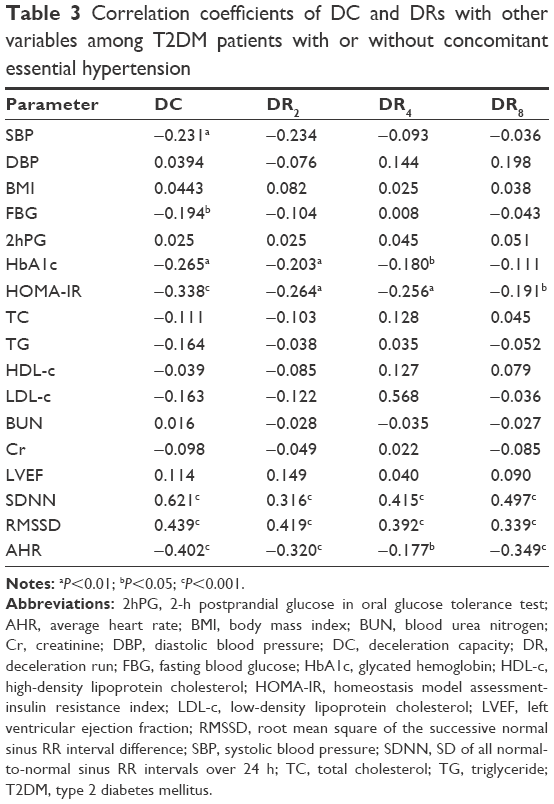 | Table 3 Correlation coefficients of DC and DRs with other variables among T2DM patients with or without concomitant essential hypertension |
A stepwise multiple regression analysis was conducted after adjusting for gender, DBP, body mass index, FBG, HOMA-IR, total cholesterol, triglycerides, low-density lipoprotein cholesterol, blood urea nitrogen, serum creatinine, and LVEF (Table 4). DC was significantly associated with age, HbA1c, SBP, AHR, and high-density lipoprotein cholesterol (HDL-C). DR2 was significantly associated with AHR, SBP, and HbA1c. DR4 was significantly associated with age, HbA1c, SBP, and HDL-C. DR8 was significantly associated with age, HbA1c, and AHR.
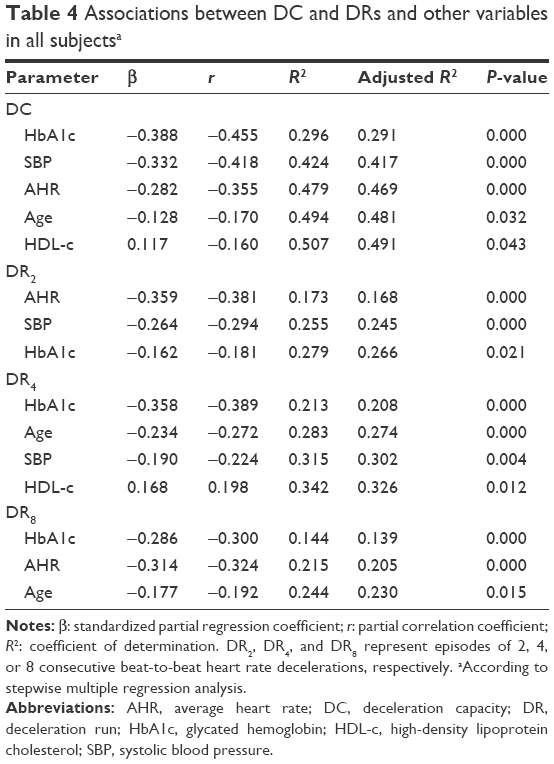 | Table 4 Associations between DC and DRs and other variables in all subjectsa |
Discussion
This study examined the heart rate DC and DRs of Chinese patients with T2DM, with or without essential hypertension, and the association of these parameters with traditional clinical markers. We observed that patients with T2DM, with or without hypertension, had significantly lower DC and DRs compared with the healthy controls. This indicated impaired ANS function in these patients.
In the present study, T2DM patients, regardless of the presence of complicated hypertension or acute myocardial infarction, had autonomic dysfunction; therefore, DC and DRs may also be applicable in T2DM patients for the assessment of autonomic function.
Our results showed that DC, DR2, DR4, and DR8 in the T2DM patients, with and without hypertension, were lower than that of the healthy subjects, while AC and AHR were higher. Moreover, DC positively correlated with DR2, DR4, and DR8 and negatively correlated with AHR. The reduction of DRs paralleled the reduction in DC, leading to an increase in heart rate. These findings indicate that T2DM patients, with or without essential hypertension, may have a sympathovagal imbalance (ie, decreased vagal tone and increased sympathetic tone), and the impaired ANS function may compromise its protective effect on the heart.
This study also showed that AC and AHR were significantly higher in the T2DM group and T2DM+HT group compared with the control group. These findings were consistent with previous studies by Aune et al.23,24 Resting heart rate is known to be a sensitive indicator of the ANS, and elevation in resting heart rate has been associated with increased risk of cardiovascular disease, cancer, and total mortality. Moreover, elevations in resting heart rate may increase myocardial oxygen consumption, fatigue, and fracture of elastic fibers within the arterial wall, further advancing the formation of atherosclerotic lesions as a consequence.
We also observed that the DC levels of T2DM patients with hypertension were lower than that of the T2DM patients without hypertension. This finding, consistent with the results of the cardiovascular reflex test and the HRV study by Istenes et al,25 indicates that hypertension may worsen the impaired autonomic function of patients with T2DM.
In the stepwise multiple regression analysis, we observed a significant and independent association of DC with age, HbA1c, SBP, AHR, and HDL-C. DRs were also significantly associated with most of these markers. Such findings suggest that DC and DRs gradually decrease with increases in age, blood glucose, and blood pressure, and AHR and HDL-C may also be involved in changes in DC and DRs. Results from the partial correlation analysis showed that HbA1c may be the most important contributor to the change of DC and DRs. Hyperglycemia, hypertension, and hyperlipidemia contribute significantly to the development and progression of CAN. Therefore, to prevent or delay the development of CAN in T2DM patients with hypertension, clinicians should pay more attention to controlling blood glucose, blood pressure, and blood lipids.9,10
In the present study, HOMA-IR negatively correlated with DC, DR2, DR4, and DR8 in the T2DM patients with and without complicated hypertension. This indicates that ANS dysfunction with increased sympathetic tone and decreased vagal tone may become worse with the progression of insulin resistance. Similar findings were reported by Nakano et al26 using a positive glucose hyperinsulinemic clamp technique. ANS dysfunction and insulin resistance are underlying common mechanisms of T2DM and essential hypertension.18,27 Insulin resistance can induce activation of the sympathetic nerve, which subsequently leads to the development of hypertension. T2DM and hypertension may aggravate insulin resistance, which is negatively correlated with DC and DRs. The exact mechanisms of these pathophysiological processes are still to be elucidated.
HRV is the coefficient of variation of the RR intervals between successive cardiac cycles and can be used to evaluate the tension and balance of the cardiac sympathetic vagus nerve and their effect on cardiovascular activities. A reduction in HRV indicates impaired cardiac autonomic function and increased risk of sudden death.28,29 The present study showed that T2DM patients with and without hypertension had significantly lower SDNN and RMSSD, indicating that these patients may suffer from impaired cardiac autonomic function. This is consistent with previous studies.25,29 In addition, the DC levels of T2DM patients with hypertension positively correlated with SDNN and RMSSD. This indicates that DC may be linked with traditional markers of autonomic nerve function.
CAN is a common complication of diabetes. The lack of specific symptoms makes the clinical diagnosis of CAN challenging, in particular at an early stage. At present, many methods are available to assess ANS function in T2DM, but there is no gold standard.10 DC and DRs are reliable, sensitive, and specific measures of the quantitative intensity of the vagal and sympathetic nerves, respectively.11,12 The measurement of DC and DRs can be performed with the dynamic electrocardiogram examination, without the need of additional equipment or facilities. Therefore, DC and DRs can be used as noninvasive indicators for the assessment of ANS function in patients with T2DM and may have great value for clinical application.
Although several other techniques are available for assessing ANS function, most of them have important shortcomings. First, most techniques usually target indirect regulation, such as HRV and HRT, which are indicators of indirect reflex regulation of blood pressure and heart rate. Second, some methods mix the assessment of sympathetic nerves with vagus nerves and can only provide qualitative but not quantitative assessment or do not differentiate the results as normal or pathological. In addition, some techniques are usually performed under specific conditions. For example, HRT detection requires ventricular premature beat, and baroreflex sensitivity needs an injection with phenylephrine. In comparison, the DC detection technology has obvious advantages because it is simple and easy to implement, does not require specific conditions, can quantitatively measure vagal and sympathetic nerve intensity, and is highly reliable, sensitive, and specific.
This study has some limitations. First, some of the patients may have been taking medications such as ACEIs, ARBs, or statins that may affect ANS function, and it has been reported that ACEI/ARB can ameliorate autonomic dysfunction in patients with diabetes.30 However, there is no evidence that these drugs specifically influence the DC or DRs. More research is warranted in this regard. Second, we excluded patients with atrial fibrillation, atrial flutter, and cardiac pacemakers in this study. Therefore, our findings may not be directly generalized to these patients. Third, the sample size of this study is small. Large-scale, multicenter prospective studies are needed to confirm our findings.
Conclusion
T2DM patients with or without essential hypertension have lower levels of DC and DRs compared with healthy subjects, impaired autonomic function, and increased insulin resistance. HbA1c, SBP, AHR, age, and HDL-C are the main determinants of DC and DRs, and they may be contributing factors in the development and progression of CAN. DC and DRs can be used as noninvasive markers for quantitative assessment of ANS function in T2DM patients.
Acknowledgments
This study was funded by the Key Disciplines Group Construction Project of Pudong Health Bureau of Shanghai (No. PWZxq2014-07) and the Pudong New Area Science and Technology Development Fund (No PKJ2013-Y70). The funders had no role in the study design, data collection and analysis, decision to publish, or preparation of the manuscript. The authors thank Drs Shaojun Yin and Weixing Zhang for their help with participant recruitment and writing of the manuscript.
Disclosure
The authors report no conflicts of interest in this work.
References
Vinik AI, Maser RE, Mitchell BD, Freeman R. Diabetic autonomic neuropathy. Diabetes Care. 2003;26(5):1553–1579. | ||
Carnethon MR, Jacobs DR Jr, Sidney S, Liu K; CARDIA Study. Influence of autonomic nervous system dysfunction on the development of type 2 diabetes: the CARDIA study. Diabetes Care. 2003;26(11):3035–3041. | ||
Kuehl M, Stevens MJ. Cardiovascular autonomic neuropathies as complications of diabetes mellitus. Nat Rev Endocrinol. 2012;8(7):405–416. | ||
Valensi P, Paries J, Attali JR; French Group for Research and Study of Diabetic Neuropathy. Cardiac autonomic neuropathy in diabetic patients: influence of diabetes duration, obesity, and microangiopathic complications – the French multicenter study. Metabolism. 2003;52(7):815–820. | ||
Boulton AJ, Vinik AI, Arezzo JC, et al. Diabetic neuropathies: a statement by the American Diabetes Association. Diabetes Care. 2005;28(4):956–962. | ||
Tang ZH, Zeng F, Li Z, Zhou L. Association and predictive value analysis for resting heart rate and diabetes mellitus on cardiovascular autonomic neuropathy in general population. J Diabetes Res. 2014;2014:215473. | ||
Vinik AI, Ziegler D. Diabetic cardiovascular autonomic neuropathy. Circulation. 2007;115(3):387–397. | ||
Dimitropoulos G, Tahrani AA, Stevens MJ. Cardiac autonomic neuropathy in patients with diabetes mellitus. World J Diabetes. 2014;5(1):17–39. | ||
Balcioglu AS, Muderrisoglu H. Diabetes and cardiac autonomic neuropathy: clinical manifestations, cardiovascular consequences, diagnosis and treatment. World J Diabetes. 2015;6(1):80–91. | ||
Spallone V, Ziegler D, Freeman R, et al. Cardiovascular autonomic neuropathy in diabetes: clinical impact, assessment, diagnosis, and management. Diabetes Metab Res Rev. 2011;27(7):639–653. | ||
Bauer A, Kantelhardt JW, Barthel P, et al. Deceleration capacity of heart rate as a predictor of mortality after myocardial infarction: cohort study. Lancet. 2006;367(9523):1674–1681. | ||
Guzik P, Piskorski J, Barthel P, et al. Heart rate deceleration runs for postinfarction risk prediction. J Electrocardiol. 2012;45(1):70–76. | ||
Hu W, Jin X, Zhang P, et al. Deceleration and acceleration capacities of heart rate associated with heart failure with high discriminating performance. Sci Rep. 2016;6:23617. | ||
Zuern CS, Rizas K, Eick C, Sterz K, Gawaz M, Bauer A. Prevalence and predictors of severe autonomic failure in patients with insulin-dependent type 2 diabetes mellitus and coronary artery disease: pilot study. J Electrocardiol. 2012;45(6):774–779. | ||
Barthel P, Bauer A, Muller A, et al. Reflex and tonic autonomic markers for risk stratification in patients with type 2 diabetes surviving acute myocardial infarction. Diabetes Care. 2011;34(8):1833–1837. | ||
Xu YH, Wang XD, Yang JJ, Zhou L, Pan YC. Changes of deceleration and acceleration capacity of heart rate in patients with acute hemispheric ischemic stroke. Clin Interv Aging. 2016;11:293–298. | ||
Wang X, Jiang Z, Chen B, et al. Cardiac autonomic function in patients with acute exacerbation of chronic obstructive pulmonary disease with and without ventricular tachycardia. BMC Pulm Med. 2016;16(1):124. | ||
Frontoni S, Bracaglia D, Gigli F. Relationship between autonomic dysfunction, insulin resistance and hypertension, in diabetes. Nutr Metab Cardiovasc Dis. 2005;15(6):441–449. | ||
Mancia G, Grassi G. The autonomic nervous system and hypertension. Circ Res. 2014;114(11):1804–1814. | ||
American Diabetes Association. Diagnosis and classification of diabetes mellitus. Diabetes Care. 2011;34 Suppl 1:S62–S69. | ||
Carretero OA, Oparil S. Essential hypertension. Part I: definition and etiology. Circulation. 2000;101(3):329–335. | ||
Matthews DR, Hosker JP, Rudenski AS, Naylor BA, Treacher DF, Turner RC. Homeostasis model assessment: insulin resistance and beta-cell function from fasting plasma glucose and insulin concentrations in man. Diabetologia. 1985;28(7):412–419. | ||
Aune D, Ó Hartaigh B, Vatten LJ. Resting heart rate and the risk of type 2 diabetes: a systematic review and dose–response meta-analysis of cohort studies. Nutr Metab Cardiovasc Dis. 2015;25(6):526–534. | ||
Aune D, Sen A, ó’Hartaigh B, et al. Resting heart rate and the risk of cardiovascular disease, total cancer, and all-cause mortality – a systematic review and dose–response meta-analysis of prospective studies. Nutr Metab Cardiovasc Dis. 2017;27(6):504–517. | ||
Istenes I, Korei AE, Putz Z, et al. Heart rate variability is severely impaired among type 2 diabetic patients with hypertension. Diabetes Metab Res Rev. 2014;30(4):305–312. | ||
Nakano S, Kitazawa M, Ito T, et al. Insulin resistant state in type 2 diabetes is related to advanced autonomic neuropathy. Clin Exp Hypertens. 2003;25(3):155–167. | ||
Stern MP. Diabetes and cardiovascular disease. The “common soil” hypothesis. Diabetes. 1995;44(4):369–374. | ||
Heart rate variability. Standards of measurement, physiological interpretation, and clinical use. Task Force of the European Society of Cardiology and the North American Society of Pacing and Electrophysiology. Circulation. 1996;93(5):1043–1065. | ||
Spallone V, Bellavere F, Scionti L, et al. Recommendations for the use of cardiovascular tests in diagnosing diabetic autonomic neuropathy. Nutr Metab Cardiovasc Dis. 2011;21(1):69–78. | ||
Didangelos TP, Arsos GA, Karamitsos DT, Athyros VG, Georga SD, Karatzas ND. Effect of quinapril or losartan alone and in combination on left ventricular systolic and diastolic functions in asymptomatic patients with diabetic autonomic neuropathy. J Diabetes Complications. 2006;20(1):1–7. |
 © 2018 The Author(s). This work is published and licensed by Dove Medical Press Limited. The
full terms of this license are available at https://www.dovepress.com/terms
and incorporate the Creative Commons Attribution
- Non Commercial (unported, 3.0) License.
By accessing the work you hereby accept the Terms. Non-commercial uses of the work are permitted
without any further permission from Dove Medical Press Limited, provided the work is properly
attributed. For permission for commercial use of this work, please see paragraphs 4.2 and 5 of our Terms.
© 2018 The Author(s). This work is published and licensed by Dove Medical Press Limited. The
full terms of this license are available at https://www.dovepress.com/terms
and incorporate the Creative Commons Attribution
- Non Commercial (unported, 3.0) License.
By accessing the work you hereby accept the Terms. Non-commercial uses of the work are permitted
without any further permission from Dove Medical Press Limited, provided the work is properly
attributed. For permission for commercial use of this work, please see paragraphs 4.2 and 5 of our Terms.