Back to Journals » International Journal of Nanomedicine » Volume 14
ATP-loaded biomimetic nanoparticles as controlled release system for extracellular drugs in cancer applications
Authors Díaz-Saldívar P, Huidobro-Toro JP ![]()
Received 31 October 2018
Accepted for publication 21 February 2019
Published 5 April 2019 Volume 2019:14 Pages 2433—2447
DOI https://doi.org/10.2147/IJN.S192925
Checked for plagiarism Yes
Review by Single anonymous peer review
Peer reviewer comments 3
Editor who approved publication: Dr Thomas Webster
Patricia Díaz-Saldívar, Juan Pablo Huidobro-Toro
Laboratory of Pharmacology, Deparment of Biology, Faculty of Chemistry and Biology, Center for the Development of Nanoscience and Nanotechnology, University of Santiago de Chile, Santiago, Chile
Purpose: The antitumoral effect of ATP requires its accumulation in the extracellular space to interact with membrane receptors in target cells. We propose the use of albumin nanoparticles (ANPs) coated with erythrocyte membranes (EMs) to load, deliver, release, and enhance the extracellular anticancer activity of ATP.
Materials and methods: ANPs were synthesized by desolvation method and optimal values of pH, albumin concentration, and ethanol volume were determined. EMs were derived from erythrocyte lysates and were coated on to ANPs using an extruder. Size was determined by transmission electron microscopy (TEM) and hydrodynamic size and zeta potential were determined by dynamic light scattering. Coating of the ANPs with the EMs was verified by TEM and confocal microscopy. Nanoparticle cell uptake was analyzed by confocal microscopy using HeLa and HEK-293 cell cultures treated with nanoparticles stained with 1,1'-dioctadecyl-3,3,3',3'- tetramethylindodicarbocyanine, 4-chlorobenzenesulfonate salt (DiD) for EM-ANPs and Alexa 488 for ANPs. Cell viability was analyzed by [3-(4,5-dimethylthiazol-2-yl)-5-(3-carboxymethoxyphenyl)-2-(4-sulfophenyl)-2H-tetrazolium, inner salt (MTS) and Annexin V/propidium iodide assays.
Results: Optimal values of ANP preparation were as follows: pH=9, 10 mg/mL albumin concentration, and 2.33±0.04 mL ethanol volume. Size distributions as analyzed by TEM were as follows: ANPs =91.9±4.3 nm and EM-ANPs =98.3±5.1 nm; hydrodynamic sizes: ANPs =180.5±6.8 nm and EM-ANPs =197.8±3.2 nm; and zeta potentials: ANPs =17.8±3.5 mV, ANPs+ATP =-13.60±0.48 and EM-ANPs =-13.7±2.9 mV. The EMs coating the ANPs were observed by TEM and confocal microscopy. A fewer number of internalized EM-ANPs+ATP compared to non-coated ANPs+ATP was observed in HeLa and HEK-293 cells. Cell viability decreased up to 48.6%±2.0% with a concentration of 400 µM ATP after 72 hours of treatment and cell death is caused mainly via apoptosis.
Conclusion: Our current results show that it is possible to obtain nanoparticles from highly biocompatible, biodegradable materials and that their coating with EMs allows the regulation of the internalization process in order to promote extracellular activity of ATP.
Keywords: ATP, albumin nanoparticle, erythrocyte membrane–coated nanoparticle, biomimetic nanoparticles
Introduction
ATP – produced by mitochondrial oxidative phosphorylation – serves as the main source of energy for most cellular functions and it is consumed by many enzymes in the catalysis of numerous chemical processes. In addition, in the past 25 years, there is compelling evidence that ATP and related nucleotides serve as extracellular signals.1 As purinergic signals, both ATP and adenosine act as extracellular messenger molecules by binding to P2-type (P2X and P2Y receptor families) and P1-type (A1, A2A, A2B, and A3) receptors, respectively.2 These receptors are expressed in most types of cells – both normal and cancerous – and have been studied for their participation in purinergic signaling that has a pathophysiological role in cancer and many other diseases.3
Rapaport4,5 was the first to demonstrate that the addition of exogenous ATP to pancreatic and colon cancer cells inhibited cell growth by causing cell cycle arrest in the S phase. Subsequent studies confirmed the antineoplastic action of extracellular nucleotides in a plethora of cancer types such as colorectal, leukemia, esophageal, squamous cell skin, lung, cervical, prostate, bladder, retinoblastoma, neuroblastoma, glioma, melanoma, and H35 hepatoma cells.6 Growth inhibition of cancer cells is caused by an increase in extracellular ATP concentration that would be mediated by the stimulation of several purinoreceptors such as P2X5, P2X7, P2Y1, P2Y2, and P2Y11. The stimulation of P2Y1 and P2Y2 receptors increases cellular cyclic AMP that leads to proliferation arrest and, in some cases, produces apoptosis in both melanoma and squamous skin cancer cells. The stimulation of P2X5 and P2Y11 produces cell cycle arrest, thereby stopping proliferation and favoring cell differentiation. Finally, the purinoreceptor P2X7 – the receptor of the purinergic signaling pathway – is the most accepted mediator of apoptosis or necrosis in different tumor cell lines.6–8
Despite the benefits that ATP exhibits for the treatment of cancer, its major disadvantage is that it is rapidly degraded when it enters the bloodstream, thus requiring high doses to achieve its therapeutic effect. In vivo studies performed in mice showed that daily doses of 25 mg/kg of ATP administered intraperitoneally for 60 days significantly reduced tumor sizes compared to the untreated group.9 Moreover, clinical studies have reported that cancer patients tolerate ATP well after intravenous administration, side effects are minimal, and cancer-caused cachexia is decreased, which suggests that when used in combination with another treatment ATP may contribute to the reduction of side effects.10–12 Recently, Rapaport et al reported that the administration of ATP by continuous infusion for 8 hours did not increase the extracellular ATP concentration, a finding that could be due to the fact that ATP is rapidly metabolized by multiple ecto-ATPases, since erythrocytes can sequester large amounts of the nucleotide for a later release.13 This type of administration represents a disadvantage for the application of ATP in patients with cancer because it is not possible to raise the concentration of extracellular ATP required to generate the anticarcinogenic effect. Therefore, administering ATP as coated nanoparticles could be a reasonable alternative to prevent its rapid metabolism.
The encapsulation of ATP in chitosan nanoparticles has been reported. Hence, chitosan nanoparticles have been prepared using a combination of techniques such as W/O microemulsion, chemical cross-linking, and ionic complexation. The resulting nanoparticles were approximately 110 nm in diameter, with a 20 mV surface zeta potential (Z potential), an ATP loading efficiency of up to 40.6%–69.5%, and an in vitro release of ATP of up to 80% in the first 24 hours. In addition, these nanoparticles could be captured by Hep G2 tumor cells and could be applied for the intracellular administration of drugs.14 The encapsulation of ATP in chitosan nanoparticles by the ionotropic gelation method for the treatment of ischemia and HIV infections or to restore ATP levels in macrophages has also been reported. ATP serves as a cross-linking agent, which bestows ATP nanoparticles with high drug-trapping efficiency and a loading rate of up to 44%. In addition, when chitosan was previously stabilized with Fe+3, the stability of the nanoparticles in physiological medium and their uptake by mouse J774 macrophages were improved.15,16 In all these applications, ATP nanoparticles were used to achieve an increase in the intracellular concentrations of the nucleotide.
This research aimed at finding a new way to deliver ATP as an anticancer agent and to design and characterize a drug-delivery system based on nanoparticles. Specifically, we use nanoparticles made of albumin, characterized by their biocompatibility, ease of preparation, high adsorption capacity, and a sustained release rate over time, used for medical purposes in humans.17,18 Nanoparticles were coated with erythrocyte cell membranes to decrease their rate of cellular internalization19 as a desirable parameter for enhanced extracellular activity of ATP in cancer therapy.
Materials and methods
Materials
Bovine serum albumin (BSA; fraction V) and adenosine 5′-triphosphate disodium salt hydrated were purchased from Sigma (St Louis, MO, USA). CellTiter 96® AQueous One Solution Cell Proliferation Assay was purchased from Promega Corporation (Fitchburg, WI, USA). Ethanol and other chemicals used to prepare phosphate buffers were of analytical grade and obtained from Merck (Germany).
Preparation of nanoparticles
Synthesis of albumin nanoparticles (ANPs)
For the synthesis of ANPs, parameters such as albumin concentration, pH values, and ethanol concentration, all necessary to obtain nanoparticles with a size close to 200 nm and with the lowest polydispersity, were optimized. For this purpose, 10, 20, or 40 mg of BSA was weighed and dissolved separately in 1 mL of distilled water with constant agitation on a magnetic stirrer at 800 rpm for 10 minutes. The pH of the solution was adjusted to a range of 7–10 by adding 0.1 N NaOH solution drops; the solution was then stirred under the same conditions for additional 5 minutes, and absolute ethanol was added by continuous dripping at a frequency of 1 mL/min and stirred until the solution turned turbid, which indicated nanoparticle formation. The suspension was centrifuged at 13,000 rpm, the supernatant was discarded, and the isolated nanoparticles were resuspended in water; this procedure was repeated three times.
Synthesis of ANPs+ATP
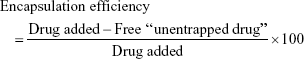
For the synthesis of ANPs loaded with ATP, 10 mg of bovine serum albumin was weighed and dissolved in 1 mL of water, with constant agitation on a magnetic stirrer at 800 rpm for 10 minutes. The pH of the solution was then adjusted to 9 by adding 50 μL of 0.1 N NaOH and the solution was stirred under the same conditions for additional 5 minutes. Absolute ethanol was then added by continuous dripping at a flow of 1 mL/min and stirring until the solution turned cloudy. Then the nanoparticles were centrifuged at 13,000 rpm in a benchtop centrifuge, the supernatant was discarded, and they were resuspended in distilled H2O; this procedure was repeated three times. The nanoparticles obtained were resuspended in a 1 mL phosphate-buffered saline solution (PBS, pH 7.0) with 5 mg/mL of ATP and incubated under agitation for 2, 4, 12, 24, or 48 hours to allow the adsorption of ATP on the ANPs. The amount of adsorbed ATP was determined by measuring the concentration of ATP present in the supernatant after different incubation times using a UV/Vis spectrophotometer at 257 nm (SmartSpec Plus Spectrophotometer; BioRad, Hercules, CA, USA). The ATP-loading content and encapsulation efficiency were calculated as follows:
|
The nanoparticles obtained were characterized by transmission electron microscopy and dynamic light scattering.
Coating of ANPs+ATP with erythrocyte membranes (EMs)
Animal protocols were carried out according to the Guide for the Care and Use of Laboratory Animals from National Research Council, and the study was previously approved by the Institutional Ethics Committee from the Universidad de Santiago de Chile (Santiago, Chile). Adult male Balb C mice were obtained from the Instituto de Salud Pública de Chile and housed in a temperature and humidity-controlled room with a 12-hour light–dark cycle. The EMs were obtained according to the protocol of Hu et al19 with some modifications. To obtain EMs, 1 mL of mice blood was collected in an EDTA tube and then centrifuged at 2357 rpm for 4 minutes at 4°C to separate the serum from the cell fraction. The serum was removed and the erythrocytes were resuspended in 1 mL of PBS, pH 7.0, and this procedure was repeated twice. Then the erythrocytes were placed in hypotonic 0.25× PBS and kept in an ice bath for 60 minutes to lyse the erythrocytes and eliminate the cytoplasmic content. They were washed twice under the same conditions as mentioned previously.
Since the erythrocyte plasma cell membrane contains enzymes that degrade ATP (known as ecto-ATPases), it became necessary to inactivate these enzymes prior to the coating of the nanoparticles loaded with ATP. Lysed erythrocytes were subjected to different temperatures (45, 50, or 56°C) for 30 minutes in order to determine the optimal temperature for the inactivation of the enzymes without loss of the morphology of the lysed erythrocytes. To verify the inactivation of the ecto-ATPases, heat-treated lysed erythrocytes were incubated with an ATP solution of 100 μg/mL in PBS for 1 hour at 37°C. After incubation, lysed erythrocytes were centrifuged and the supernatants were used to detect and quantify ATP concentration by HPLC. Likewise, in order to verify that lysed erythrocytes maintained their structure and morphology after the heat treatment, observations of the different samples were made by field microscopy. Once empty erythrocyte “ghosts” were obtained, they were resuspended in 1 mL of PBS at pH 7.2 and sonicated in a bath sonicator (Branson 2200; Emerson, St Louis, MO, USA) with a frequency of 47 kHz and a power of 154 W for 5 minutes. The obtained “ghosts” of EMs were extruded through a polycarbonate membrane of 400 nm, and subsequently through a second membrane of 200 nm of porosity with the help of a miniextruder (Avanti Polar Lipids, Alabaster, AL, USA) and reserved to coat the ANPs.
To coat the nanoparticles, 100 μL of the suspension of processed EMs was added to 1 mL of ANPs+ATP suspension. This mixture was then extruded 15 times through a polycarbonate membrane of 200 nm with the aid of a miniextruder. The resulting nanoparticles were washed with PBS by centrifugation and reserved for use.
Nanoparticle characterization
Nanoparticle morphology was determined by electron microscopy; observations were performed in a Hitachi transmission electron microscope (Hitachi, Tokyo, Japan). Measurements of the diameter of the nanoparticles were taken to determine size distribution. Nanoparticle samples were placed on copper grids and dried at room temperature before observation. The nanoparticles were placed in a 300-mesh copper grid coated with carbon (Ted Pella Inc., Altadena, CA, USA). To assess size distribution, the diameters of 300 nanoparticles randomly chosen in different microscopic fields were measured.
Hydrodynamic size and the Z potential of the nanoparticles were determined by dynamic light scattering and electrophoretic mobility principles using the Zetasizer Nano ZS analyzer (Malvern Instruments Ltd, Malvern, UK) operating at a wavelength of 633 nm and a fixed dispersion angle of 173° to measure the nanoparticle dimensions. A 1 mL aliquot of each suspension was placed in a disposable polycarbonate cuvette (DTS 1061; Malvern). All measurements were made at a constant temperature of 25°C and pH 7.4. Measurements of both the empty EMs and the nanoparticles were taken.
Stability in PBS, water, and cell culture medium was assessed by monitoring particle size using dynamic light scattering. Specifically, 1 mg of nanoparticles was suspended in 1 mL of PBS, water, or cell culture medium and the sizes were measured at room temperature on days 1, 3, 7, and 15.20–22
In vitro ATP release study
To assess the rate of ATP release from the EM-ANPs+ATP, an in vitro release study was performed using nanoparticles with and without EM coating. Eppendorf tubes containing 10 mg of EM-ANPs+ATP nanoparticles dispersed in a total volume of 1 mL of PBS (pH 7.4) were placed in a shaking bath at 37°C under constant agitation. At predetermined time intervals, samples were centrifuged at 10,000 g for 10 minutes and 100 μL of the collected supernatant was mixed with 100 μL of a 10% trichloroacetic acid solution and incubated for 20 minutes to precipitate the sample proteins; this mixture was centrifuged at 10,000 g for 10 minutes. The collected supernatant was diluted in 800 μL of distilled water and the amount of ATP in the samples was determined by a UV/Vis spectrophotometer at 257 nm, using the procedure described above.
Cell uptake
Cellular uptake of ANPs+ATP and EM-ANPs+ATP was analyzed by confocal microscopy as described with some modifications.23, HeLa and HEK-293 cell lines (obtained commercially from ATCC) were cultured on coverslips in 12-well plates with 1 mL of DMEM culture medium supplemented with 1 mM sodium pyruvate, 100 IU/mL penicillin, 100 μg/mL streptomycin, and 10% fetal bovine serum and kept in a humid environment at 37°C with 95% air and 5% CO2. ANPs+ATP with or without EMs coating were used. Uncoated ANPs+ATP were labeled with the green fluorescence dye Alexa fluor 488 NHS Ester (Thermo Fisher Scientific, Waltham, MA, USA). The succinimidyl esters (NHS esters) of the Alexa Fluor form a very stable amide bond between the dye and the protein. Amine-reactive reagents react with non-protonated aliphatic amine groups, including the amine terminus of proteins and the ε-amino group of lysines.24 The ε-amino group has a pKa of around 10.5; in order to maintain this amine group in the non-protonated form, the conjugation must take place in 0.1 M sodium bicarbonate buffer at pH 8.3 for 1 hour. Coated EM-ANs+ATP were labeled with the red fluorescence dye 1,1′-dioctadecyl-3,3,3′,3′-tetramethyl lindodicarbocyanine, 4-chlorobenzenesulfonate salt (DiD; Thermo Fisher Scientific). After the cultured cells reached 50% confluence, culture medium was removed and replaced with unsupplemented medium with 10 ng/mL of fluorescent nanoparticles. After 4 hours of incubation, living cells were stained with 10 μg/mL of Hoechst (Thermo Fisher Scientific) in PBS for 10 minutes. Cells were fixed with 2% paraformaldehyde and mounted with 1,4-diazabicyclo[2.2.2]octane solution (Dabco; Sigma) to be subsequently observed under confocal microscopy. The samples of nanoparticles and cells were observed and analyzed using 488 nm excitation for nanoparticles with Alexa fluor and 556 nm excitation for nanoparticles with DiD under a Zeiss confocal laser scanning microscope, model LSM 800 (Carl Zeiss, Jena, Germany). Serial section photographs of the cells were captured every 1 μm and up to 10 μm deep (Z axis) in order to observe variations in distribution of the nanoparticles inside the cells.
Cell viability assay
Cytotoxicity of free ATP and ATP-loaded nanoparticles against HeLa cell line was assessed using [3-(4,5-dimethylthiazol- 2-yl)-5-(3-carboxymethoxyphenyl)-2-(4-sulfophenyl)- 2H-tetrazolium, inner salt (MTS) cell proliferation assay (CellTiter 96® AQueous One Solution Cell; Promega Corporation). Cells were first seeded (~5×10³ per well) in 96-well plates and incubated overnight. After the addition of free ATP or EM-ANPs+ATP, cells were incubated for additional 72 hours. Cell viability was then determined by using a tetrazolium compound (MTS) following the protocol provided by the manufacturer.
Apoptosis and necrosis study
After treatment of HeLa cells with 40, 200, and 400 μM of EM-ANPs+ATP and 3.7 mM of ATP for 72 hours, apoptosis or necrosis occurrence was evaluated using the Dead Cell Apoptosis Kit with Annexin V Alexa Fluor 488 and propidium iodide (PI) (Thermo Fisher Scientific) as described.25 Cells were harvested using 0.25% trypsin solution and resuspended in Annexin binding buffer at a concentration of 2×10⁶ cells/mL. Five microliters of Annexin V Alexa Fluor 488 conjugate and 1 μL of PI working solution were added to 100 μL of the cell suspension and incubated for 15 minutes. After addition of 200 μL of Annexin V binding buffer, the samples were analyzed using a BD Accuri™ C6 Flow Cytometer (BD Biosciences, San Jose, CA, USA). Untreated HeLa cells were used as negative control and HeLa cells pretreated with 500 μM of H2O2 were used as positive control.
Statistical analysis
Data were presented as mean and standard error of mean. All the data were first subjected to Shapiro–Wilk normality test and it was found that the data were not normally distributed; hence, statistical analysis was carried out by non-parametric Kruskal–Wallis test followed by Dunn’s post hoc test using GraphPad Prism (version 5; GraphPad Software, Inc., La Jolla, CA, USA). A P-value ≤0.05 was considered statistically significant.
Results
Preparation of EM-ANPs+ATP
Different preparation techniques of ANPs have been described, with the method of desolvation being the most reported.26 In the desolvation process, nanoparticles are obtained by a continuous dropwise ethanol addition to an aqueous solution of albumin under continuous stirring until turbidity. During the addition of ethanol, albumin is phase-separated due to its poor water solubility.27 Nanoparticle size is affected by the pH and concentration of the albumin solution and the volume of ethanol added to form the nanoparticles.22
Variations in albumin concentration increased the size of the nanoparticles. As described in Figure 1, an average nanoparticle size of 224.4±6.9 nm was achieved with a polydispersity index of 0.23±0.024 using 10 mg/mL of BSA, which indicates that they are monodisperse nanoparticles and hence the value was <0.3. By increasing the albumin concentration to 20 and 40 mg/mL, sizes of 350.5±17.9 and 559.1±22.1 nm were obtained, with a polydispersity index of 0.135±0.01 and 0.445±0.06 nm, respectively. For subsequent experiments, a concentration of 10 mg/mL was used since nanoparticles with the smallest average size were obtained.
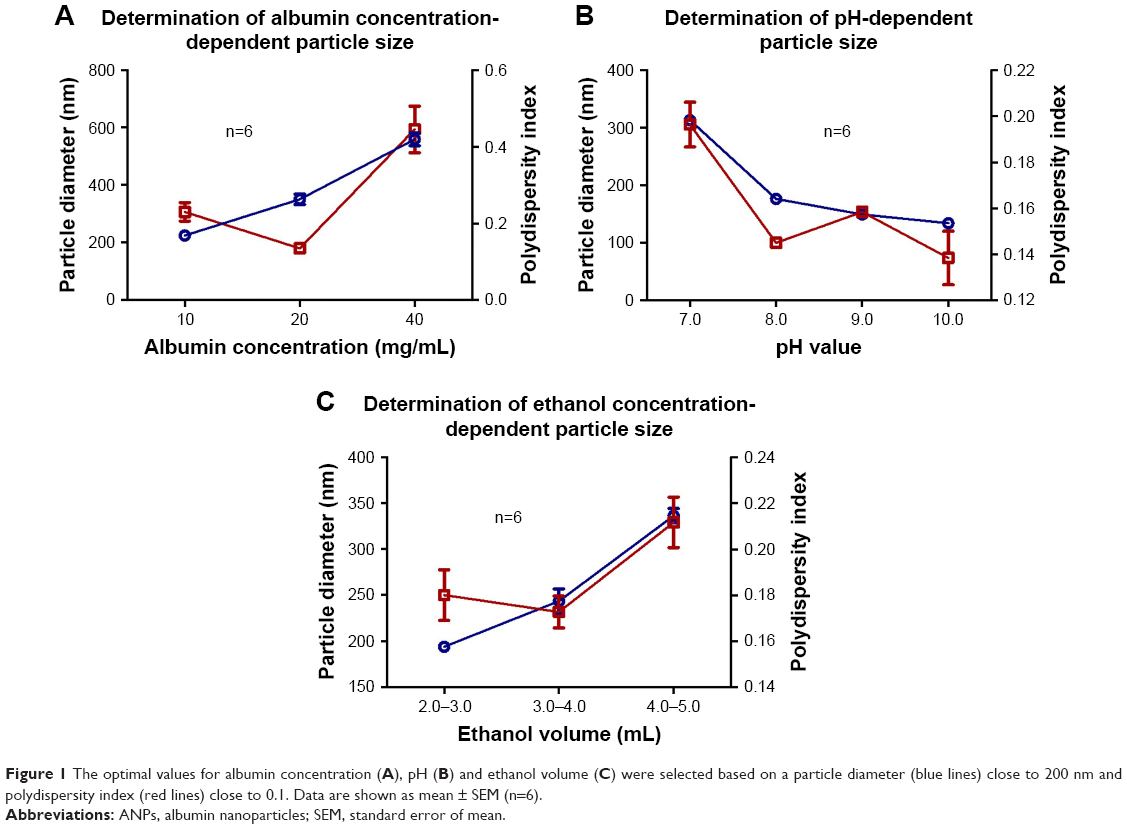 | Figure 1 The optimal values for albumin concentration (A), pH (B) and ethanol volume (C) were selected based on a particle diameter (blue lines) close to 200 nm and polydispersity index (red lines) close to 0.1. Data are shown as mean ± SEM (n=6). |
The pH value of the albumin solution is a factor that strongly influenced the nanoparticle size distribution. At pH 7.0, an average size of 313.2±3.4 nm was observed, whereas at pH values of 8, 9, and 10, a decrease in size was observed as the pH became more alkaline. To keep the nanoparticle size close to 200 nm, a pH of 9.0 was chosen for the albumin solutions to be used in subsequent experiments. Regarding the polydispersity index, values <0.1 were observed for all groups, which indicate that they are monodisperse nanoparticles. The sizes of ANPs in nanometers and the values of the polydispersity index are summarized in Figure 1.
The volume of the ethanol added to the mixture also influenced the size of the nanoparticles, since they tended to aggregate when the alcohol volume was larger. According to the results obtained, the best volume of ethanol for albumin precipitation and nanoparticles formation fell within a range of 2–3 mL.
The ATP was loaded to the nanoparticles by incubation with agitation for different time periods. A gradual increase in the amount of loaded ATP was observed as the incubation time increased, reaching 84.4%±1.7% at 48 hours of incubation (Figure 2). The amount of ATP loaded by 48 hours was 390.1±8.2 μg/mg of nanoparticles (Figure 2), which represents a loading capacity of 39%.
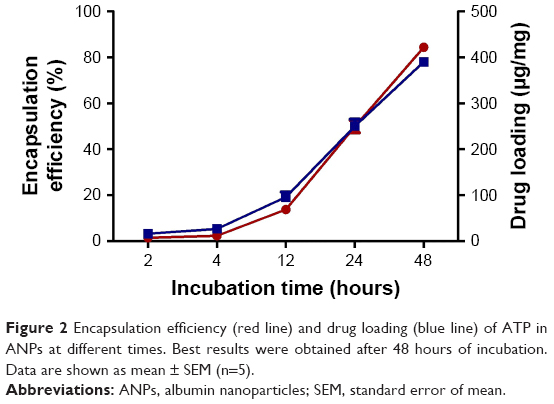 | Figure 2 Encapsulation efficiency (red line) and drug loading (blue line) of ATP in ANPs at different times. Best results were obtained after 48 hours of incubation. Data are shown as mean ± SEM (n=5). |
EMs were obtained by hypotonic treatment with 0.25× PBS, which was effective in lysing the erythrocytes (Figure 3A). Lysed erythrocytes maintained the shape and size similar to the untreated erythrocytes, although a loss of cytoplasmic content was observed, thus turning the solution clearer. Regarding the effect of temperature on the stability of EMs after ecto-ATPases inhibition, it was observed that the structure of the membranes was maintained up to 45°C (Figure 3B), a temperature that was also sufficient to inhibit the activity of ecto-ATPases since ATP concentrations did not decrease in comparison to control treatment (ATP solution without EMs; Figure 3C). A significant reduction in ATP concentration was observed only in the solution incubated with EMs without heat treatment (EMs 25; Figure 3C). EMs coating contributed to increased stability of the nanoparticles and, therefore, it was not necessary to use cross-linking agents such as glutaraldehyde that has been widely reported as a stabilizing agent for ANPs obtained by the desolvation method.28 This procedure permitted to increase the biocompatibility of the nanoparticles.
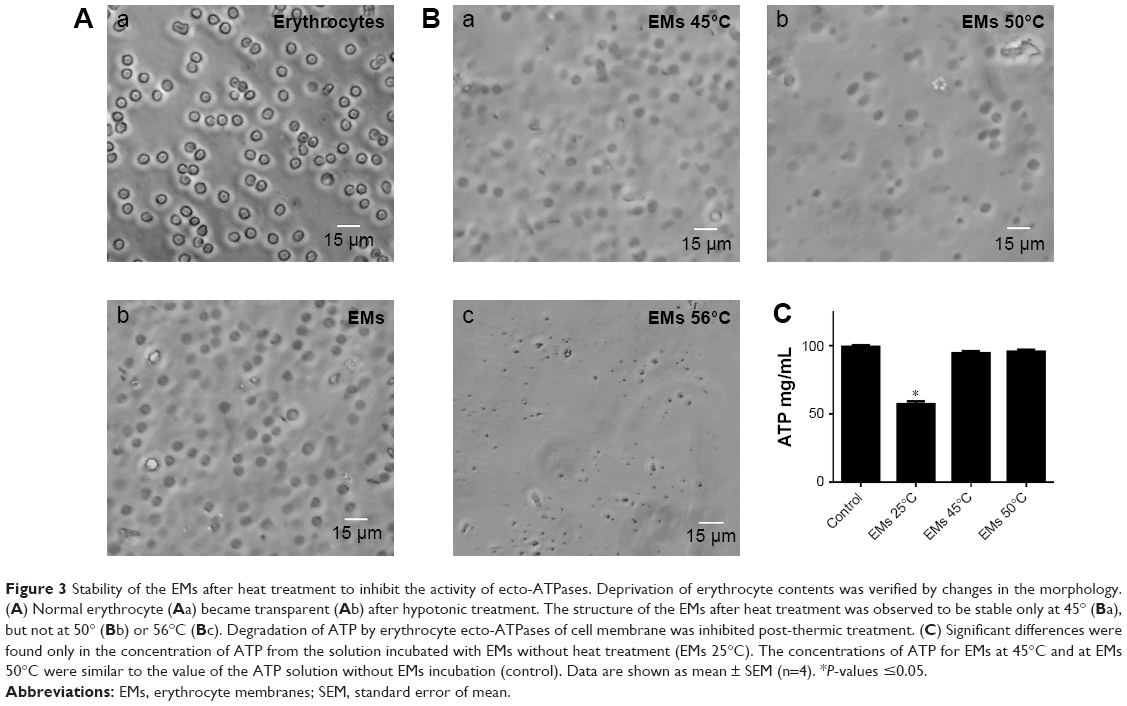 | Figure 3 Stability of the EMs after heat treatment to inhibit the activity of ecto-ATPases. Deprivation of erythrocyte contents was verified by changes in the morphology. (A) Normal erythrocyte (Aa) became transparent (Ab) after hypotonic treatment. The structure of the EMs after heat treatment was observed to be stable only at 45° (Ba), but not at 50° (Bb) or 56°C (Bc). Degradation of ATP by erythrocyte ecto-ATPases of cell membrane was inhibited post-thermic treatment. (C) Significant differences were found only in the concentration of ATP from the solution incubated with EMs without heat treatment (EMs 25°C). The concentrations of ATP for EMs at 45°C and at EMs 50°C were similar to the value of the ATP solution without EMs incubation (control). Data are shown as mean ± SEM (n=4). *P-values ≤0.05. |
Nanoparticles characterization
The morphology and covering of nanoparticles were determined and characterized by electron and confocal microscopies (Figure 4). EMs covering ANPs+ATP were identified by the presence of a halo surrounding the nanoparticles in electron microscopy (Figure 4A) and by the colocalization of the fluorophores Alexa Fluor 488 (ANPs+ATP) and DiD (EMs) in confocal microscopy (Figure 4B). The average size of nanoparticles by electron microscopy was 98.2±1.42 nm for ANPs+ATP and 102.6±1.67 nm for EM-ANPs+ATP (Figure 4C), which indicates that EM coating did not influence size. The hydrodynamic size was also determined; it was observed that the size of the obtained nanoparticles was close to 200 nm, with values of 176.8±4.9, 182.2±4.7, and 208.0±10.8 nm (mean ± SE) for ANPs, ANPs+ATP, and EM-ANPs+ATP, respectively (Figure 5).
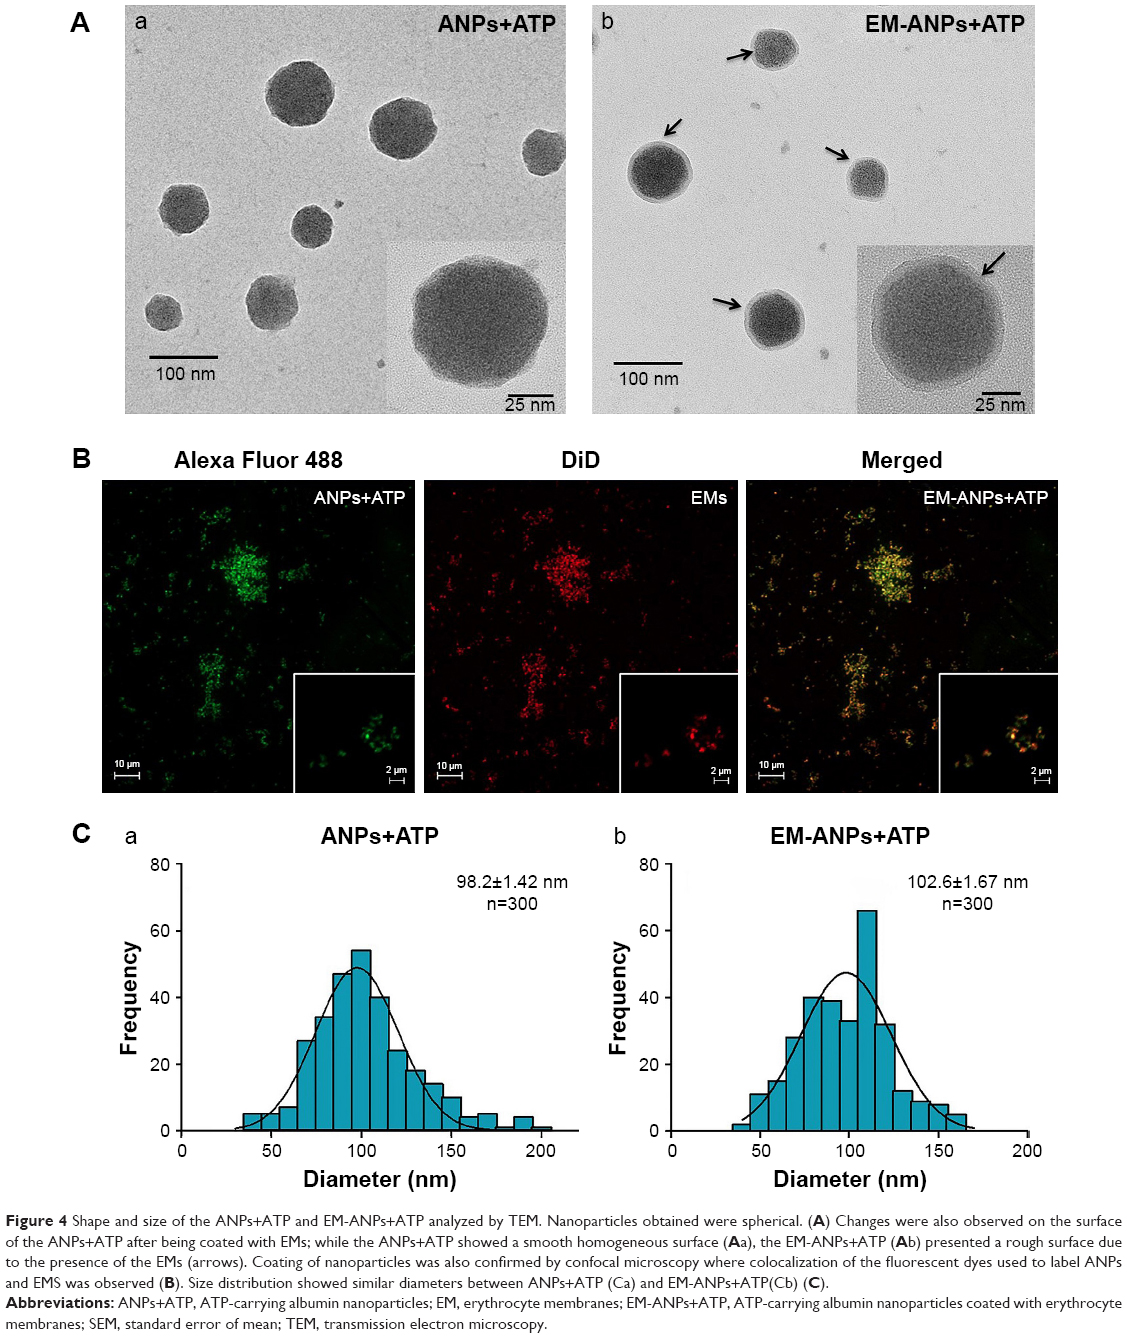 | Figure 4 Shape and size of the ANPs+ATP and EM-ANPs+ATP analyzed by TEM. Nanoparticles obtained were spherical. (A) Changes were also observed on the surface of the ANPs+ATP after being coated with EMs; while the ANPs+ATP showed a smooth homogeneous surface (Aa), the EM-ANPs+ATP (Ab) presented a rough surface due to the presence of the EMs (arrows). Coating of nanoparticles was also confirmed by confocal microscopy where colocalization of the fluorescent dyes used to label ANPs and EMS was observed (B). Size distribution showed similar diameters between ANPs+ATP (Ca) and EM-ANPs+ATP(Cb) (C). |
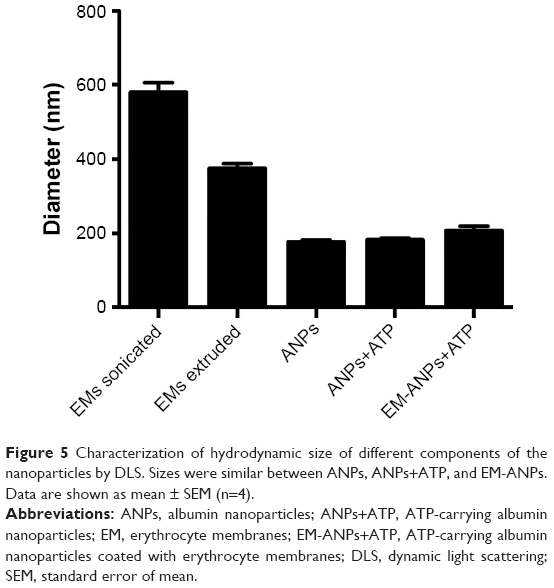 | Figure 5 Characterization of hydrodynamic size of different components of the nanoparticles by DLS. Sizes were similar between ANPs, ANPs+ATP, and EM-ANPs. Data are shown as mean ± SEM (n=4). |
The Z potential showed that ANPs had a positive surface charge, which turned into negative after ATP absorption and membrane coating (results are summarized in Table 1). The surface Z potential of ANPs changed from +17.83±0.35 mV to -13.60±0.48 mV in ANPs+ATP to -13.71±0.29 upon fusing with the EM vesicles. At neutral pH, all oxygen ions of the phosphate of ATP are negatively charged, so in consequence triphosphate chains repel each other.29 Some of these phosphate groups may be present on the nanoparticle surface after the loading process, thus changing the Z potential values from positive to negative. EM vesicles alone have a negative charge similar to erythrocyte cells, which create a repulsive electric Z potential between cells.30 This property is maintained after the process of ANPs coating so that the stability and dispersion of the obtained nanoparticles are favored.
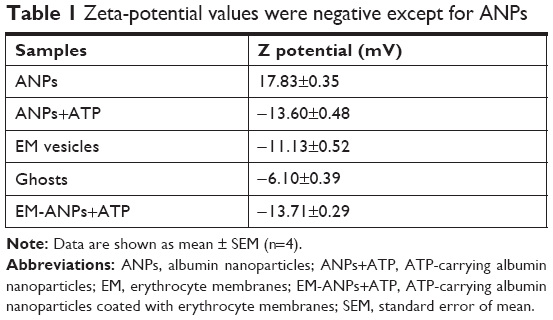 | Table 1 Zeta-potential values were negative except for ANPs |
The stability of EM-ANPs+ATP was also analyzed. For this, nanoparticles were maintained in PBS, water, or cell culture medium and hydrodynamic size measurements were assessed during 1, 2, 4, 7, and 15 days after synthesis. The size tended to increase over time at a percentage of 11.3, 6.4, and 8.7% on days 4, 7, and 15, respectively, in water suspension vs PBS or cell culture medium suspension. An increase in nanoparticle size could be due to the fact that albumin and EMs, considering their biological origin, have better stability in isotonic and neutral pH solutions similar to PBS and cell culture medium, thus making nanoparticles more stable in these solutions. Data shown in Figure 6 also depicts the values of the polydispersity index.
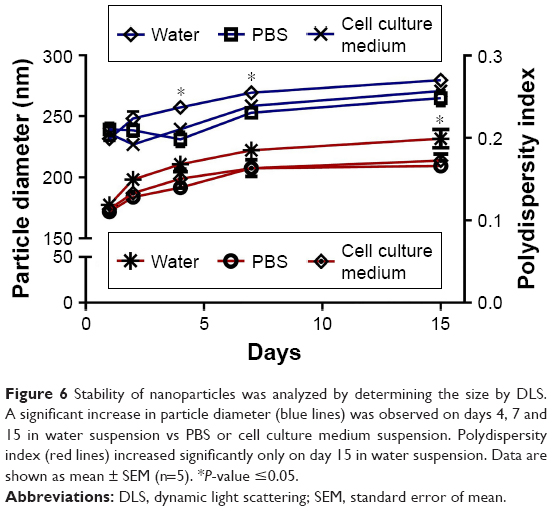 | Figure 6 Stability of nanoparticles was analyzed by determining the size by DLS. A significant increase in particle diameter (blue lines) was observed on days 4, 7 and 15 in water suspension vs PBS or cell culture medium suspension. Polydispersity index (red lines) increased significantly only on day 15 in water suspension. Data are shown as mean ± SEM (n=5). *P-value ≤0.05. |
In vitro drug release
The release of ATP from EM-ANPs formulations was assessed in PBS at 37°C. The drug release was determined at predetermined intervals up to 5 days. The cumulative percentage of released ATP is shown in Figure 7. Both ANPs+ATP and EM-ANPs+ATP formulations exhibited controlled release up to 5 days. In the first 2 hours, a rapid release of ATP loaded on both ANPs+ATP (16.25%±1.12%) and EM-ANPs+ATP (8.75%±0.64%) was observed. Subsequently, the release rate became slower, reaching a maximum of 35.25%±0.74% for ANPs+ATP and 24.25%±0.99% for EM-ANPs+ATP on the fifth day of evaluation, thus validating the use of the EM coating.
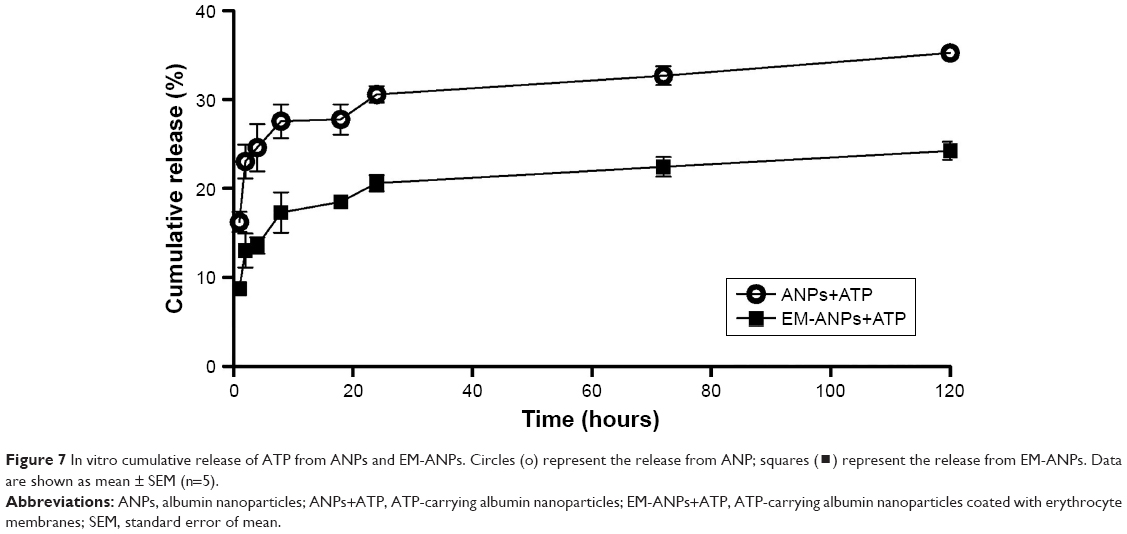 | Figure 7 In vitro cumulative release of ATP from ANPs and EM-ANPs. Circles (o) represent the release from ANP; squares (?) represent the release from EM-ANPs. Data are shown as mean ± SEM (n=5). |
In both cases, the drug appeared to be released in a biphasic way, characterized by an initial rapid release period followed by a step of slower release. Drug release from nanoparticles is a process attributed to diffusion following dissociation of the albumin molecules forming the nanoparticle.31 The initial drug release can be considered a burst release of deposited or weakly bound drug molecules on the surface of nanoparticles. The cumulative release was greater in ANPs+ATP than in EM-ANPs+ATP, which likely could be due to the fact that the EMs coating contribute to the stability of the nanoparticle by affecting the dissociation of albumin molecules in the nanoparticles due to its lipidic component. EMs coating would slow down the diffusion rate of ATP, which is a highly water soluble molecule.
Nanoparticles uptake by cells
To validate whether the nanoparticles are of future clinical use, we next assessed whether the ANPs+ATP or EM-ANPs+ATP were uptaken by normal or cancer cells. The intracellular distribution of internalized ANPs+ATP with or without coating was analyzed using confocal laser microscopy. The results showed a higher uptake of ANPs+ATP compared to EM-ANPs+ATP in HEK-293 and HeLa cells (Figure 8). Comparison of uptake by both types of cells showed that HeLa cells internalized a greater amount of ANPs+ATP and EM-ANPs+ATP than HEK-293 did. Perinuclear fluorescence observed in median optical slices showed that the nanoparticles were distributed in the cell cytoplasm rather than merely bound to the cell membrane (Figure 8A and B). Fluorescence intensity measurements in different cells of both cell lines confirmed that EM-ANPs+ATP were internalized by cells in a smaller proportion than ANPs+ATP (Figure 8C). This result revealed that coating with EMs increased the internalization time of the nanoparticles, thus favoring the extracellular ATP release. This functionalization strategy enables erythrocyte transmembrane proteins anchored in their natural lipid environment to be present on nanoparticle surfaces and many of these proteins act as recognition factors by other cells, allowing regular processes of cellular internalization.32
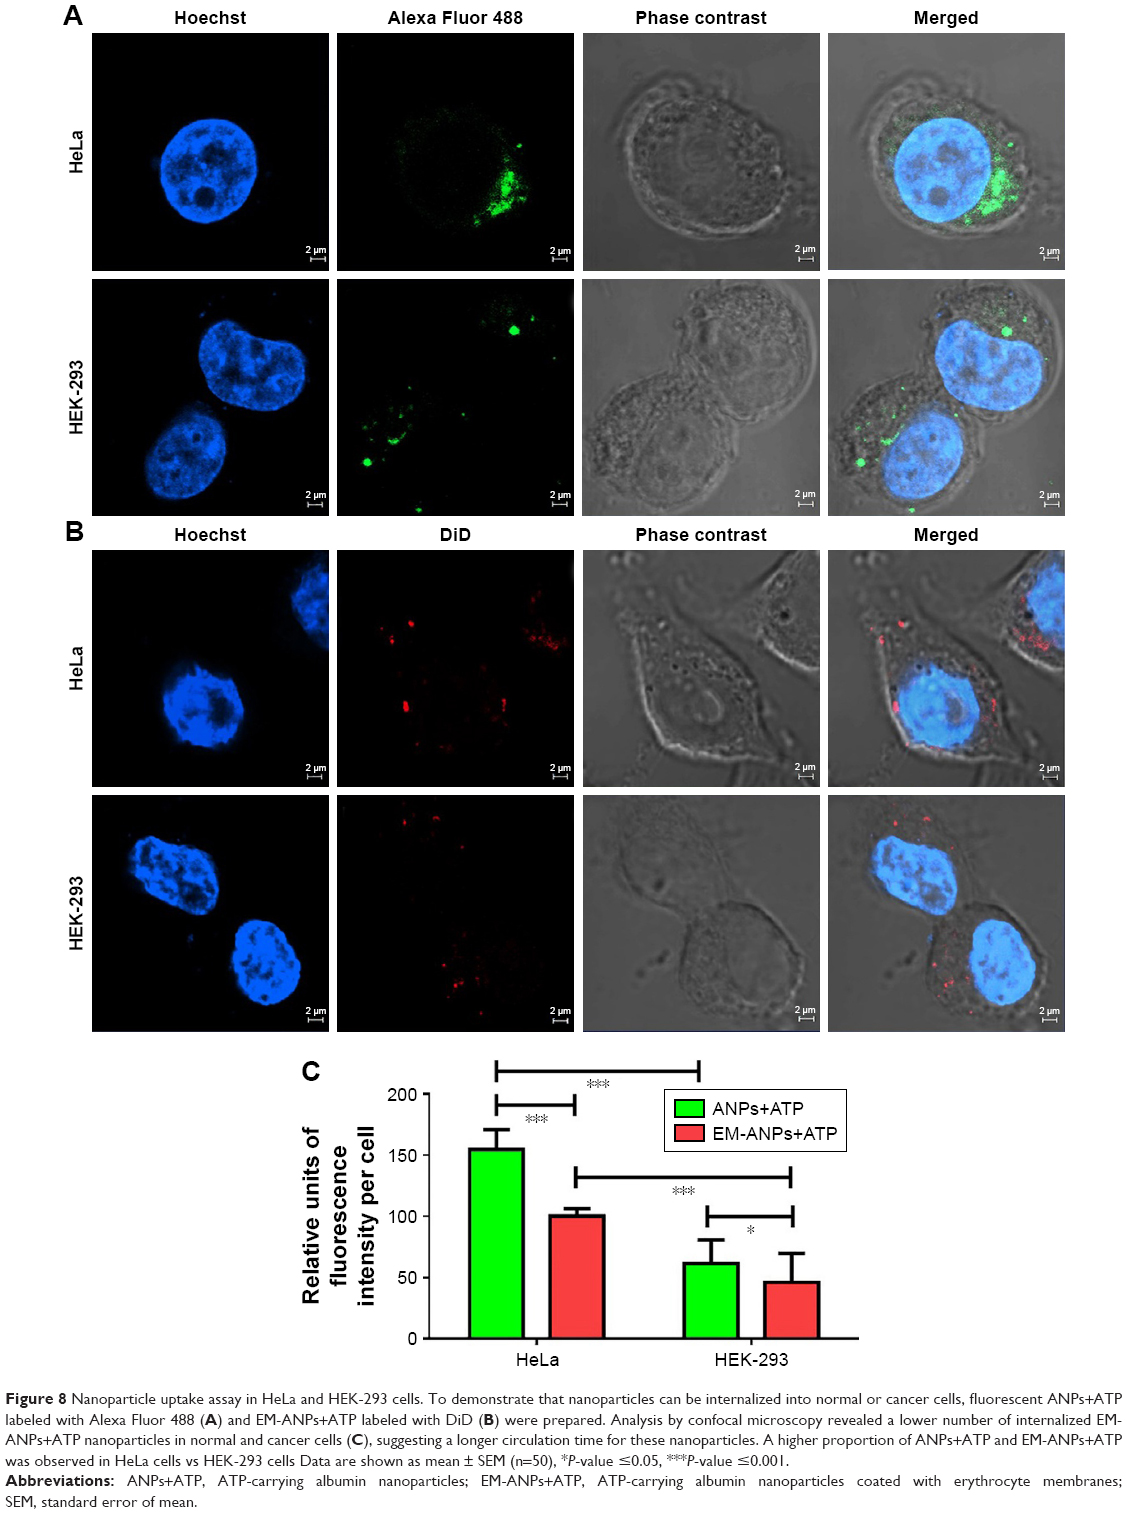 | Figure 8 Nanoparticle uptake assay in HeLa and HEK-293 cells. To demonstrate that nanoparticles can be internalized into normal or cancer cells, fluorescent ANPs+ATP labeled with Alexa Fluor 488 (A) and EM-ANPs+ATP labeled with DiD (B) were prepared. Analysis by confocal microscopy revealed a lower number of internalized EM-ANPs+ATP nanoparticles in normal and cancer cells (C), suggesting a longer circulation time for these nanoparticles. A higher proportion of ANPs+ATP and EM-ANPs+ATP was observed in HeLa cells vs HEK-293 cells Data are shown as mean ± SEM (n=50), *P-value ≤0.05, ***P-value ≤0.001. |
Cell viability assay
To assess the critical relevance of clinical use of ANPs, the therapeutic potential of the EM-ANPs+ATP on HeLa cell line survival and growth was examined. HeLa cells express purinergic P2X5, P2X7, P2Y1, P2Y2, and P2Y11 receptors involved in cell cycle arrest and growth inhibition by increasing the concentration of extracellular ATP.2,3,8,33 Different concentrations of free ATP inhibited the growth of HeLa cells, after a 48-hour treatment with an IC50 of 3.82 mM and after a 72-hour treatment with an IC50 of 2.38 mM (Figure 9A). Treatment with EM-ANPs+ATP after 48 hours did not show signals of cell growth inhibition; however, after 72 hours, a diminution of cell viability up to 48.6%±2.0% with 400 μM of ATP loaded in nanoparticles was registered (Figure 9B). The IC50 of EM-ANPs+ATP was 0.039 mM, almost 100 times lower than the IC50 of free ATP. The release of therapeutic compounds in a sustained manner by EM-ANPs reduces the required dosing and improves treatment efficacy.
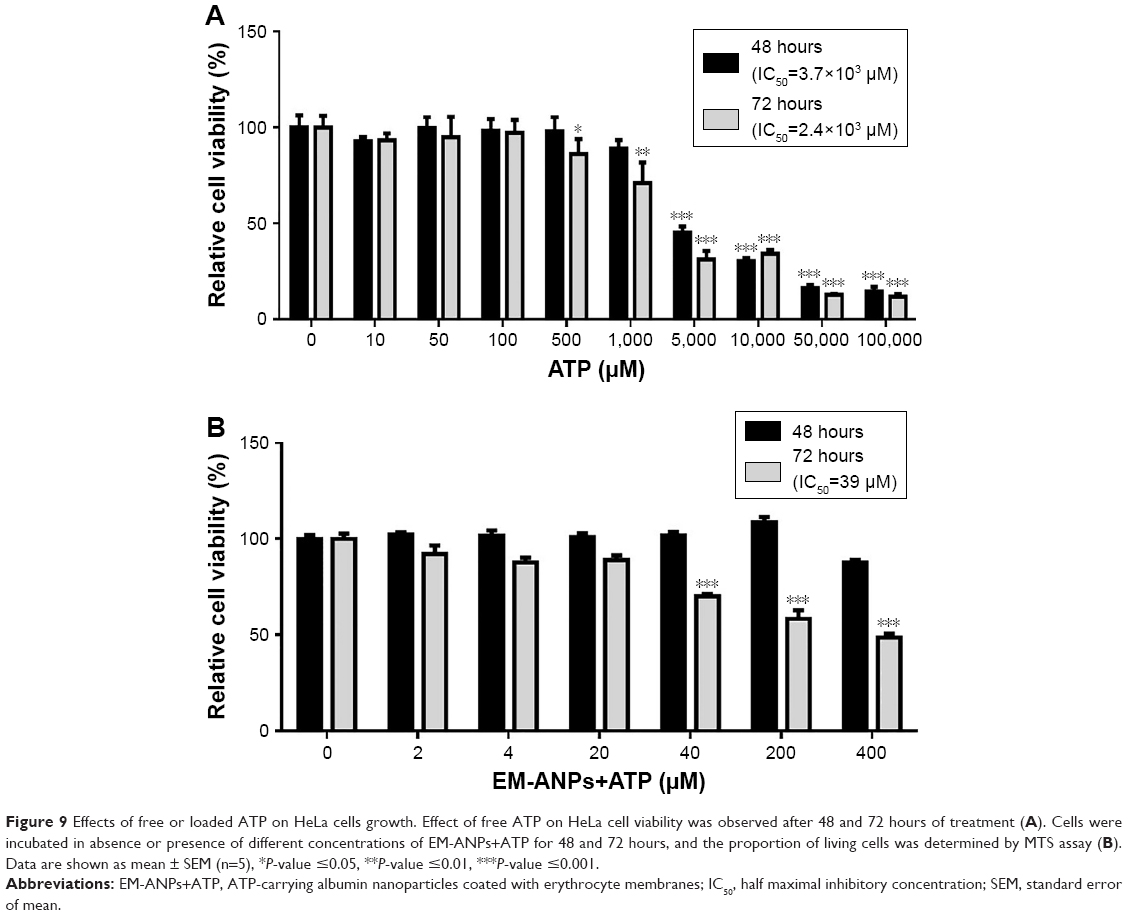 | Figure 9 Effects of free or loaded ATP on HeLa cells growth. Effect of free ATP on HeLa cell viability was observed after 48 and 72 hours of treatment (A). Cells were incubated in absence or presence of different concentrations of EM-ANPs+ATP for 48 and 72 hours, and the proportion of living cells was determined by MTS assay (B). Data are shown as mean ± SEM (n=5), *P-value ≤0.05, **P-value ≤0.01, ***P-value ≤0.001. |
Apoptosis and necrosis study
In order to determine the possible mechanism of cell death, the effect of different concentrations of EM-ANP+ATP after a 72-hour treatment in HeLa cells was evaluated by Annexin V/PI assay. A significant reduction in the percentage of viable cells was observed in all the groups treated with EM-ANP+ATP in comparison to the control group. Interestingly, a 40-fold augmentation in the proportion of apoptotic cells was observed with EM-ANP+ATP 40 μM when compared with EM-ANP+ATP 200 and 400 μM. These results with EM-ANP+ATP 40 μM are similar to those registered for the treatment with free ATP, where a greater proportion of apoptotic cells – rather than necrotic cells – was also observed, which is in agreement with the previous reports.34 With EM-ANP+ATP 200 and 400 μM, a significant and dose-dependent increase in the proportion of necrotic cells was observed, while the H2O2-treated positive control showed a larger number of apoptotic vs necrotic cells (Figure 10A and B).
 | Figure 10 Analysis of apoptosis and necrosis induced by EM-ANPs+ATP by flow cytometry. HeLa cells were treated with 0, 40, 200, and 400 μM EM-ANPs+ATP, 3.7 mM of free ATP and 500 μM of H2O2 as positive control, for 72 hours. The acquisition data were divided into four quadrants according to the type of fluorescence emitted from the cells: Q2-UL calculates the percent of cells undergoing apoptosis (Annexin V), Q2-UR calculates the percent of cells undergoing late apoptosis or induced necrosis (Annexin V and propidium iodide), Q2-LL calculates the percent of cells with no fluorescence, and Q2-LR calculates the percent of cells undergoing necrosis induced by the different treatments (A). Results with EM-ANP+ATP 200 and 400 μM showed an increase in the percentage of necrotic cells compared to free ATP (B). Data are shown as mean ± SEM (n=3). |
Discussion
Nanoparticles interacting with cells and the extracellular environment can trigger a sequence of biological effects. These effects largely depend on the dynamic physicochemical characteristics of nanoparticles, which determine properties such biocompatibility.35 In drug delivery, the nanoparticle’s biocompatibility is important to ensure safe drug release and minimize cytotoxicity.36 We report the preparation and characterization of nanoparticles made with albumin, the most abundant plasma protein, and EMs – biomimetic-coated components that are produced by the body itself and therefore having a high biocompatibility and biodegradability. Important properties of the nanoparticles were characterized and described, such as size, shape, surface charge, and coating with the EMs. We observed that the surface charge of our ANPs changed from positive to negative after the loading of the ATP, which could be due to the fact that at neutral pH (pH 7), the ATP triphosphate chains repel each other as all oxygen ions of the phosphate groups of ATP are negatively charged. Some of these phosphate groups may be present on the nanoparticle surface after the loading process, thus changing the Z potential values from positive to negative.
ATP exerts its antitumor effect by binding to receptors present in the cell plasma membrane, but its potential as a chemotherapeutic agent is low because ATP has a very short half-life due to the different types of enzymes that metabolize and degrade it.37 Therefore, to promote its use as chemotherapy, it is necessary to design strategies that prevent its rapid enzymatic degradation and increase its accumulation in the extracellular space. Our strategy to avoid its rapid enzymatic degradation was designing ANPs capable of loading and releasing ATP. Over the past decades, albumin has emerged as a versatile carrier for therapeutic and diagnostic agents, primarily for diagnosing cancer and other diseases.38 Thanks to these characteristics, added to its high biocompatibility, albumin was selected to obtain nanoparticles loaded with ATP. In order to increase its accumulation in the extracellular space, we used coatings of EMs. Our results showed that this type of coating regulates the release rate of the nanoparticles, allowing controlled ATP release in time and at lower concentrations compared to uncoated nanoparticles. The erythrocyte plasma membrane exhibits different types of molecules that participate in the recognition of the own body components by the immune system; one of these molecules, CD47, interacts with signal regulatory protein α receptors on macrophages, sending a negative signal to macrophages that protects erythrocytes from phagocytosis.39 The coating with an erythrocyte’ plasma membrane confers the same properties on the nanoparticles, thereby extending their circulation time. Our results of cellular uptake showed that there was an increase in internalization time of non-coated nanoparticles in comparison with coated nanoparticles. Different experiments related to cellular uptake have confirmed the effect of physicochemical properties, such as size, shape, and surface modification, on the status of cell–nanoparticles interactions.40 Likewise, a greater ANP uptake was observed in HeLa cells compared with HEK-293 cells. Zhang et al reported that changes in Z potential of the normal and cancer cells after incubation with nanoparticles were produced by a combination of binding and internalization effects to the overall nanoparticle uptake process.41 Changes in surface charge of the cells and cell–nanoparticle interface might affect the internalization patterns and favor a greater uptake by cancer cells vs normal cells as we observed, a phenomenon that could be beneficial for future treatments in vivo. Therefore, the EM coating is not only able to regulate the rate of ATP release but also able to decrease the rate of internalization of the nanoparticles, and this could be reflected as an increased accumulation of ATP in the extracellular space necessary to optimize its pharmacological activity.
Cellular viability assays showed that the anticancer activity of ATP loaded on nanoparticles is augmented compared to that of free ATP. The IC50 of ATP loaded in nanoparticles was almost 100 times lower; however, because it has slow release, its antitumor activity could be observed only after 72 hours as opposed to the activity of free ATP, which can decrease cell viability after 48 hours. The observed enhancement in efficacy to decrease the cellular viability could be likely attributed to decreased endocytic uptake of EM-ANPs+ATP, which permits to increase the concentration of extracellular ATP. On the other hand, several previous reports have shown enhanced cytotoxicity of different drugs through nanoparticle-based delivery.42 Free ATP needs to be at higher concentrations to produce toxicity because it is quickly degraded by ecto-ATPases present on cell surfaces, but the encapsulation of ATP allows the concentration necessary to produce toxicity in the cells to decrease, which could be due to the fact that ATP is protected from the action of ecto-ATPases.43 Apoptosis and necrosis assay in HeLa cells showed that with ATP 3.7 mM (IC50) the proportion of cells undergone apoptosis was greater than cells undergone necrosis and that the percentage of living cells was similar to the values obtained with MTS assay. Results with EM-ANP+ATP 200 and 400 mM showed an inhibitory effect on cell growth via necrosis; this variation could be due to the effect produced by the encapsulation of ATP since similar concentrations of free ATP did not produce the same effect. In contrast to the treatment with free ATP – where a single dose of a unique concentration is applied at the beginning of treatment – the treatment with EM-ANP+ATP produces a constant release of this molecule during the entire assay as revealed by the release experiments and thus could have augmented the number of necrotic cells. EM-ANP+ATP 40 μM did not show this pattern probably because the dose was too low to produce such changes. The current study suggests that EM-ANPs+ATP, with controlled drug release and low rate of cell internalization, may become a promising new cancer treatment. Future studies are warranted to investigate the therapeutic potential of these nanoparticles in in vivo models.
Conclusion
In this study, EM-ANPs were developed as a delivery vehicle for ATP to promote its use as an anticancer agent. The pH and concentrations of albumin and ethanol influence the size and particle yield of ANPs. Loading ATP into ANPs was characterized and the in vitro drug-delivery studies indicated a controlled slow release profile that improved after coating with EMs. Likewise, coating with EMs increased the time of internalization, favoring the extracellular release of ATP. EM-ANPs+ATP reduced the concentrations of ATP needed to decrease cell viability and exhibited higher toxicity in comparison with free ATP. With further development, these EM-ANPs+ATP are expected to become a strategy for drug delivery of ATP in cancer treatment.
Acknowledgments
This work was supported by FONDECYT Postdoctoral Project No 3160837, CONICYT BASAL Grant FB0807, FONDEQUIP EQM 150069, and FONDECYT 1170842. An abstract with the preliminary results of this work was presented in Applied Nanotechnology and Nanoscience International Conference 2017 in Rome, Italy.
Disclosure
The authors report no conflicts of interest in this work.
References
Bours MJ, Swennen EL, Di Virgilio F, et al. Adenosine 5′-triphosphate and adenosine as endogenous signaling molecules in immunity and inflammation. Pharmacol Ther. 2006;112(2):358–404. doi:10.1016/j.pharmthera.2005.04.013 | ||
Burnstock G. Purine and pyrimidine receptors. Cell and Mol Life Sci. 2007;64:1471–1483. doi:10.1007/s00018-007-6497-0 | ||
Burnstock G. Purinergic signalling: pathophysiology and therapeutic potential. Keio J Med. 2013;62(3):63–73. doi:10.2302/kjm.2013-0003-RE | ||
Rapaport E. Treatment of human tumor cells with ADP or ATP yields arrest of growth in the S phase of the cell cycle. J Cell Physiol. 1983;114(3):279–283. doi:10.1002/jcp.1041140305 | ||
Rapaport E, Fishman RF, Gercel C. Growth inhibition of human tumor cells in soft-agar cultures by treatment with low levels of adenosine 5′-triphosphate. Cancer Res. 1983;43(9):4402–4406. | ||
Burnstock G, Di Virgilio F. Purinergic signalling and cancer. Keio J Med. 2013;9(4):491–540. | ||
Burnstock G, Knight GE. Cellular distribution and functions of P2 receptor subtypes in different systems. Int Rev Cytol. 2004;240:31–304. | ||
White N, Burnstock G. P2 receptors and cancer. TRENDS Pharmacol Sci. 2006;27(4):211–217. doi:10.1016/j.tips.2006.02.004 | ||
Shabbir M, Thompson C, Jarmulowiczc M, et al. Effect of extracellular ATP on the growth of hormone-refractory prostate cancer in vivo. BJU Int. 2008;102(1):108–112. doi:10.1111/j.1464-410X.2008.07578.x | ||
Haskell CM, Mendoza E, Pisters KM, et al. Phase II study of intravenous adenosine 5′-triphosphate in patients with previously untreated stage IIIB and stage IV non-small cell lung cancer. Invest New Drugs. 1998;16:81–85. doi:10.1023/A:1006018610986 | ||
Haskell CM, Wong M, Williams A, Lee LY. Phase I trial of extracellular adenosine 5′-triphosphate in patients with advanced cancer. Med Pediatr Oncol. 1996;27:165–173. doi:10.1002/(SICI)1096-911X(199609)27:3<165::AID-MPO6>3.0.CO;2-C | ||
Agteresch HJ, Dagnelie PC, Rietveld T, et al. Pharmacokinetics of intravenous ATP in cancer patients. Eur J Clin Pharmacol. 2000;56:49–55. doi:10.1007/s002280050719 | ||
Rapaport E, Salikhova A, Abraham EH. Continuous intravenous infusion of ATP in humans yields large expansions of erythrocyte ATP pools but extracellular ATP pools are elevated only at the start followed by rapid declines. Purinergic Signal. 2015;11(2):251–262. doi:10.1007/s11302-015-9450-y | ||
Du YZ, Ying XY, Wang L, et al. Sustained release of ATP encapsulated in chitosan oligosaccharide nanoparticles. Int J Pharm. 2010;392(1–2):164–169. doi:10.1016/j.ijpharm.2010.03.050 | ||
Giacalone G, Bochot A, Fattal E, et al. Drug-induced nanocarrier assembly as a strategy for the cellular delivery of nucleotides and nucleotide analogues. Biomacromolecules. 2013;14(3):737–742. doi:10.1021/bm301832v | ||
Giacalone G, Hillaireau H, Capiau P, et al. Stabilization and cellular delivery of chitosan-polyphosphate nanoparticles by incorporation of iron. J Control Release. 2014;194:211–219. doi:10.1016/j.jconrel.2014.08.022 | ||
Zhang L, Gu FX, Chan JM, et al. Nanoparticles in medicine: therapeutic applications and developments. Clin Pharmacol Ther. 2008;83(5):761–769. doi:10.1038/sj.clpt.6100400 | ||
Woods A, Patel A, Spina D, et al. In vivo biocompatibility, clearance, and biodistribution of albumin vehicles for pulmonary drug delivery. J Control Release. 2015;210:1–9. doi:10.1016/j.jconrel.2015.05.269 | ||
Hu CM, Zhang L, Aryal S, et al. Erythrocyte membrane-camouflaged polymeric nanoparticles as a biomimetic delivery platform. Proc Natl Acad Sci. 2011;108(27):10980–10985. doi:10.1073/pnas.1106634108 | ||
Wang S, Zhao J, Yang H, et al. Bottom-up synthesis of WS2 nanosheets with synchronous surface modification for imaging guided tumor regression. Acta Biomater. 2017;58:442–454. doi:10.1016/j.actbio.2017.06.014 | ||
Yang H, Zhao J, Wu C, Ye C, Zou D, Wang S. Facile synthesis of colloidal stable MoS2 nanoparticles for combined tumor therapy. Chem Engin J. 2018;351:548–558. doi:10.1016/j.cej.2018.06.100 | ||
Zhao J, Xie P, Yea C, et al. Outside-in synthesis of mesoporous silica/molybdenum disulfide nanoparticles for antitumor application. Chem Engin J. 2018;351:157–168. doi:10.1016/j.cej.2018.06.101 | ||
Shukla RS, Jain A, Zhao Z, Cheng K. Intracellular trafficking and exocytosis of a multi-component siRNA nanocomplex. Nanomedicine. 2016;12(5):1323–1334. doi:10.1016/j.nano.2016.02.003 | ||
Banks PR, Paquette DM. Comparison of three common amine reactive fluorescent probes used for conjugation to biomolecules by capillary zone electrophoresis. Bioconjug Chem. 1995;6(4):447–458. | ||
Jain A, Barve A, Zhao Z, Jin W, Cheng K. Comparison of avidin, neutravidin, and streptavidin as nanocarriers for efficient siRNA delivery. Mol Pharm. 2017;14(5):1517–1527. doi:10.1021/acs.molpharmaceut.6b00933 | ||
Elzoghby AO, Samy WM, Elgindy NA. Albumin-based nanoparticles as potential controlled release drug delivery systems. J Control Release. 2012;157(2):168–182. doi:10.1016/j.jconrel.2011.07.031 | ||
Langer K, Balthasar S, Vogel V, et al. Optimization of the preparation process for human serum albumin (HSA) nanoparticles. Int J Pharm. 2003;257:169–180. doi:10.1016/S0378-5173(03)00134-0 | ||
Jahanban-Esfahlan A, Dastmalchi S, Davaran S. A simple improved desolvation method for the rapid preparation of albumin nanoparticles. Int J Biol Macromol. 2016;91:703–709. doi:10.1016/j.ijbiomac.2016.05.032 | ||
Hubley MJ, Locke BR, Moerland TS. The effects of temperature, pH, and magnesium on the diffusion coefficient of ATP in solutions of physiological ionic strength. Biochim Biophys Acta. 1996;291(2):115–121. doi:10.1016/0304-4165(96)00053-0 | ||
Fernandes HP, Cesar CL, Barjas-Castro ML. Electrical properties of the red blood cell membrane and immunohematological investigation. Rev Bras Hematol Hemoter. 2011;33(4):297–301. doi:10.5581/1516-8484.20110080 | ||
An FF, Zhang XH. Strategies for preparing albumin-based nanoparticles for multifunctional bioimaging and drug delivery. Theranostics. 2017;7(15):3667–3689. doi:10.7150/thno.19365 | ||
Hu CM, Fang RH, Luk BT, et al. ‘Marker-of-self’ functionalization of nanoscale particles through a top-down cellular membrane coating approach. Nanoscale. 2013;5(7):2664–2668. doi:10.1039/c3nr00015j | ||
Welter-Stahl L, Da Silva CM, Schachter J, et al. Expression of purinergic receptors and modulation of P2X7 function by the inflammatory cytokine IFNgamma in human epithelial cells. Biochim Biophys Acta. 2009;1788(5):1176–1187. doi:10.1016/j.bbamem.2009.03.006 | ||
Deli T, Csernoch L. Extracellular ATP and cancer: an overview with special reference to P2 purinergic receptors. Pathol Oncol Res. 2008;14(3):219–231. doi:10.1007/s12253-008-9071-7 | ||
Nel AE, Mädler L, Velegol D, et al. Understanding biophysicochemical interactions at the nano-bio interface. Nat Mater. 2009;8(7):543–557. doi:10.1038/nmat2442 | ||
Naahidi S, Jafari M, Edalat F, Raymond K, Khademhosseini A, Chen P. Biocompatibility of engineered nanoparticles for drug delivery. J Control Release. 2013;166(2):182–194. doi:10.1016/j.jconrel.2012.12.013 | ||
Di Virgilio F, Sarti AC, Falzoni S, De Marchi E, Adinolfi E. Extracellular ATP and P2 purinergic signalling in the tumour microenvironment. Nat Rev Cancer. 2018;18(10):601–618. doi:10.1038/s41568-018-0037-0 | ||
Elsadek B, Kratz F. Impact of albumin on drug delivery–new applications on the horizon. J Control Release. 2012;157(1):4–28. doi:10.1016/j.jconrel.2011.09.069 | ||
Khandelwal S, van Rooijen N, Saxena RK. Reduced expression of CD47 during murine red blood cell (RBC) senescence and its role in RBC clearance from the circulation. Transfusion. 2007;47(9):1725–1732. doi:10.1111/j.1537-2995.2007.01348.x | ||
Salatin S, Maleki Dizaj S, Yari Khosroushahi A. Effect of the surface modification, size, and shape on cellular uptake of nanoparticles. Cell Biol Int. 2015;(8):881–890. doi:10.1002/cbin.10459 | ||
Zhang Y, Yang M, Portney NG, et al. Zeta potential: a surface electrical characteristic to probe the interaction of nanoparticles with normal and cancer human breast epithelial cells. Biomed Microdevices. 2008;(2):321–328. doi:10.1007/s10544-007-9139-2 | ||
Petros RA, DeSimone JM. Strategies in the design of nanoparticles for therapeutic applications. Nat Rev Drug Discov. 2010;9(8):615–627. doi:10.1038/nrd2591 | ||
Plesner L. Ecto-ATPases: identities and functions. Int Rev Cytol. 1995;158:141–214. |
 © 2019 The Author(s). This work is published and licensed by Dove Medical Press Limited. The
full terms of this license are available at https://www.dovepress.com/terms
and incorporate the Creative Commons Attribution
- Non Commercial (unported, 3.0) License.
By accessing the work you hereby accept the Terms. Non-commercial uses of the work are permitted
without any further permission from Dove Medical Press Limited, provided the work is properly
attributed. For permission for commercial use of this work, please see paragraphs 4.2 and 5 of our Terms.
© 2019 The Author(s). This work is published and licensed by Dove Medical Press Limited. The
full terms of this license are available at https://www.dovepress.com/terms
and incorporate the Creative Commons Attribution
- Non Commercial (unported, 3.0) License.
By accessing the work you hereby accept the Terms. Non-commercial uses of the work are permitted
without any further permission from Dove Medical Press Limited, provided the work is properly
attributed. For permission for commercial use of this work, please see paragraphs 4.2 and 5 of our Terms.