Back to Journals » Clinical Ophthalmology » Volume 9
Associations between signs and symptoms of dry eye disease: a systematic review
Authors Bartlett J, Keith M ![]() , Sudharshan L, Snedecor S
, Sudharshan L, Snedecor S
Received 1 June 2015
Accepted for publication 6 August 2015
Published 16 September 2015 Volume 2015:9 Pages 1719—1730
DOI https://doi.org/10.2147/OPTH.S89700
Checked for plagiarism Yes
Review by Single anonymous peer review
Peer reviewer comments 3
Editor who approved publication: Dr Scott Fraser
Video abstract presented by Jimmy D Bartlett
Views: 574
Jimmy D Bartlett,1 Michael S Keith,2 Lavanya Sudharshan,3 Sonya J Snedecor3
1Department of Optometry, School of Optometry, The University of Alabama at Birmingham, Birmingham, AL, 2Global Health Economics, Outcomes Research, and Epidemiology Department, Research and Development Division, Shire, Wayne, PA, 3Pharmerit International, Bethesda, MD, USA
Purpose: The accurate diagnosis and classification of dry eye disease (DED) is challenging owing to wide variations in symptoms and lack of a single reliable clinical assessment. In addition, changes and severity of clinical signs often do not correspond to patient-reported symptoms. To better understand the inconsistencies observed between signs and symptoms, we conducted a systematic literature review to evaluate published studies reporting associations between patient-reported symptoms and clinical signs of DED.
Methods: PubMed and Embase were searched for English-language articles on the association between clinical signs and symptoms of DED up to February 2014 (no lower limit was set).
Results: Thirty-four articles were identified that assessed associations between signs and symptoms, among which 33 unique studies were reported. These included 175 individual sign–symptom association analyses. Statistical significance was reported for associations between sign and symptom measures in 21 of 33 (64%) studies, but for only 42 of 175 (24%) individual analyses. Of 175 individual analyses, 148 reported correlation coefficients, of which the majority (129/148; 87%) were between –0.4 and 0.4, indicating low-to-moderate correlation. Of all individual analyses that demonstrated a statistically significant association, one-half (56%) of reported correlation coefficients were in this range. No clear trends were observed in relation to the strength of associations relative to study size, statistical methods, or study region, although results from three studies did suggest that disease severity may be a factor.
Conclusion: Associations between DED signs and symptoms are low and inconsistent, which may have implications for monitoring the response to treatment, both in the clinic and in clinical trials. Further studies to increase understanding of the etiopathogenesis of DED and to identify the most reliable and relevant measures of disease are needed to enhance clinical assessment of DED and the measurement of response to therapeutic interventions.
Keywords: associations, correlations, dry eye disease, signs, symptoms, systematic literature review
Introduction
Dry eye disease (DED) is a complex, multifactorial condition characterized by inflammation of the ocular surface and lacrimal glands and reductions in the quality and/or quantity of tears.1 The prevalence of DED is high and ranges from 5% to 33% of the adult population worldwide.2 DED is considered to be a symptomatic disease,2 and many patients experience eye irritation, stinging, dryness, ocular fatigue, and fluctuating visual disturbances.3 These symptoms can lead to significant functional impairment in daily and social activities, quality of life, and productivity among affected patients.4 DED also poses a substantial economic burden to payers, patients, and society owing to associated health care costs and loss of productivity.5
The accurate diagnosis and classification of DED is complicated by the heterogeneous nature of the disease and wide variations in symptoms. A number of clinical tests assessing signs of DED are available that can broadly be divided into either those that evaluate tear production/quality or those that assess the integrity of the ocular surface. However, there is lack of a single test that can be used to accurately assess disease progression or response to treatment.3,6 The clinical picture of DED is further complicated by the observation that changes in and severity of clinical signs often do not correspond to patient-reported symptoms. This may impact both the diagnosis and management of DED in clinical practice and the design and interpretation of clinical trials with sign and symptom endpoints.
Our objective was to conduct a systematic literature review of the available evidence on associations between clinical signs and symptoms in DED in order to better understand the inconsistencies observed between these measures. To our knowledge, this is the first systematic review to address this issue, and therefore, it should provide new insights into the topic.
Methods
PubMed and Embase were searched for English-language articles published up to February 28, 2014 (no lower limit was set), reporting associations between signs and symptoms of DED, and the primary data supporting those findings were identified. The search terms used were (dry eye syndrome [Medical Subject Heading (MeSH)] or “dry eye disease”) AND ([test OR tests OR sign OR signs] AND [symptom OR symptoms]) AND (correlation OR association). The search was limited to humans and English language. The MeSH dry eye syndrome (PubMed) and dry eye (Embase) include keratoconjunctivitis sicca, Sjögren’s syndrome (SS), and xerophthalmia.
Following the Preferred Reporting Items for Systematic Reviews and Meta-Analyses (PRISMA) guidelines, titles and abstracts of all articles were reviewed, and articles for full-text review were further identified. Bibliographies of full-text publications and literature on file also were reviewed for additional evidence.
Results
Of the 288 titles/abstracts reviewed, 63 articles were selected for full-text review after excluding articles that did not assess the association of signs and symptoms. From reference lists of the 63 articles, an additional 14 relevant articles were identified. From the combined group of 77 articles, 43 were excluded as analysis of the full text indicated they did not assess association of signs and symptoms, yielding 34 articles for final inclusion (Figure 1).
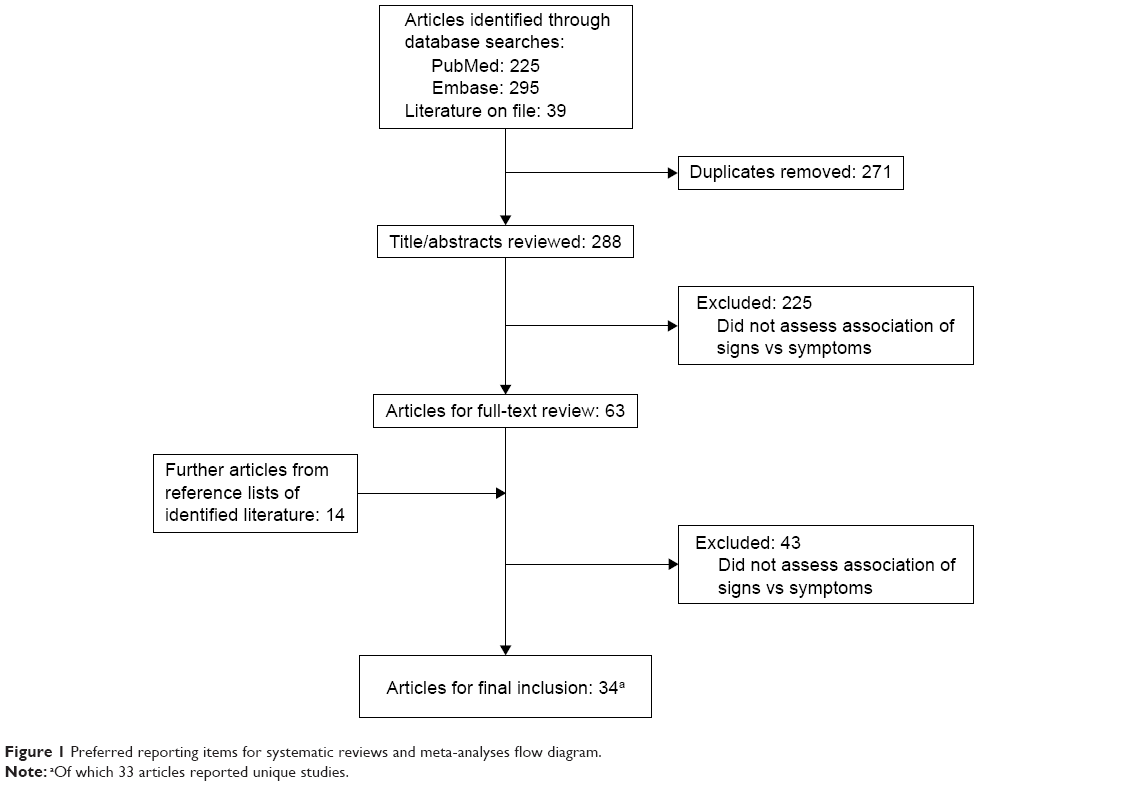 | Figure 1 Preferred reporting items for systematic reviews and meta-analyses flow diagram. |
Table 1 summarizes the literature identified as meeting the study criterion of reporting primary data on associations between signs and symptoms of DED. Articles were categorized according to the symptom measures used: 1) Ocular Surface Disease Index© (OSDI), 25-item National Eye Institute Visual Function Questionnaire (NEI VFQ-25), or visual analog scale (VAS); 2) frequency of symptom instruments; and 3) symptom severity or other symptom measures. For signs, we focused on clinical tests that are commonly used in clinical trials. These were tear breakup time (TBUT), Schirmer tear test, ocular surface dye staining, and tear osmolarity. Details on these sign and symptom measures are provided in Table 2. Other tests for which associations with symptoms were reported but are not described were tear meniscus height, phenol red thread test, lid margin telangiectasia, lid-parallel conjunctival folds, lid-wiper epitheliopathy, fluorescein clearance test, meibomian gland dysfunction assessment, closed chamber humidity difference, and infrared thermometry (each was reported in ≤5 articles).
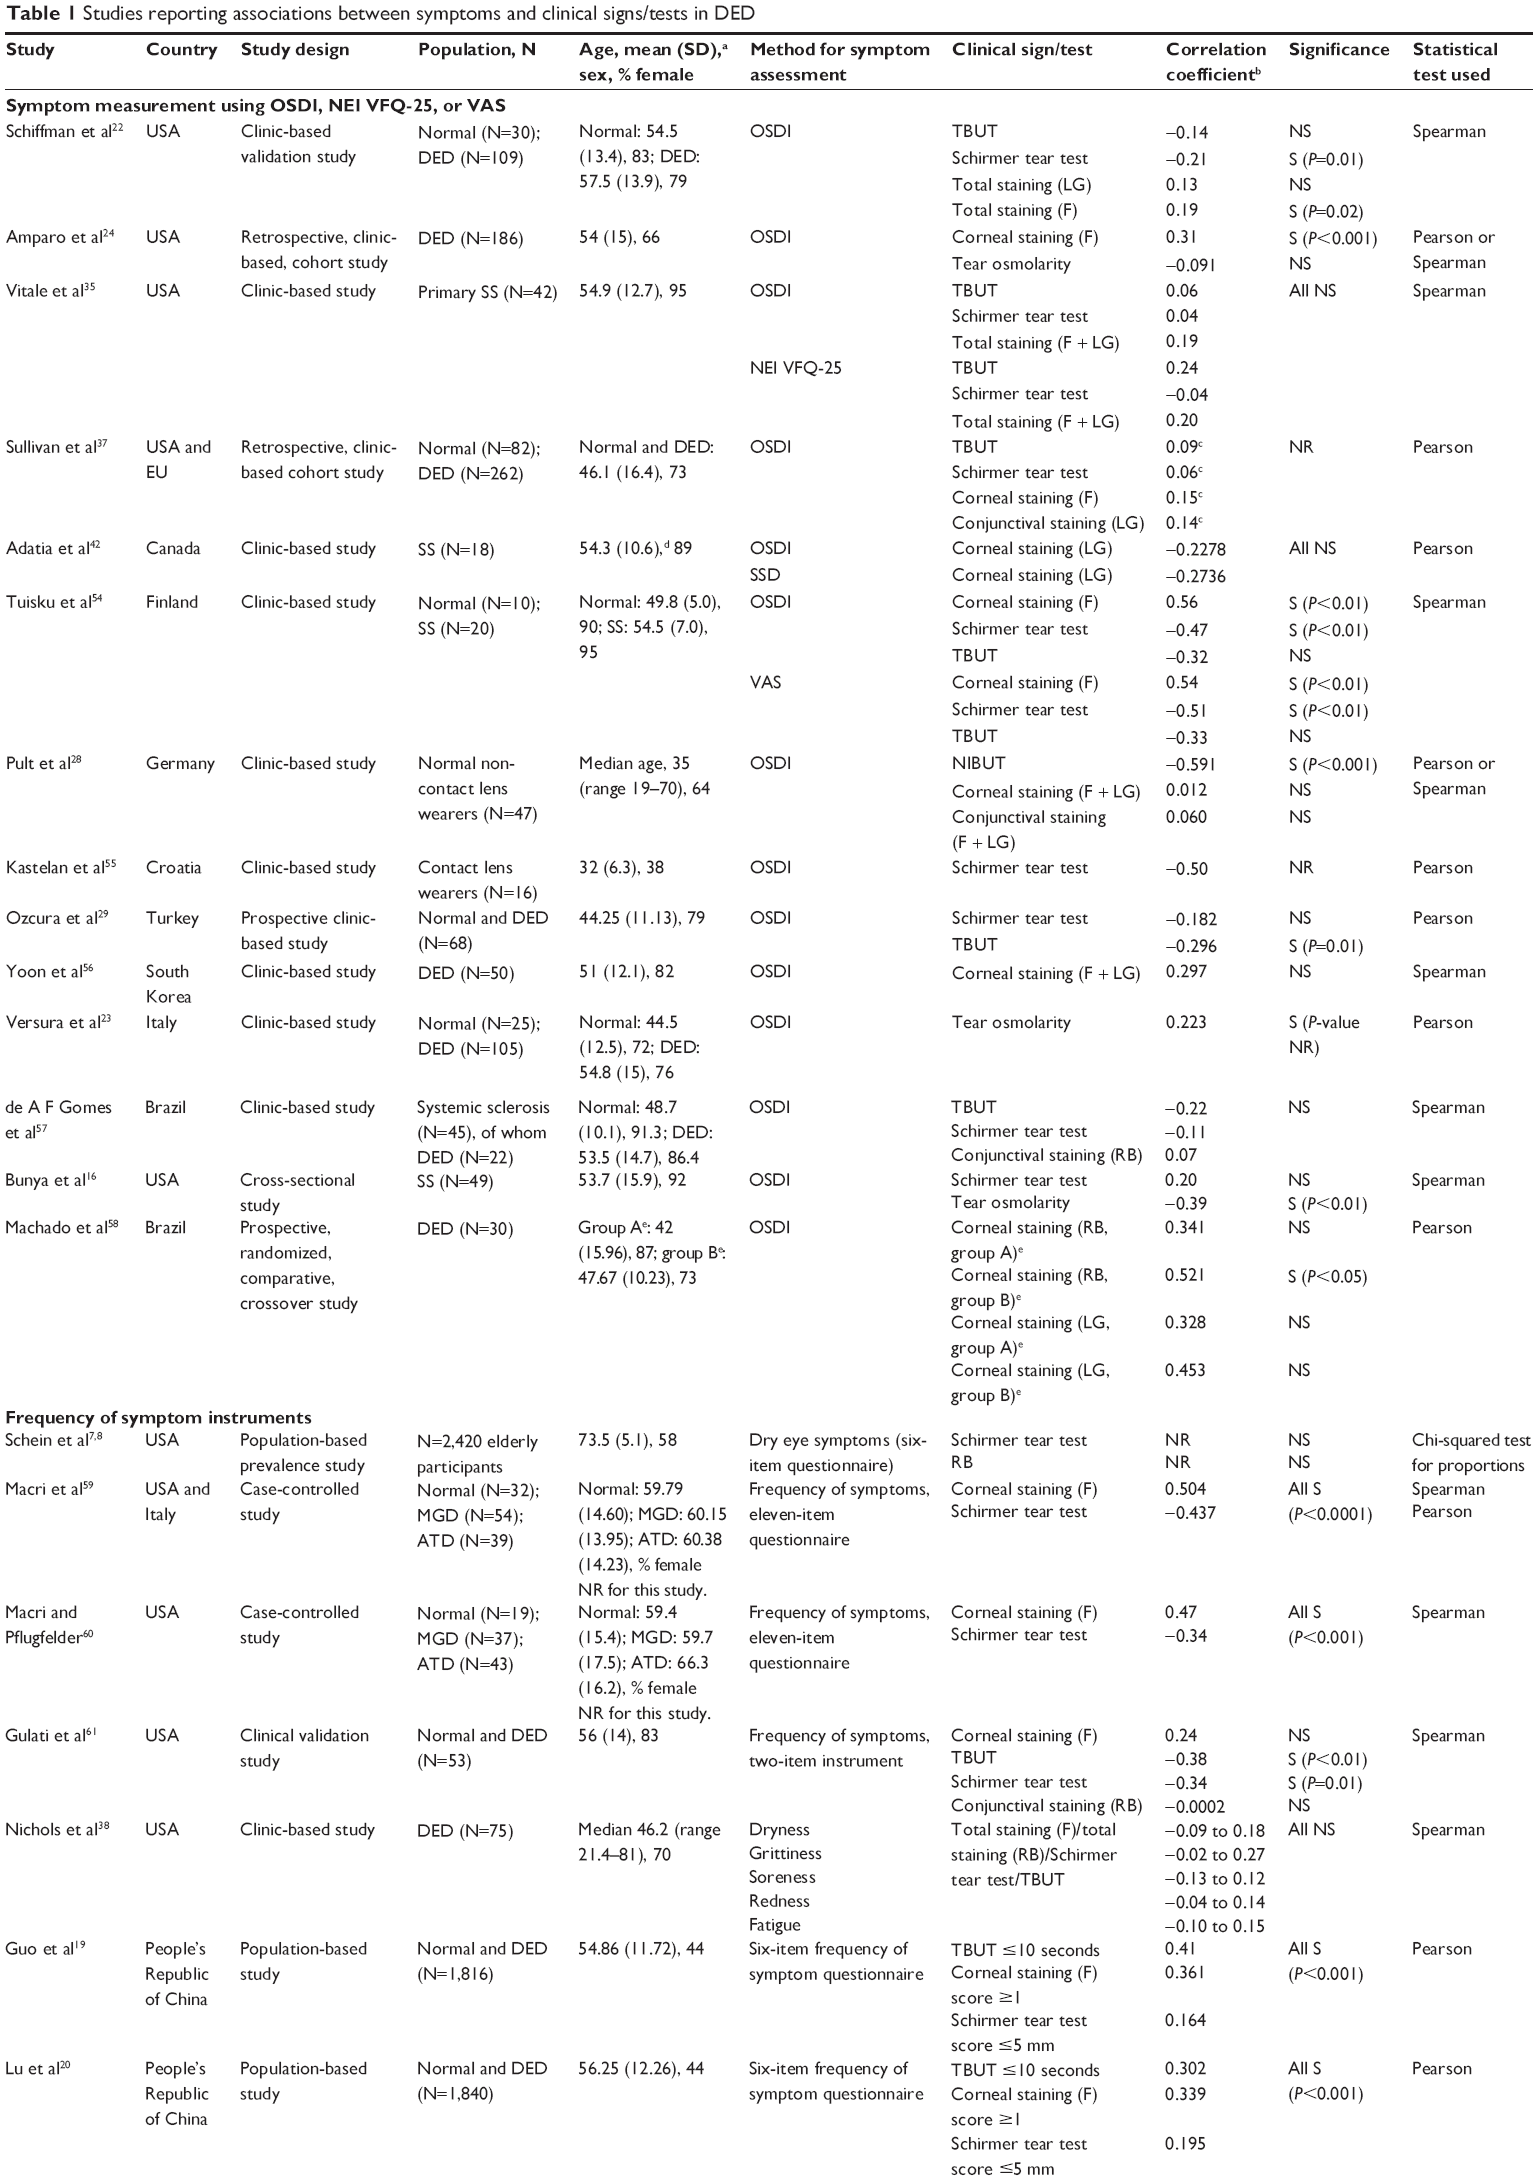  | Table 1 Studies reporting associations between symptoms and clinical signs/tests in DED |
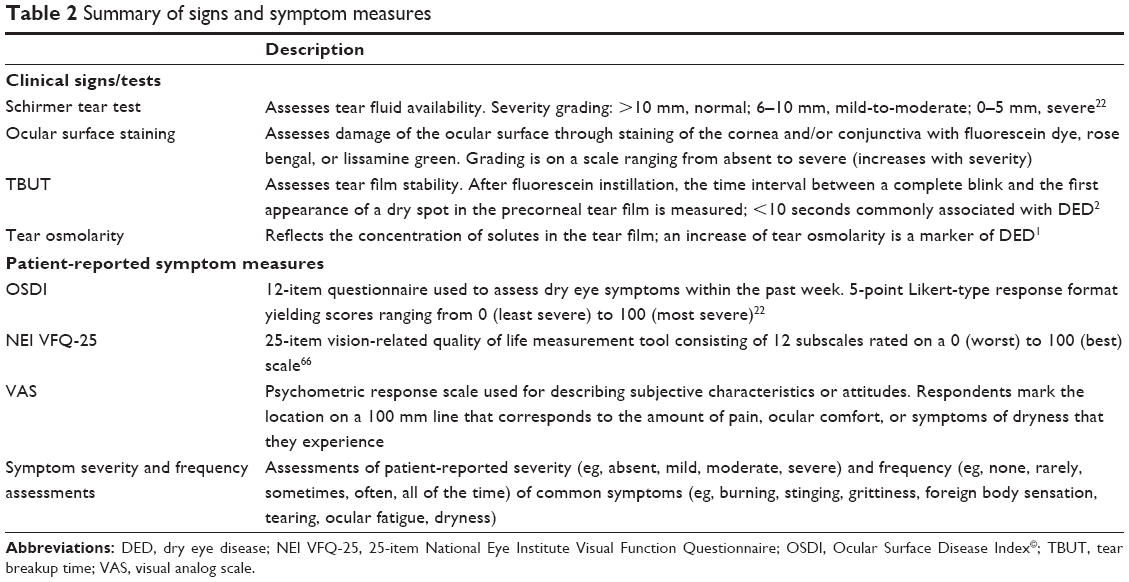 | Table 2 Summary of signs and symptom measures |
For the majority (29/34) of articles identified, the strength of association was measured by the Pearson or Spearman’s correlation coefficients; five articles used other statistical tests (eg, the chi-squared test).7–11 Among the 34 articles, 33 unique studies were reported (Schein et al7,8 reported data from the same study). Of these, 14 studies were conducted in USA/Canada, two in South America, eight in Europe, seven in Asia, and two jointly in USA/Europe. From the 33 unique studies, 175 individual sign–symptom association analyses were reported. Statistical significance was reported for associations between sign and symptom measures in 21 of 33 (64%) studies, but for only 42 of 175 (24%) individual analyses. Of the 175 individual analyses, 148 reported correlation coefficients; the majority of coefficients (129/148; 87%) were between −0.4 and 0.4, indicating low-to-moderate correlation.12–14 For the individual analyses that demonstrated a statistically significant correlation coefficient, one-half (56%) of reported coefficients were in this range. For 27 individual analyses, correlation coefficients were either not reported15 or other statistical tests were used.7–11
For the majority (79%) of individual analyses reporting correlation coefficients, the correlations were in the direction that would be expected for a correlation between increasing severity of signs and increasing severity of symptoms; increases in the severity of symptoms/OSDI score would be expected to be positively correlated with increases in ocular surface dye staining/tear osmolarity and negatively correlated with increases in TBUT/Schirmer tear test results. For most analyses, where correlation was in the opposite direction of that expected, statistical significance was not reached, and the coefficient value was close to zero. Only one significant correlation reported by Bunya et al16 went against the direction expected (negative correlation between OSDI and tear osmolarity).
In reviewing the 33 studies identified, we did not find any consistent trends in relation to the strength/significance of associations between specific measures of signs and symptoms. Table 1 shows associations of composite symptom scores with clinical signs in 30 studies. The remaining three studies15,17,18 reported associations for individual symptoms rather than composite symptom scores. Of these, Nichols and Smith found no significant correlation of individual symptoms with signs.18 Cardona et al reported significant correlations of scratchiness with staining and TBUT, but no other significant correlations.15 The third study by Mizuno et al reported a significant correlation of general vision with fluorescein staining but no other significant correlations.17
We also considered factors of the study design that may have influenced the statistical significance of results, including study size, statistical methods, and study region. With regard to study size, two of the largest population-based surveys (conducted in the People’s Republic of China, N>1,800) reported significant correlations between more frequent symptoms (≥1 symptom reported often or all the time) and lower Schirmer tear test scores (≤5 mm), lower TBUT (≤10 seconds), and higher fluorescein staining (≥1; P<0.001 for all).19,20 However, correlation estimates were modest (r ranging from 0.164 to 0.41), and statistical significance may have been reached owing to the large sample size, rather than clinical significance. Two other large population-based studies (N=2,420;7,8 N=1,45621) did not show a significant correlation between signs and symptoms, while in a large study conducted in Taiwan (N=459), only the Schirmer tear test showed a significant association with symptoms.10 We also considered whether the statistical test that was used to evaluate significance influenced the results, as the Spearman’s test is thought to be less prone to producing misleading findings.3 However, no trend was observed between the test used and the significance levels reported. In addition, the geographic setting did not appear to have an effect on correlation results; statistically significant correlations were reported for 29% and 31% of individual analyses from USA/Canada and the rest of the world, respectively.
Results from three studies provided data on the potential impact of patients’ DED severity on the significance of correlation. In an OSDI validation study, low nonsignificant correlations (ranging from −0.21 to 0.19) were observed between OSDI score and DED clinical tests (Schirmer tear test, TBUT, fluorescein staining, lissamine green staining) in a sample of 109 patients with DED and 30 controls.22 In contrast, statistically significant correlations ranging from −0.38 to 0.31 (P-value ranging from <0.001 to <0.05) were observed when the analysis included only patients with Schirmer tear test scores <10 mm. A second study of 105 patients with DED and 25 controls reported an increase in correlation strength between tear osmolarity and OSDI score as DED severity (based on a severity score system from the Dry Eye WorkShop [DEWS] report)1 increased from mild (r=0.313) to moderate (r=0.462).23 The third study included 186 patients receiving treatment for DED.24 Analyses assessing all patients found a low, albeit statistically significant (r=0.31; P<0.001) correlation between corneal fluorescein staining and symptoms, but no correlation between tear osmolarity and OSDI. The analysis was then repeated after patients were grouped according to previously reported cutoffs for the identification of patients with DED.25,26 These subgroups were 1) OSDI >12 (ie, with ocular surface disease), 2) a change of >4.5 OSDI units, and 3) tear osmolarity value >314 mOsm/L at baseline. Results of OSDI score >12 and tear osmolarity subsets were consistent with those of the broader population. However, the correlation between corneal fluorescein staining and OSDI was higher in the >4.5 OSDI subset compared with that in the total cohort (r=0.46 versus r=0.31, respectively; both P<0.001).
An important consideration for the statistical significance of association is the treatment that subjects may be receiving for DED, since treatment could potentially improve symptoms without an equal effect on signs, or might improve signs while having less effect on symptoms. The influence of patients’ treatment across the studies we reviewed is difficult to judge, as most studies did not provide this information. Of those that did, in the study by Nguyen et al that reported nonsignificant correlations between signs and symptoms, all patients were using artificial tears, and two thirds were using topical cyclosporine.27 In the study by Amparo et al a significant correlation between corneal fluorescein staining and OSDI was reported for the overall study population. The correlation remained significant for patients receiving topical cyclosporine, topical corticosteroids, topical anakinra, and oral tetracycline, but not for patients receiving topical autologous serum.24 In studies by Pult et al28 and Ozcura et al29 in which patients using topical ophthalmic treatment were excluded, OSDI was significantly correlated with TBUT, but not with staining or the Schirmer tear test. From these studies, it does not appear that patients’ treatment had a prominent effect on the significance of correlation.
Discussion
The results of this systematic review indicate that associations between clinical signs of DED and patient-reported symptoms are low and inconsistent. These results may be in part due to the low correlations that have been observed between different objective tests. For example, one study of 635 patients with DED reported very low intratest agreement between the Schirmer tear test, rose bengal, fluorescein staining, and TBUT tests.30 Objective tests assess various disease processes that may have no inherent correlation with each other, which may explain some of this lack of correlation, and individual tests also have been shown to have low repeatability. The Schirmer tear test, in particular, has been suggested to have low reproducibility, with wide variations occurring between subjects and on different days/visits, and the reliability of the test can be affected by environmental conditions, eg, temperature and humidity.6,31 In a prospective clinical study, tear osmolarity was shown to be the most reliable test across normal, mild/moderate, and severe DED (correlation [r2] of 0.55 with disease severity as measured on an objective composite index), while TBUT, corneal staining, conjunctival staining, and Schirmer tear test scores were more informative for the severe forms of disease.32
With regard to symptoms, significant variations have been reported in patients with DED at different times of the day and in different environments, which also may contribute to the low association between signs and symptoms. For example, the proportion of patients with non-SS DED with moderate-to-severe symptoms was found to increase from 32% in the morning to 60% in the evening.33 Despite this, the repeatability of symptom measures may be better than for objective tests. The reliability of the OSDI, in particular, has been shown to be high, with one study reporting an intraclass correlation coefficient between test and retest scores of 0.8222 (values >0.7 are usually considered indicative of adequate test–retest reliability).34
Correlations between different symptom measures may be greater than between different clinical tests. For example, significant correlations between symptoms measured by OSDI and NEI VFQ-25 scores have been observed,35 and high significant correlations between OSDI and the McMonnies questionnaire and the NEI VFQ-25 (r=0.67 and −0.77, respectively) have been reported in patients with and without DED.22 Data from a study by Begley et al36 demonstrated that clinicians’ global grading of severity correlated more highly with patient symptoms (r value ranging from 0.749 to 0.856; P≤0.01) than with clinical signs, suggesting that clinicians may take greater account of patient symptoms in a dry eye evaluation than results of clinical tests.
Another explanation for the low association between ocular signs and symptoms is that they can present independently of each other. Some symptomatic patients have only minimal ocular surface damage, while others demonstrate signs of DED in the absence of specific symptoms or with no symptoms at all. For example, in a study of 344 participants, only 57% of patients with evidence of DED by clinical signs reported an OSDI score >15 (considered indicative of DED).37 Similarly, in a clinic-based sample of 74 patients with an International Classification of Diseases, Ninth Revision code for DED, up to one-third of patients reported never having symptoms of eye fatigue, grittiness, redness, and/or soreness.38
The poor association between signs and symptoms could also be explained in part by the fact that symptom measures may assess particular properties of the disease (eg, grittiness or fatigue), which may not be related to measurable signs. A number of researchers also have suggested that sensory changes on the ocular surface may be an important factor. One theory is that in early/mild DED, corneal hyperalgesia may cause ocular discomfort before any clinical signs are evident.39,40 As corneal damage increases with disease progression, corneal sensation is expected to decrease, which could result in fewer patient-reported symptoms.39 In addition, reduced ocular sensitivity is expected to occur as a result of the normal aging process.41 This hypothesis is supported by the findings of a small study (N=18) that examined the correlation between corneal staining and corneal sensitivity and symptom severity.42 The authors demonstrated significant negative correlations between central corneal sensation and both fluorescein and lissamine green staining of the cornea, indicating that corneal sensation is reduced as ocular surface disease increases. In the same study, negative correlations were demonstrated between symptom severity and corneal staining, suggesting a reduction in symptoms paralleling the observed reduction in corneal sensitivity with increased disease. Bunya et al, who reported significant negative correlations between OSDI and tear osmolarity, also hypothesized that decreased corneal sensation with DED progression could explain their findings.16
The low association between signs and symptoms and the low repeatability of clinical tests have important implications for DED assessment and monitoring the response to treatment, both in the clinic and in clinical trials, in which it may be more difficult to demonstrate significant differences in treatment outcomes owing to the variability of the measurements. Given the discordance between measures, investigations to identify which tests, or combinations of tests, are most predictive of disease progression and long-term ocular surface damage may be valuable in order to inform assessments of DED and the interpretation of results. Efforts also are underway to identify biomarkers of DED progression that more reliably correlate with disease severity and provide a reliable metric of treatment response. Research to achieve a better understanding of the cellular changes that take place in DED also may provide a basis for reclassifying the disease and offer a rationale for subgroups in which signs and symptoms are better correlated.
New concepts are evolving that should further elucidate the pathogenic mechanisms of DED, which may lead to more precise diagnostic classifications, better correlations between signs and symptoms within each subclass, and the design of new therapeutic targets.43,44 Tear cytokines, chemokines, and soluble receptors show particular promise as biomarkers in DED.45–47 In one study, patients with DED were shown to have higher levels of inflammatory mediators in their tears compared with controls. In addition, tear cytokine/chemokine profiles differed between patients with DED with and without meibomian gland dysfunction,47 suggesting that patients with varying forms of DED may have distinctly different underlying pathogeneses, resulting in signs or symptoms that are uniquely expressed. In addition, evidence indicates that neuromediators are altered in the tear film of patients with DED, suggesting that they also could be used as biomarkers in DED. In a small study (N=19), various neuromediators were shown to be correlated with certain signs, but not others, in patients with SS, non-SS DED, and ocular cicatricial pemphigoid.48 For example, subgroup analyses showed that calcitonin gene-related peptide and neuropeptide Y, but not nerve growth factor, were changed in autoimmune (SS and ocular cicatricial pemphigoid) DED. These findings suggest that alterations in tear neuromediators could subclassify patients with DED, potentially improving correlations between signs and symptoms. Other biomarkers that have shown good correlation with DED are gene expression levels of ocular mucins in the conjunctival epithelium49,50 and lipid components in the tear fluid.51
The consistency between signs and symptoms also may be improved by newer tests that circumvent problems encountered with tear assays, such as variability owing to low sample volume or reflex tearing in some patients.52 As an alternative, a brush or membrane can be used to remove conjunctival cells from the conjunctival surface, and proteins assayed by immunostaining/flow cytometry or gene expression levels can be measured with polymerase chain reaction-based techniques.52
The majority of articles we identified used Pearson or Spearman’s correlation coefficients to report the association between signs and symptoms. Correlation coefficients provide an indication of the strength and direction of the linear relationship between two continuous variables; however, care is needed in their interpretation.12,53 One important issue is that statistical significance can be influenced by sample size. For example, two of the largest studies identified in this review (N>1,800)19,20 reported statistically significant correlations with values of r as low as 0.164 (up to 0.41), which may not be clinically meaningful. Another consideration is that since correlation coefficients are only valid for linear associations, a low correlation coefficient value may not imply a lack of association between two variables if the relationship is nonlinear.12,53
In evaluating the studies identified in this review, we did not observe any consistent trends in relation to the strength or significance of associations between specific measures of signs and symptoms, or regarding the influence of methodological factors on association results. However, our assessment was limited by the wide variation in study designs, clinical practices, and assessments used across the studies, making comparisons difficult. Another inherent limitation of the dataset was the small sample size in many of the studies, which may have reduced the ability to detect associations. An additional limitation of the literature search itself was that it did not include the terms “ocular surface disease” or “dysfunctional tear syndrome,” raising the possibility that we may not have captured some references. It is worth noting that most of the studies we reviewed were cross-sectional in design. The use of longitudinal studies in future research would allow for a more definitive understanding of the relationship between signs and symptoms, as an assessment can be made of the degree to which signs and symptoms increase or decrease synchronously over time.
Conclusion
The available evidence suggests that associations between commonly used assessments of signs and symptoms of DED are low and inconsistent. Further studies to increase understanding of the etiopathogenesis of DED and to identify the most reliable and relevant measures of disease are needed to enhance clinical assessment of DED and the measurement of response to therapeutic interventions.
Acknowledgments
This study was funded by Shire. The authors thank Nasser Malik, PhD, of Excel Scientific Solutions, who provided medical writing support funded by Shire.
Disclosure
MSK was an employee of Shire at the time this research was conducted and owns stock in Shire. SJS is an employee of Pharmerit International, who was a paid consultant to Shire in relation to this study. LS was an employee of Pharmerit International at the time this research was conducted and was a paid consultant to Shire in relation to this study. JDB has no financial interest in Shire and has received honoraria and research support from Alcon, Allergan, Bausch and Lomb, and Pfizer. The authors report no other conflicts of interest in this work.
References
DEWS. The definition and classification of dry eye disease: report of the Definition and Classification Subcommittee of the International Dry Eye WorkShop (2007). Ocul Surf. 2007;5(2):75–92. | ||
DEWS. The epidemiology of dry eye disease: report of the Epidemiology Subcommittee of the International Dry Eye WorkShop (2007). Ocul Surf. 2007;5(2):93–107. | ||
Johnson ME. The association between symptoms of discomfort and signs in dry eye. Ocul Surf. 2009;7(4):199–211. | ||
Miljanovic B, Dana R, Sullivan DA, Schaumberg DA. Impact of dry eye syndrome on vision-related quality of life. Am J Ophthalmol. 2007;143(3):409–415. | ||
Yu J, Asche CV, Fairchild CJ. The economic burden of dry eye disease in the United States: a decision tree analysis. Cornea. 2011;30(4):379–387. | ||
Savini G, Prabhawasat P, Kojima T, Grueterich M, Espana E, Goto E. The challenge of dry eye diagnosis. Clin Ophthalmol. 2008;2(1):31–55. | ||
Schein OD, Munoz B, Tielsch JM, Bandeen-Roche K, West S. Prevalence of dry eye among the elderly. Am J Ophthalmol. 1997;124(6):723–728. | ||
Schein OD, Tielsch JM, Munoz B, Bandeen-Roche K, West S. Relation between signs and symptoms of dry eye in the elderly. A population-based perspective. Ophthalmology. 1997;104(9):1395–1401. | ||
Hay EM, Thomas E, Pal B, Hajeer A, Chambers H, Silman AJ. Weak association between subjective symptoms or and objective testing for dry eyes and dry mouth: results from a population based study. Ann Rheum Dis. 1998;57(1):20–24. | ||
Lin PY, Cheng CY, Hsu WM, et al. Association between symptoms and signs of dry eye among an elderly Chinese population in Taiwan: the Shihpai Eye Study. Invest Ophthalmol Vis Sci. 2005;46(5):1593–1598. | ||
Singh Bhinder G, Singh Bhinder H. Reflex epiphora in patients with dry eye symptoms: role of variable time Schirmer-1 test. Eur J Ophthalmol. 2005;15(4):429–433. | ||
Taylor R. Interpretation of the correlation coefficient: a basic review. J Diagn Med Sonogr. 1990;6:35–39. | ||
Mukaka MM. Statistics corner: a guide to appropriate use of correlation coefficient in medical research. Malawi Med J. 2012;24(3):69–71. | ||
Swinscow TDV. Correlation and Regression. Statistics at Square One. 9th ed. London: BMJ Publishing Group; 1997. | ||
Cardona G, Marcellan C, Fornieles A, Vilaseca M, Quevedo L. Temporal stability in the perception of dry eye ocular discomfort symptoms. Optom Vis Sci. 2010;87(12):1023–1029. | ||
Bunya VY, Langelier N, Chen S, Pistilli M, Vivino FB, Massaro-Giordano G. Tear osmolarity in Sjogren syndrome. Cornea. 2013;32(7):922–927. | ||
Mizuno Y, Yamada M, Miyake Y. Association between clinical diagnostic tests and health-related quality of life surveys in patients with dry eye syndrome. Jpn J Ophthalmol. 2010;54(4):259–265. | ||
Nichols KK, Smith JA. Association of clinical diagnostic tests and dry eye surveys: the NEI-VFQ-25 and the OSDI. Adv Exp Med Biol. 2002;506(pt B):1177–1181. | ||
Guo B, Lu P, Chen X, Zhang W, Chen R. Prevalence of dry eye disease in Mongolians at high altitude in China: the Henan eye study. Ophthalmic Epidemiol. 2010;17(4):234–241. | ||
Lu P, Chen X, Liu X, et al. Dry eye syndrome in elderly Tibetans at high altitude: a population-based study in China. Cornea. 2008;27(5):545–551. | ||
Labbe A, Wang YX, Jie Y, Baudouin C, Jonas JB, Xu L. Dry eye disease, dry eye symptoms and depression: the Beijing Eye Study. Br J Ophthalmol. 2013;97(11):1399–1403. | ||
Schiffman RM, Christianson MD, Jacobsen G, Hirsch JD, Reis BL. Reliability and validity of the Ocular Surface Disease Index. Arch Ophthalmol. 2000;118(5):615–621. | ||
Versura P, Profazio V, Campos EC. Performance of tear osmolarity compared to previous diagnostic tests for dry eye diseases. Curr Eye Res. 2010;35(7):553–564. | ||
Amparo F, Jin Y, Hamrah P, Schaumberg DA, Dana R. What is the value of incorporating tear osmolarity measurement in assessing patient response to therapy in dry eye disease? Am J Ophthalmol. 2014;157(1):69–77. | ||
Lemp MA, Bron AJ, Baudouin C, et al. Tear osmolarity in the diagnosis and management of dry eye disease. Am J Ophthalmol. 2011;151(5):792–798. | ||
Miller KL, Walt JG, Mink DR, et al. Minimal clinically important difference for the ocular surface disease index. Arch Ophthalmol. 2010;128(1):94–101. | ||
Nguyen P, Huang D, Li Y, et al. Correlation between optical coherence tomography-derived assessments of lower tear meniscus parameters and clinical features of dry eye disease. Cornea. 2012;31(6):680–685. | ||
Pult H, Purslow C, Murphy PJ. The relationship between clinical signs and dry eye symptoms. Eye (Lond). 2011;25(4):502–510. | ||
Ozcura F, Aydin S, Helvaci MR. Ocular surface disease index for the diagnosis of dry eye syndrome. Ocul Immunol Inflamm. 2007;15(5):389–393. | ||
McCarty CA, Bansal AK, Livingston PM, Stanislavsky YL, Taylor HR. The epidemiology of dry eye in Melbourne, Australia. Ophthalmology. 1998;105(6):1114–1119. | ||
Lemp MA. Advances in understanding and managing dry eye disease. Am J Ophthalmol. 2008;146(3):350–356. | ||
Sullivan BD, Whitmer D, Nichols KK, et al. An objective approach to dry eye disease severity. Invest Ophthalmol Vis Sci. 2010;51(12):6125–6130. | ||
Begley CG, Caffery B, Chalmers RL, Mitchell GL. Use of the dry eye questionnaire to measure symptoms of ocular irritation in patients with aqueous tear deficient dry eye. Cornea. 2002;21(7):664–670. | ||
Gouveia Oliveria A. Biostatistics Decoded. 1st ed. West Sussex, UK: John Wiley & Sons, Ltd.; 2013. | ||
Vitale S, Goodman LA, Reed GF, Smith JA. Comparison of the NEI-VFQ and OSDI questionnaires in patients with Sjogren’s syndrome-related dry eye. Health Qual Life Outcomes. 2004;2:44. | ||
Begley CG, Chalmers RL, Abetz L, et al. The relationship between habitual patient-reported symptoms and clinical signs among patients with dry eye of varying severity. Invest Ophthalmol Vis Sci. 2003;44(11):4753–4761. | ||
Sullivan BD, Crews LA, Messmer EM, et al. Correlations between commonly used objective signs and symptoms for the diagnosis of dry eye disease: clinical implications. Acta Ophthalmol. 2014;92(2):161–166. | ||
Nichols KK, Nichols JJ, Mitchell GL. The lack of association between signs and symptoms in patients with dry eye disease. Cornea. 2004;23(8):762–770. | ||
Baudouin C, Aragona P, Van Setten G, et al; ODISSEY European Consensus Group members. Diagnosing the severity of dry eye: a clear and practical algorithm. Br J Ophthalmol. 2014;98(9):1168–1176. | ||
Rosenthal P, Borsook D. The corneal pain system. Part I: the missing piece of the dry eye puzzle. Ocul Surf. 2012;10(1):2–14. | ||
Roszkowska AM, Colosi P, Ferreri FM, Galasso S. Age-related modifications of corneal sensitivity. Ophthalmologica. 2004;218(5):350–355. | ||
Adatia FA, Michaeli-Cohen A, Naor J, Caffery B, Bookman A, Slomovic A. Correlation between corneal sensitivity, subjective dry eye symptoms and corneal staining in Sjogren’s syndrome. Can J Ophthalmol. 2004;39(7):767–771. | ||
Liu KC, Huynh K, Grubbs J Jr, Davis RM. Autoimmunity in the pathogenesis and treatment of keratoconjunctivitis sicca. Curr Allergy Asthma Rep. 2014;14(1):403. | ||
Mantelli F, Massaro-Giordano M, Macchi I, Lambiase A, Bonini S. The cellular mechanisms of dry eye: from pathogenesis to treatment. J Cell Physiol. 2013;228(12):2253–2256. | ||
Na KS, Mok JW, Kim JY, Rho CR, Joo CK. Correlations between tear cytokines, chemokines, and soluble receptors and clinical severity of dry eye disease. Invest Ophthalmol Vis Sci. 2012;53(9):5443–5450. | ||
Massingale ML, Li X, Vallabhajosyula M, Chen D, Wei Y, Asbell PA. Analysis of inflammatory cytokines in the tears of dry eye patients. Cornea. 2009;28(9):1023–1027. | ||
Lam H, Bleiden L, de Paiva CS, Farley W, Stern ME, Pflugfelder SC. Tear cytokine profiles in dysfunctional tear syndrome. Am J Ophthalmol. 2009;147(2):198.e–205.e. | ||
Lambiase A, Micera A, Sacchetti M, Cortes M, Mantelli F, Bonini S. Alterations of tear neuromediators in dry eye disease. Arch Ophthalmol. 2011;129(8):981–986. | ||
Corrales RM, Narayanan S, Fernández I, et al. Ocular mucin gene expression levels as biomarkers for the diagnosis of dry eye syndrome. Invest Ophthalmol Vis Sci. 2011;52(11):8363–8369. | ||
Zhang J, Yan X, Li H. Analysis of the correlations of mucins, inflammatory markers, and clinical tests in dry eye. Cornea. 2013;32(7):928–932. | ||
Lam SM, Tong L, Reux B, et al. Lipidomic analysis of human tear fluid reveals structure-specific lipid alterations in dry eye syndrome. J Lipid Res. 2014;55(2):299–306. | ||
Foulks GN, Pflugfelder SC. New testing options for diagnosing and grading dry eye disease. Am J Ophthalmol. 2014;157(6):1122–1129. | ||
Malgady RG, Krebs DB. Understanding correlation coefficients and regression. Phys Ther. 1986;66(1):110–120. | ||
Tuisku IS, Konttinen YT, Konttinen LM, Tervo TM. Alterations in corneal sensitivity and nerve morphology in patients with primary Sjogren’s syndrome. Exp Eye Res. 2008;86(6):879–885. | ||
Kastelan S, Lukenda A, Salopek-Rabatic J, Pavan J, Gotovac M. Dry eye symptoms and signs in long-term contact lens wearers. Coll Antropol. 2013;37(suppl 1):199–203. | ||
Yoon KC, Im SK, Kim HG, You IC. Usefulness of double vital staining with 1% fluorescein and 1% lissamine green in patients with dry eye syndrome. Cornea. 2011;30(9):972–976. | ||
de A F Gomes B, Santhiago MR, de Azevedo MN, Moraes HV Jr. Evaluation of dry eye signs and symptoms in patients with systemic sclerosis. Graefes Arch Clin Exp Ophthalmol. 2012;250(7):1051–1056. | ||
Machado LM, Castro RS, Fontes BM. Staining patterns in dry eye syndrome: rose bengal versus lissamine green. Cornea. 2009;28(7):732–734. | ||
Macri A, Rolando M, Pflugfelder S. A standardized visual scale for evaluation of tear fluorescein clearance. Ophthalmology. 2000;107(7):1338–1343. | ||
Macri A, Pflugfelder S. Correlation of the Schirmer 1 and fluorescein clearance tests with the severity of corneal epithelial and eyelid disease. Arch Ophthalmol. 2000;118(12):1632–1638. | ||
Gulati A, Sullivan R, Buring JE, Sullivan DA, Dana R, Schaumberg DA. Validation and repeatability of a short questionnaire for dry eye syndrome. Am J Ophthalmol. 2006;142(1):125–131. | ||
Afonso AA, Monroy D, Stern ME, Feuer WJ, Tseng SC, Pflugfelder SC. Correlation of tear fluorescein clearance and Schirmer test scores with ocular irritation symptoms. Ophthalmology. 1999;106(4):803–810. | ||
Yolton DP, Mende S, Harper A, Softing A. Association of dry eye signs and symptoms with tear lactoferrin concentration. J Am Optom Assoc. 1991;62(3):217–223. | ||
Nichols KK, Nichols JJ, Mitchell GL. The reliability and validity of McMonnies Dry Eye Index. Cornea. 2004;23(4):365–371. | ||
Cennamo GL, Del Prete A, Forte R, Cafiero G, Del Prete S, Marasco D. Impression cytology with scanning electron microscopy: a new method in the study of conjunctival microvilli. Eye (Lond). 2008;22(1):138–143. | ||
Mangione CM, Lee PP, Gutierrez PR, Spritzer K, Berry S, Hays RD. Development of the 25-item National Eye Institute Visual Function Questionnaire. Arch Ophthalmol. 2001;119(7):1050–1058. |
 © 2015 The Author(s). This work is published and licensed by Dove Medical Press Limited. The
full terms of this license are available at https://www.dovepress.com/terms
and incorporate the Creative Commons Attribution
- Non Commercial (unported, 3.0) License.
By accessing the work you hereby accept the Terms. Non-commercial uses of the work are permitted
without any further permission from Dove Medical Press Limited, provided the work is properly
attributed. For permission for commercial use of this work, please see paragraphs 4.2 and 5 of our Terms.
© 2015 The Author(s). This work is published and licensed by Dove Medical Press Limited. The
full terms of this license are available at https://www.dovepress.com/terms
and incorporate the Creative Commons Attribution
- Non Commercial (unported, 3.0) License.
By accessing the work you hereby accept the Terms. Non-commercial uses of the work are permitted
without any further permission from Dove Medical Press Limited, provided the work is properly
attributed. For permission for commercial use of this work, please see paragraphs 4.2 and 5 of our Terms.