Back to Journals » Clinical Ophthalmology » Volume 8
Association of electroretinogram and morphological findings in central retinal vein occlusion with macular edema
Authors Noma H, Mimura T, Kuse M, Shimada K
Received 15 September 2013
Accepted for publication 7 November 2013
Published 9 January 2014 Volume 2014:8 Pages 191—197
DOI https://doi.org/10.2147/OPTH.S54546
Checked for plagiarism Yes
Review by Single anonymous peer review
Peer reviewer comments 3
Hidetaka Noma1, Tatsuya Mimura2, Manami Kuse3,4, Katsunori Shimada5
1Department of Ophthalmology, Yachiyo Medical Center, Tokyo Women's Medical University, Chiba, Japan; 2Department of Ophthalmology, Medical Center East, Tokyo Women's Medical University, Tokyo, Japan; 3Department of Ophthalmology, National Hospital Organization, Mie Central Medical Center, Tsu, Japan; 4Department of Ophthalmology, Mie University Graduate School of Medicine, Tsu, Japan; 5Department of Biostatistics, STATZ Institute Inc., Tokyo, Japan
Abstract: The objective of this study was to evaluate the relations among electroretinogram (ERG) parameters (cone a-wave, cone b-wave, and 30 Hz flicker), retinal thickness, and retinal volume in 16 patients with central retinal vein occlusion and macular edema. The amplitude and implicit time of the ERG parameters were extracted from the ERG traces. Retinal thickness and volume were measured by optical coherence tomography in nine macular subfields. Then the correlations among ERG parameters and morphological parameters were analyzed. The cone b-wave and 30 Hz flicker implicit time were correlated with retinal thickness and volume in seven out of nine subfields, excluding the temporal subfields. In addition, the amplitude of the cone b-wave was correlated with retinal thickness and volume in the nasal inner and nasal outer subfields. These findings suggest that retinal thickness and volume may be associated with outer and inner retinal function in central retinal vein occlusion patients.
Keywords: central retinal vein occlusion, electroretinogram, macular edema, optical coherence tomography
Introduction
Central retinal vein occlusion (CRVO) often leads to macular edema, which is the most frequent cause of visual impairment in CRVO patients. Optical coherence tomography (OCT) is used to assess retinal thickness and morphology in CRVO patients with macular edema, but it has been reported that a decrease of macular thickness was not associated with a corresponding improvement of vision, indicating that there is a discrepancy between OCT findings and the visual prognosis.1,2 Accordingly, an objective and reproducible measure of retinal function is needed to allow accurate assessment of the efficacy of treatment. Investigation of the correlation between functional and anatomic parameters could help to determine which parameters are relevant in this context, indicating that it is important to investigate the relation between retinal function and morphologic changes in CRVO patients with macular edema.
The electroretinogram (ERG) is an objective measure of retinal function, but there is controversy regarding which ERG parameter is most useful for monitoring patients with retinal vein occlusion.3,4 In patients with CRVO, many studies have shown that the full-field ERG, particularly the b-wave implicit time of the 30 Hz flicker ERG, is a good predictor of the development of neovascular glaucoma.5,6 The cone a-wave, cone b-wave, and 30 Hz flicker of the ERG not only reflect macular function, but also retinal function.7 In animal models of branch retinal vein occlusion (BRVO), ERG studies have demonstrated moderate to severe functional deficits of the photoreceptor, bipolar, amacrine, and ganglion cells.8 However, the relation between ERG parameters and retinal morphology in CRVO patients with macular edema remains unclear, and limited information is available about the value of the ERG for assessing the macular area affected by CRVO.
In the present study, we measured ERG and anatomical parameters in CRVO patients with macular edema. Then we evaluated the relations among ERG parameters (cone a-wave, cone b-wave, and 30 Hz flicker) and the retinal thickness and retinal volume measured by OCT.
Materials and methods
Patients
Sixteen patients with a mean age of 69.9±11.9 years (eleven women and five men) and unilateral CRVO were included in this prospective, uncontrolled study that was conducted at the Department of Ophthalmology at Tokyo Women’s Medical University (Table 1). The mean duration of CRVO was 4.8±3.3 months (range: 1–12 months).
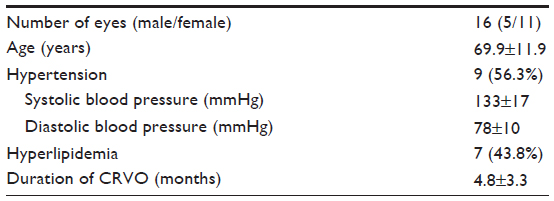 | Table 1 Clinical and demographic data of the CRVO patients |
Each patient underwent baseline screening that included slit-lamp examination and ophthalmoscopy, fluorescein angiography, ERG, and measurement of retinal thickness and retinal volume by OCT.
A masked grader independently assessed ischemic retinal vascular occlusion by examination of fluorescein angiograms. The ischemic region of the retina was measured using the public domain Scion Image program (Scion Corporation, Frederick, MD, USA).9 In brief, the optic disc was outlined with a cursor on digital photographs of the fundus and its area was measured, after which the same was done for the nonperfused area of the retina. Then the nonperfused area was divided by the disc area to calculate an index of the severity of retinal ischemia.
The unaffected contralateral eyes of the 16 CRVO patients were used as the controls. Hypertension was diagnosed if a patient had a systolic blood pressure ≥140 mmHg, a diastolic blood pressure ≥90 mmHg, or a systolic pressure ≥140 mmHg at one reading and a diastolic pressure ≥90 mmHg at a different reading, or was already taking antihypertensive medication. A diagnosis of hyperlipidemia was based on a serum total cholesterol level ≥240 mg/dL, triglycerides ≥160 mg/dL, or low-density lipoprotein cholesterol ≥130 mg/dL, or on current use of lipid-lowering medication.
The exclusion criteria were 1) intraocular surgery (including cataract extraction) within 6 months before enrollment, 2) diabetes mellitus/diabetic retinopathy, 3) previous laser photocoagulation of the macular region, 4) intravitreal injection of triamcinolone acetonide or antivascular endothelial growth factor (anti-VEGF) agents, 5) prior ocular inflammation, 6) retinal degeneration, 7) marked retinal hemorrhage (including macular bleeding into the intrafoveal or subfoveal spaces), and 8) retinal neovascularization or rubeosis.
Informed consent was obtained from each participant. This study was performed in accordance with the Helsinki Declaration of 1975 (1983 revision), and was approved by the ethics committee of Tokyo Women’s Medical University.
OCT
OCT was performed with a Zeiss Time Domain Stratus OCT3 apparatus (Carl Zeiss Meditec, Dublin, CA, USA), and it revealed that all patients had cystoid macular edema of ≥250 μm involving the central fovea. A retinal thickness map and retinal volume map were obtained by scanning the macula in 6 × 6 mm (20° × 20°) areas. The two retinal maps were each divided into the following nine subfields: 1) fovea, 2) superior inner macula, 3) nasal inner macula, 4) inferior inner macula, 5) temporal inner macula, 6) superior outer macula, 7) nasal outer macula, 8) inferior outer macula, and 9) temporal outer macula.10 The diameter of the center, inner, and outer rings was 1, 3, and 6 mm, respectively. In each of the nine regions, measurement of retinal thickness and retinal volume was automatically performed by computer analysis. Then the correlations between retinal thickness or retinal volume and ERG parameters were analyzed in each of the nine subfields.
ERG recording
After OCT had been completed, the photopic ERG was recorded in both eyes of each patient using a Portable LE2000 ERG system (Tomey Co, Ltd, Nagoya, Japan). The recording electrode was a contact lens electrode carrying light emitting diodes (EW-102; Mayo, Inazawa, Japan), which provided the white stimuli and background light and had the same effect as a Ganzfeld dome system. Before recording, the patient’s pupils were maximally dilated. After the contact lens recording electrodes were positioned, the patient underwent light adaptation for 10 minutes before recording of the ERG. The reference electrode was placed on the forehead and the ground electrode was placed on one earlobe. After waiting another 10 minutes, the photopic ERG was elicited by 3-ms white stimuli of 3.0 cd/m2 and the Light Adapted 3.0 Flicker ERG was elicited by 3.0 log cd/m2 stimuli. Both cone stimuli were presented on a white background of 30 cd/m2 according to the recommendations of the International Society of Clinical Electrophysiology of Vision.11 Data from both eyes were analyzed.
Statistical analysis
All analyses were performed with SAS System 9.1 software (SAS Institute Inc, Cary, NC, USA). Results are presented as the mean ± standard deviation or as frequencies. Student’s t-test was employed to compare normally distributed unpaired continuous variables between the groups. To examine the correlations between retinal thickness or retinal volume and ERG parameters, Pearson’s correlation coefficients were calculated. Correlations between ERG parameters and the nonperfused area of the retina were also determined by Pearson’s correlation coefficient analysis. In all analyses, two-tailed P-values of less than 0.05 were considered to indicate statistical significance.
Results
Best-corrected visual acuity ranged from 20/2,000 to 20/33.3 (median 20/100). The mean values of the cone a-wave, cone b-wave, and 30 Hz flicker are shown in Table 2. The amplitudes of the cone b-wave and 30 Hz flicker wave were significantly smaller in the eyes with CRVO and macular edema than in the unaffected contralateral eyes (P=0.003 and P=0.004, respectively) (Table 2). The implicit times of the cone a-wave, cone b-wave, and 30 Hz flicker were significantly longer in the eyes with CRVO and macular edema than in the unaffected contralateral eyes (P=0.011, P<0.001, and P<0.001, respectively) (Table 2). Table 3 shows the mean retinal thickness and retinal volume for each of the nine subfields. Figure 1 displays a representative fundus color photograph, along with measurement of retinal thickness by OCT and an ERG from the same patient.
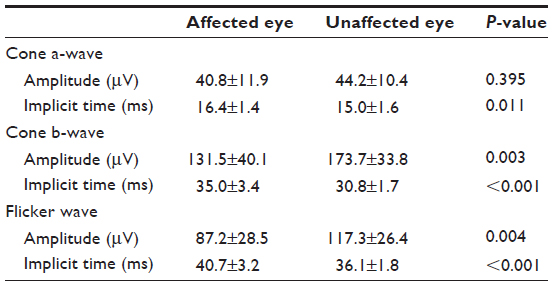 | Table 2 Comparison of ERG parameters between the affected eyes and unaffected contralateral eyes of the CRVO patients |
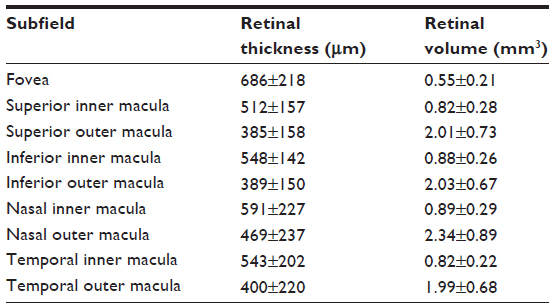 | Table 3 Anatomic measurements in the CRVO patients with macular edema |
 | Figure 1 Representative fundus color photograph, measurement of retinal thickness by OCT, and an ERG for the same eye. |
The association between ERG parameters and retinal morphologic parameters (retinal thickness and retinal volume) in each of the nine subfields is shown in Tables 4 and 5. The cone a-wave (amplitude and implicit time) and 30 Hz flicker (amplitude) were not correlated with the retinal thickness in any of the subfields. However, the amplitude of the cone b-wave was correlated with retinal thickness in the nasal inner and nasal outer subfields (Table 4). In addition, the cone b-wave and 30 Hz flicker implicit time were correlated with retinal thickness for seven out of nine subfields, excluding the temporal subfields (Table 4).
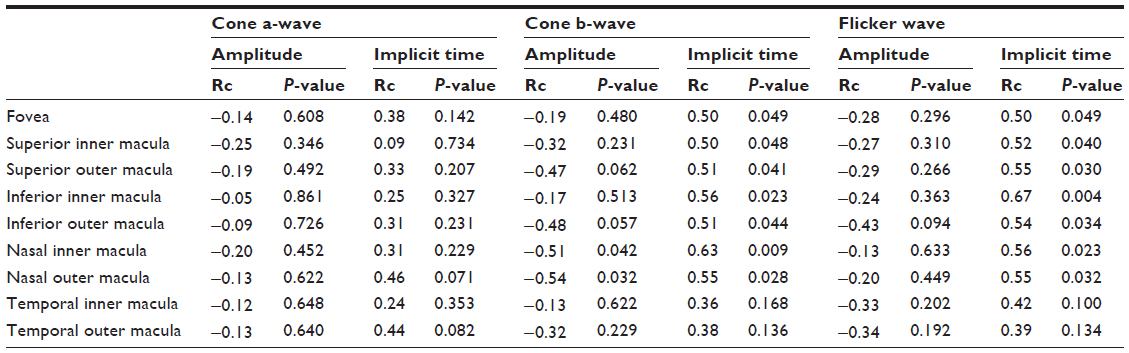 | Table 4 Association between ERG parameters and retinal thickness in the nine macular subfields |
 | Table 5 Association between ERG parameters and retinal volume in the nine macular subfields |
The cone a-wave (amplitude and implicit time) and 30 Hz flicker (amplitude) were not correlated with the retinal volume in any of the subfields, but the amplitude of the cone b-wave was correlated with retinal volume in the nasal inner and nasal outer subfields (Table 5). Also, the cone b-wave and 30 Hz flicker implicit time were correlated with retinal volume for seven out of nine subfields, excluding the temporal subfields (Table 5).
The implicit times of the cone b-wave (ρ=0.62, P=0.011) and 30 Hz flicker (ρ=0.54, P=0.031) were significantly correlated with the nonperfused area of the retina (Table 6). However, the amplitude of the cone a-wave (ρ=−0.28, P=0.287), cone b-wave (ρ=−0.41, P=0.115), and 30 Hz flicker (ρ=−0.25, P=0.350), as well as the implicit time of the cone a-wave (ρ=0.28, P=0.290), were not significantly correlated with the nonperfused area (Table 6).
 | Table 6 Correlations between ERG parameters and the nonperfused area of the retina |
Discussion
The present study demonstrated that the implicit times of the cone b-wave and 30 Hz flicker were correlated with both retinal thickness and volume in seven out of nine macular subfields, excluding the temporal subfields. These findings suggest that both macular thickness and macular volume were related to the implicit times of the cone b-wave and 30 Hz flicker in our CRVO patients. Both the cone b-wave7,12 and the 30 Hz flicker6,7,13,14 have been reported to reflect inner retinal function. Therefore, our findings indicate that data obtained from macular subfields (excluding the temporal subfields) may be associated with outer and inner retinal function in CRVO patients with macular edema. Thus, morphological changes of the non-temporal subfields may influence macular function, so that measuring ERG parameters (especially the cone b-wave and 30 Hz flicker implicit time) of these subfields might be useful for estimating macular function and the response to treatment such as anti-VEGF therapy.
We also found that the amplitude of the cone b-wave was correlated with both retinal thickness and retinal volume in only two subfields (the nasal inner and nasal outer subfields). Interestingly, these results were the opposite to those obtained in BRVO patients, in whom ERG parameters showed a stronger correlation with morphological parameters in the temporal subfield than in other subfields.10 It is possible that pathological changes induced by CRVO (such as bleeding) are more likely to affect the region extending from the optic nerve to the nasal part of the macula, since it contains the papillomacular bundle with a high axon density and an abundance of retinal ganglion cells, parasol cells, and dendrites that form part of the postreceptoral cone pathway.15 Therefore, the difference of macular thickness and volume between the nasal region of the macula and the temporal region would probably be greater in CRVO compared with BRVO, leading to a stronger correlation with ERG parameters (cone b-wave amplitude and the cone b-wave and 30 Hz flicker implicit times). However, further investigations will be needed to clarify the relations between ERG parameters and retinal morphology in CRVO patients.
The present study demonstrated that the implicit times of cone b-wave and 30 Hz flicker were significantly correlated with the nonperfused area of the retina. Because retinal photoreceptor cells are damaged by ischemia, functional impairment may become more severe as the ischemic region becomes larger. Ischemic retinal cells react slowly, as demonstrated by ERG recording in cats after photothrombosis.16 This has also been demonstrated by full-field ERG studies of patients with widespread retinal ischemia, since the implicit time of the 30 Hz flicker ERG reflected the ischemic status of the retina and predicted development of neovascular complications in CRVO patients.5,14,17,18 In addition, Hvarfner et al19 studied the multifocal ERG (mfERG) and reported that the implicit time was significantly longer in eyes with macular ischemia than in eyes without macular ischemia, and the mfERG amplitudes were lower in ischemic eyes with retinal vein occlusion. A correlation between prolongation of the implicit time and retinal ischemia was also suggested by Greenstein et al.20 They found that macular edema in diabetic retinopathy was related to a prolonged implicit time, but the retinal area with an altered implicit time was much larger than the area of edema, and they proposed ischemia as a possible explanation. We recently reported that increased intraocular levels of VEGF and soluble intercellular adhesion molecule 1, as well as a decrease of pigment epithelium-derived factor, were associated with increased retinal vascular permeability and with the severity of retinal ischemia in CRVO patients.21,22 Thus, as retinal ischemia becomes more severe, changes of these factors result in progression of macular edema that also worsens ischemia, with the result that macular function may be impaired. This hypothesis is supported by the report that the implicit times of the cone b-wave and 30 Hz flicker were significantly correlated with the VEGF concentration of the aqueous humor in patients with macular edema secondary to CRVO.23
The mfERG provides more localized data about retinal function than the full field ERG. Previous studies have demonstrated that mfERG abnormalities are generally well correlated with local changes in patients with retinal vein occlusion.24 Dolan et al25 found that retinal injury due to hemiretinal vein occlusion leads to significant prolongation of the implicit time on both ERG and mfERG, suggesting that these two modalities may have a role in the management of this type of retinal vein occlusion. In the present study, we evaluated the correlation of Ganzfeld ERG parameters with OCT parameters because we did not have access to mfERG. Moschos and Moschos26 used mfERG and OCT to show that intravitreal injection of bevacizumab can lead to anatomical and functional improvement of the macular region in CRVO patients with macular edema. Thus, the assessment of structural and functional changes by mfERG and OCT might be useful for monitoring the response to anti-VEGF therapy in CRVO patients with macular edema. However, further investigations will be needed to clarify how useful ERG parameters are for correlating morphology and retinal function in CRVO with macular edema.
In conclusion, the amplitude of the cone b-wave was correlated with both retinal thickness and retinal volume in the nasal inner and nasal outer macular subfields, while the cone b-wave and 30 Hz flicker implicit time were correlated with both retinal thickness and retinal volume for seven out of nine subfields, excluding the temporal subfields. Our findings suggest that ERG parameters may be associated with outer and inner retinal function in CRVO patients with macular edema. Changes in ERG parameters may be related to morphological changes that influence macular function, so that measuring ERG parameters (especially the cone b-wave and 30 Hz flicker implicit time) might be useful for estimating macular function and the response to treatment in CRVO.
Disclosure
The authors report no conflicts of interest in this work.
References
Martínez-Jardón CS, Meza-de Regil A, Dalma-Weiszhausz J, et al. Radial optic neurotomy for ischaemic central vein occlusion. Br J Ophthalmol. 2005;89(5):558–561. | |
Kumagai K, Furukawa M, Ogino N, Uemura A, Larson E. Long-term outcomes of vitrectomy with or without arteriovenous sheathotomy in branch retinal vein occlusion. Retina. 2007;27(1):49–54. | |
Hayreh SS, Klugman MR, Podhajsky P, Kolder HE. Electroretinography in central retinal vein occlusion. Correlation of electroretinographic changes with pupillary abnormalities. Graefes Arch Clin Exp Ophthalmol. 1989;227(6):549–561. | |
Williamson TH, Keating D, Bradnam M. Electroretinography of central retinal vein occlusion under scotopic and photopic conditions: what to measure? Acta Ophthalmol Scand. 1997;75(1):48–53. | |
Larsson J, Andreasson S, Bauer B. Cone b-wave implicit time as an early predictor of rubeosis in central retinal vein occlusion. Am J Ophthalmol. 1998;125(2):247–249. | |
Larsson J, Bauer B, Andréasson S. The 30-Hz flicker cone ERG for monitoring the early course of central retinal vein occlusion. Acta Ophthalmol Scand. 2000;78(2):187–190. | |
Mustafi D, Engel AH, Palczewski K. Structure of cone photoreceptors. Prog Retin Eye Res. 2009;28(4):289–302. | |
Zhang Y, Fortune B, Atchaneeyasakul LO, et al. Natural history and histology in a rat model of laser-induced photothrombotic retinal vein occlusion. Curr Eye Res. 2008;33(4):365–376. | |
Noma H, Funatsu H, Yamasaki M, et al. Pathogenesis of macular edema with branch retinal vein occlusion and intraocular levels of vascular endothelial growth factor and interleukin-6. Am J Ophthalmol. 2005; 140(2):256–261. | |
Noma H, Funatsu H, Harino S, Sugawara T, Mimura T, Shimada K. Association of electroretinogram and morphological findings in branch retinal vein occlusion with macular edema. Doc Ophthalmol. 2011; 123(2):83–91. | |
Marmor MF, Fulton AB, Holder GE, Miyake Y, Brigell M, Bach M; International Society for Clinical Electrophysiology of Vision. ISCEV Standard for full-field clinical electroretinography (2008 update). Doc Ophthalmol. 2009;118(1):69–77. | |
Sieving PA. Photopic ON- and OFF-pathway abnormalities in retinal dystrophies. Trans Am Ophthalmol Soc. 1993;91:701–773. | |
Bush RA, Sieving PA. Inner retinal contributions to the primate photopic fast flicker electroretinogram. J Opt Soc Am A Opt Image Sci Vis. 1996; 13(3):557–565. | |
Larsson J, Andréasson S. Photopic 30 Hz flicker ERG as a predictor for rubeosis in central retinal vein occlusion. Br J Ophthalmol. 2001;85(6):683–685. | |
Pavlidis M, Stupp T, Hummeke M, Thanos S. Morphometric examination of human and monkey retinal ganglion cells within the papillomacular area. Retina. 2006;26(4):445–453. | |
Ikeda H, Hankins MW, Asai T, Dawes EA. Electrophysiological properties of neurones following mild and acute retinal ischaemia. Exp Eye Res. 1992;55(3):435–442. | |
Breton ME, Quinn GE, Keene SS, Dahmen JC, Brucker AJ. Electroretinogram parameters at presentation as predictors of rubeosis in central retinal vein occlusion patients. Ophthalmology. 1989;96(9):1343–1352. | |
Severns ML, Johnson MA. Predicting outcome in central retinal vein occlusion using the flicker electroretinogram. Arch Ophthalmol. 1993;111(8):1123–1130. | |
Hvarfner C, Andréasson S, Larsson J. Multifocal electroretinography and fluorescein angiography in retinal vein occlusion. Retina. 2006; 26(3):292–296. | |
Greenstein VC, Holopigian K, Hood DC, Seiple W, Carr RE. The nature and extent of retinal dysfunction associated with diabetic macular edema. Invest Ophthalmol Vis Sci. 2000;41(11):3643–3654. | |
Noma H, Funatsu H, Mimura T, Eguchi S, Shimada K, Hori S. Vitreous levels of pigment epithelium-derived factor and vascular endothelial growth factor in macular edema with central retinal vein occlusion. Curr Eye Res. 2011;36(5):256–263. | |
Noma H, Funatsu H, Harino S, Mimura T, Eguchi S, Hori S. Vitreous inflammatory factors in macular edema with central retinal vein occlusion. Jpn J Ophthalmol. 2011;55(3):248–255. | |
Yasuda S, Kachi S, Kondo M, et al. Significant correlation between electroretinogram parameters and ocular vascular endothelial growth factor concentration in central retinal vein occlusion eyes. Invest Ophthalmol Vis Sci. 2011;52(8):5737–5742. | |
Hasegawa S, Ohshima A, Hayakawa Y, Takagi M, Abe H. Multifocal electroretinograms in patients with branch retinal artery occlusion. Invest Ophthalmol Vis Sci. 2001;42(1):298–304. | |
Dolan FM, Parks S, Keating D, Dutton GN. Wide field multifocal and standard full field electroretinographic features of hemi retinal vein occlusion. Doc Ophthalmol. 2006;112(1):43–52. | |
Moschos MM, Moschos M. Intraocular bevacizumab for macular edema due to CRVO. A multifocal-ERG and OCT study. Doc Ophthalmol. 2008;116(2):147–152. |
 © 2014 The Author(s). This work is published and licensed by Dove Medical Press Limited. The
full terms of this license are available at https://www.dovepress.com/terms
and incorporate the Creative Commons Attribution
- Non Commercial (unported, 3.0) License.
By accessing the work you hereby accept the Terms. Non-commercial uses of the work are permitted
without any further permission from Dove Medical Press Limited, provided the work is properly
attributed. For permission for commercial use of this work, please see paragraphs 4.2 and 5 of our Terms.
© 2014 The Author(s). This work is published and licensed by Dove Medical Press Limited. The
full terms of this license are available at https://www.dovepress.com/terms
and incorporate the Creative Commons Attribution
- Non Commercial (unported, 3.0) License.
By accessing the work you hereby accept the Terms. Non-commercial uses of the work are permitted
without any further permission from Dove Medical Press Limited, provided the work is properly
attributed. For permission for commercial use of this work, please see paragraphs 4.2 and 5 of our Terms.