Back to Journals » Therapeutics and Clinical Risk Management » Volume 14
Association of different glucose traits with kidney function decline risk in a Chinese community-based population without chronic kidney disease
Authors Wang X, Fan F ![]() , Jia J, Xu X, Qin X, Zheng B, Li H, Dong L, Wang S, Li J
, Jia J, Xu X, Qin X, Zheng B, Li H, Dong L, Wang S, Li J ![]() , Huo Y
, Huo Y ![]() , Dou J, Zhang Y
, Dou J, Zhang Y
Received 4 March 2018
Accepted for publication 21 June 2018
Published 17 September 2018 Volume 2018:14 Pages 1725—1734
DOI https://doi.org/10.2147/TCRM.S167233
Checked for plagiarism Yes
Review by Single anonymous peer review
Peer reviewer comments 2
Editor who approved publication: Professor De Yun Wang
Xingang Wang,1 Fangfang Fan,1 Jia Jia,1 Xin Xu,2 Xianhui Qin,2 Bo Zheng,1 Haixia Li,3 Liguang Dong,4 Shuyu Wang,5 Jianping Li,1 Yong Huo,1 Jingtao Dou,6 Yan Zhang1
1Department of Cardiology, Peking University First Hospital, Beijing, China; 2National Clinical Research Center for Kidney Disease, State Key Laboratory for Organ Failure Research, Renal Division, Nanfang Hospital, Southern Medical University, Guangzhou, China; 3Clinical Laboratory, Peking University First Hospital, Beijing, China; 4Peking University Shougang Hospital, Beijing, China; 5Beijing Hypertension League Institute, Beijing, China; 6Department of Endocrinology, Chinese PLA General Hospital, Beijing, China
Background: Chronic kidney disease (CKD) has become a major issue worldwide and hyperglycemia is known as an important risk factor responsible for CKD progression. Few studies have investigated whether fasting plasma glucose (FPG) could predict kidney function decline (KFD) risk better than postprandial plasma glucose, and vice versa. In this study, we investigated the roles of FPG and 2-hour plasma glucose (2 h-PG) in predicting KFD risk in a Chinese community-based population without baseline deterioration of kidney functions.
Methods: Subjects with normal kidney function from an atherosclerosis cohort in Beijing, China were followed up for 2.3 years. The outcome was KFD (a drop in glomerular filtration rate category accompanied by 25% or greater decline of estimated glomerular filtration rate from the baseline or a sustained decline of more than 5 mL/min/1.73 m2/year rate).
Results: A total of 3,738 subjects were included of which, 7.7% of the subjects suffered from KFD. After covariates adjustments, both FPG (OR =1.23, P<0.001) and 2 h-PG (OR =1.07, P<0.001) were associated with KFD. Furthermore, FPG was independent of 2 h-PG to predict KFD (OR =1.26, P<0.001). Subgroup analyses and interaction tests including diabetes mellitus, after adjusting all covariates, revealed no significant heterogeneity among analyzed subgroups. We also found subjects with FPG level of 6.1–7.0 mmol/L and >7.0 mmol/L had 1.83 times and 2.51 times KFD risk respectively, compared to subjects with FPG level <5.6 mmol/L.
Conclusion: FPG was superior to 2 h-PG in predicting KFD in a Chinese community-based population without CKD. FPG screening may be an important measure for CKD primary prevention even in subjects with impaired fasting glucose.
Keywords: fasting plasma glucose, postprandial plasma glucose, kidney function decline, chronic kidney disease
Introduction
Chronic kidney disease (CKD) has become a major public health issue worldwide. A cross-sectional survey1 of a nationally representative sample of Chinese adults in 2010 showed that the overall prevalence of CKD was 10.8% in China and the estimated CKD patients reached about 119.5 million. However, only 12.5% of them were aware of the condition. Thus, identifying and treating related risk factors for early stages of CKD should be an effective approach to prevent and delay its progression.2
Hyperglycemia has been known as a key risk factor responsible for CKD progression. Several reviews emphasized that diabetes mellitus (DM) was mainly responsible for CKD in many developed and developing countries3,4 and also in China.5 Fasting plasma glucose (FPG) is an important index of hyperglycemia and considered a major risk factor for microvascular complications including CKD in patients with newly diagnosed type 2 diabetes.6 Postprandial blood glucose, in recent years, has been identified as a possible independent risk factor for cardiovascular disease (CVD).7,8 Nevertheless, whether FPG and postprandial plasma glucose play different roles in predicting CKD risk still remains unclear. In addition, few studies have investigated whether FPG can predict the risk of CKD progression better than postprandial plasma glucose and vice versa.
In the present study, our objective is to elucidate the roles of FPG and 2-hour plasma glucose (2 h-PG) in predicting CKD progression defined as kidney function decline (KFD) in a Chinese community-based population without baseline deterioration of kidney function.
Research design and methods
Data collection
The subjects came from an atherosclerosis cohort in Gucheng and Pingguoyuan communities of Shijingshan district in Beijing, China.9 In brief, the baseline survey was conducted on 9,540 residents aged ≥40 years from December 2011 to April 2012, and 5,962 of them with gene chip data were invited for a follow-up visit from May 2014 to July 2014. A total of 3,823 subjects responded onsite. There was no significant baseline characteristic difference between subjects who responded and those who did not (data not shown). We further excluded participants whose estimated glomerular filtration rate (eGFR) was below 60 mL/min/1.73 m2 and participants without creatinine, fasting blood glucose (FBG), and 2 h-PG data. Finally, a total of 3,738 eligible participants were included in this analysis. The flowchart is provided in Figure S1, and the STROBE statement checklist in Table S1. This study was approved by the ethics committee of Peking University and Peking University First Hospital. Each participant provided a written informed consent. We adhered to the principles of the Declaration of Helsinki and the procedures were performed in accordance with institutional guidelines.
Participant questionnaires were obtained and examinations conducted by trained research staffs according to a standard operating procedure. Their seated blood pressure was obtained using an Omron HEM-7117 electronic sphygmomanometer, and the average of three consecutive measurements was used in the analysis.
Blood samples were taken after an overnight fasting of at least 12 hours for the measurement of FPG, total cholesterol, triglycerides, and creatinine concentrations. After that, participants without history of diabetes took glucose powder (75 g) for oral glucose tolerance test (OGTT) while the others took steamed bread (100 g) instead for the measurement of 2 h-PG. All laboratory variables at baseline were measured on the Roche C8000 Automatic Analyzer.
Serum creatinine (μmol/L) at baseline was measured using the enzymatic method. Serum creatinine during revisit was measured using Jaffe’s kinetic method on a Hitachi 7,180 Automatic Analyzer in the laboratory of Peking University First Hospital. Thus both, serum creatinine at baseline and revisit, were transformed into values measured by the enzymatic method.9 Then the value of eGFR was estimated using the equation derived from the CKD Epidemiology Collaboration.10
Outcomes
The primary outcome was KFD which was defined according to the Kidney Disease: Improving Global Outcome (KDIGO) 2012 definition2 is as follows: a drop in the glomerular filtration rate category (≥90 (G1), 60–89 (G2), 45–59 (G3a), 30–44 (G3b), 15–29 (G4), and <15 (G5) mL/min/1.73 m2) accompanied by 25% or greater drop in eGFR from baseline or a sustained decline in eGFR of more than 5 mL/min/1.73 m2/year.
Definitions
Current smoking was defined as smoking at least one cigarette per day for at least half a year. Current drinking was defined as drinking at least once per week for at least half a year. Body mass index (BMI) was calculated as weight (kilograms) divided by height (meters) squared. Hypertension was defined as any self-reported history of hypertension and/or systolic blood pressure ≥140 mmHg and/or a diastolic blood pressure (DBP) ≥90 mmHg. DM was defined as any self-reported history of diabetes, or FPG ≥7.0 mmol/L, or 2 h-PG in OGTT ≥11.1 mmol/L. CVD was defined as any self-reported history of coronary heart disease or stroke.
Statistical analysis
Data were expressed as mean ± SD for continuous variables and percentages (%) for dichotomous variables. Normally distributed continuous variables were compared using independent t-test. Abnormally distributed continuous variables were expressed as median and interquartile range (IQR), and compared using Kruskal–Wallis Test. The Pearson chi-squared test was applied to all categorical variables.
Logistic regression models were used to investigate the effects of different glucose traits on the occurrence of outcomes. Covariates including age, sex, BMI, baseline eGFR, current smoking, current drinking, total cholesterol, triglyceride, hypertension, CVD history, antihypertensive drugs, hypoglycemic drugs, and lipid-lowering drugs were selected based on previous studies showing a relation to kidney functions. To investigate the different roles of FPG and 2 h-PG in predicting KFD, they were put into the multiple regression models, first individually and then simultaneously. Furthermore, due to the strong correlation between FPG and 2 h-PG, we also compared the full regression model including both FPG and 2 h-PG with nested models with each of FPG and 2 h-PG.
Subgroup analysis examined the relationship between FPG and the risk of KFD according to age, sex, BMI, baseline eGFR, 2 h-PG, current smoking, current drinking, total cholesterol, triglyceride, hypertension, CVD, antihypertensive drugs, hypoglycemic drugs, and lipid-lowering drugs. Test for interaction in the logistic regression model was used to compare OR between the analyzed subgroups.
Moreover, the risk of microvascular complications associated with FPG indices was reported according to the glucose level.11 So participants were divided into four groups according to FPG: FPG <5.6 mmol/L; FPG 5.6–6.0 mmol/L; FPG 6.1–6.9 mmol/L; and FPG ≥7.0 mmol/L. Multiple logistic regression models, adjusted for major confounding factors, were used to investigate the effects of different glucose groups on the occurrence of outcomes.
A P-value of <0.05 (two-sided) was considered statistically significant for all tests. All analyses were performed using Empower(R) (www.empowerstats.com; X&Y Solutions, Inc., Boston, MA, USA) and R (http://www.R-project.org).
Results
A total of 3,738 subjects were included in the analysis. After a median 2.3-year (IQR: 2.28–2.39) follow-up, the incidence of KFD was 7.7% (289/3738). Baseline characteristics of all participants are shown according to the diabetes status (Table 1). The prevalence of DM at baseline was 23.9%. Subjects with DM significantly differed from those without DM in most variables except DBP, total cholesterol, and current smoking status.
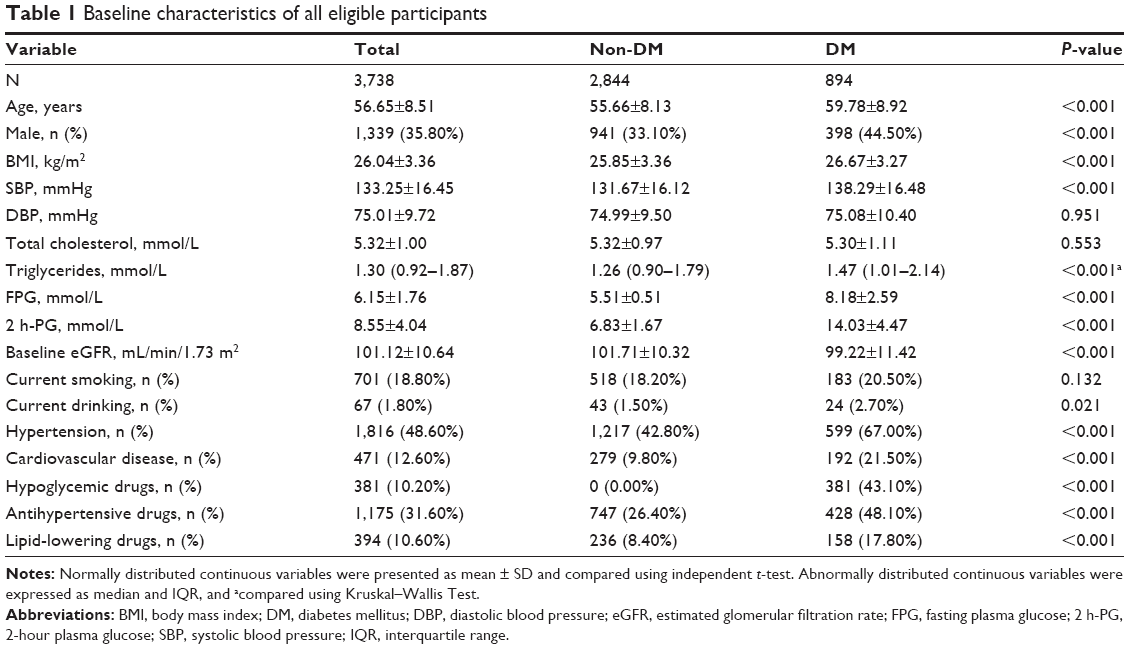 | Table 1 Baseline characteristics of all eligible participants |
Table 2 displays the impact of FPG and/or 2 h-PG on outcomes. In Model-1, we put either FPG or 2 h-PG in and adjust for other covariates. In Model-2, we further put FPG and 2 h-PG into the same model, and adjust by variables in Model-1 plus 2 h-PG for FPG and vice versa.
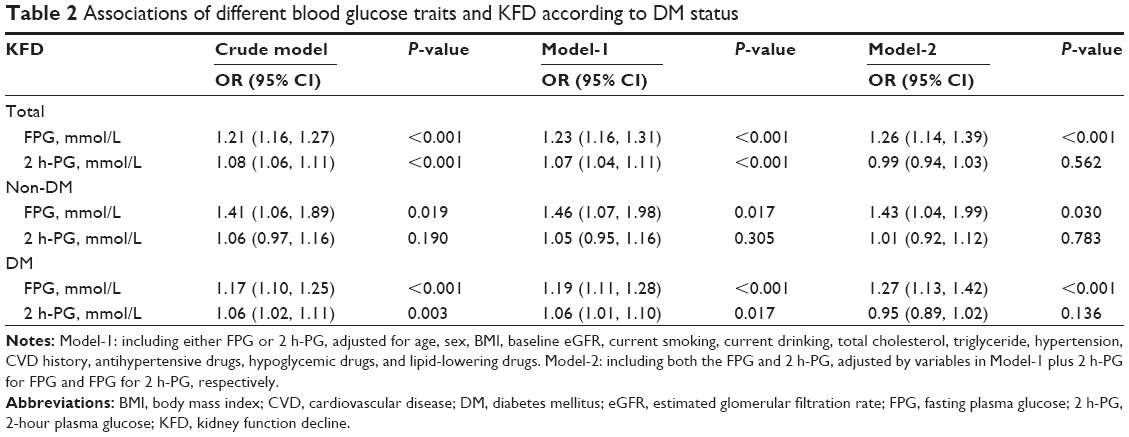 | Table 2 Associations of different blood glucose traits and KFD according to DM status |
The risk of KFD was associated with both FPG and 2 h-PG in the crude model. In multiple logistic-regression analyses, every 1 mmol/L increase of FPG was associated with 23% risk of KFD (OR =1.23, 95% CI: 1.16–1.31). However, 2 h-PG was only associated with 7% risk of KFD (OR =1.07, 95% CI: 1.04–1.11) on a scale of every 1 mmol/L increase. Furthermore, when putting FPG and 2 h-PG into one model simultaneously, only the association of FPG and KFD (OR =1.26, 95% CI: 1.14–1.39) remained statistically significant.
Also, we found that the full model with FPG and 2 h-PG was significantly better than the model with 2 h-PG only (P<0.001) but not better than the one with FPG only (P=0.547).
Similar findings were observed in DM and non-DM group and there were no interactions between each glucose trait and diabetes status (P for interaction =0.403 for FPG and P for interaction =0.335 for 2 h-PG).
The relationships between KFD and different FPG level groups are shown in Table 3. Higher FPG level was associated with increased risk of KFD. Using the lowest (<5.6 mmol/L) FPG group as the control group, increased risk of KFD reached statistical significance at 1.83 times (OR =1.83, 95% CI: 1.27–2.65) in FPG level of 6.1–7.0 mmol/L group and 2.51 times (OR =2.51, 95% CI: 1.53–4.12) in FPG level of >7.0 mmol/L group, respectively.
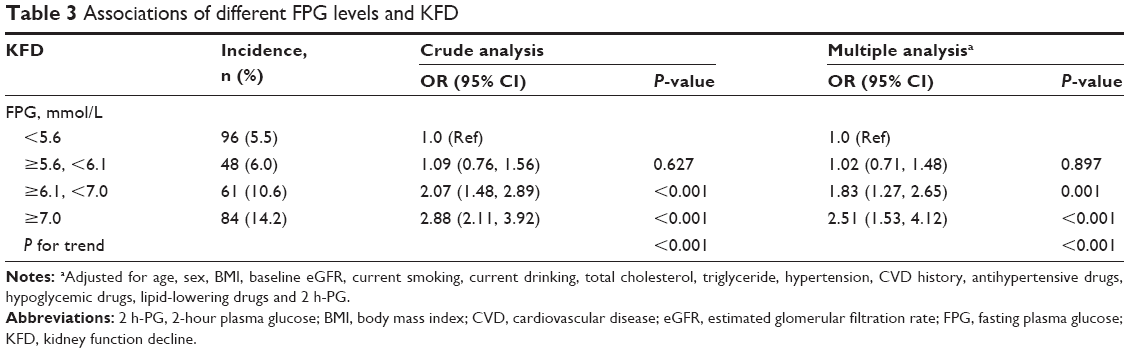 | Table 3 Associations of different FPG levels and KFD |
Subgroup analyses and interaction tests are presented in Figure 1. The trends for KFD were concordant in all subgroups stratified by each adjusted variable including sex (male or female), age (<60 or ≥60-year-old), BMI (<28 or ≥28 kg/m2), baseline eGFR (grouped by median value), 2 h-PG (<7.8 or ≥7.8 mmol/L), current smoking, current drinking, total cholesterol (<5.18 or ≥5.18 mmol/L), triglyceride (<1.70 or ≥1.70 mmol/L), hypertension, CVD, antihypertensive drugs, hypoglycemic drugs, and lipid-lowering drugs. Also, no significant interactions were observed between FBG and the modifying factors.
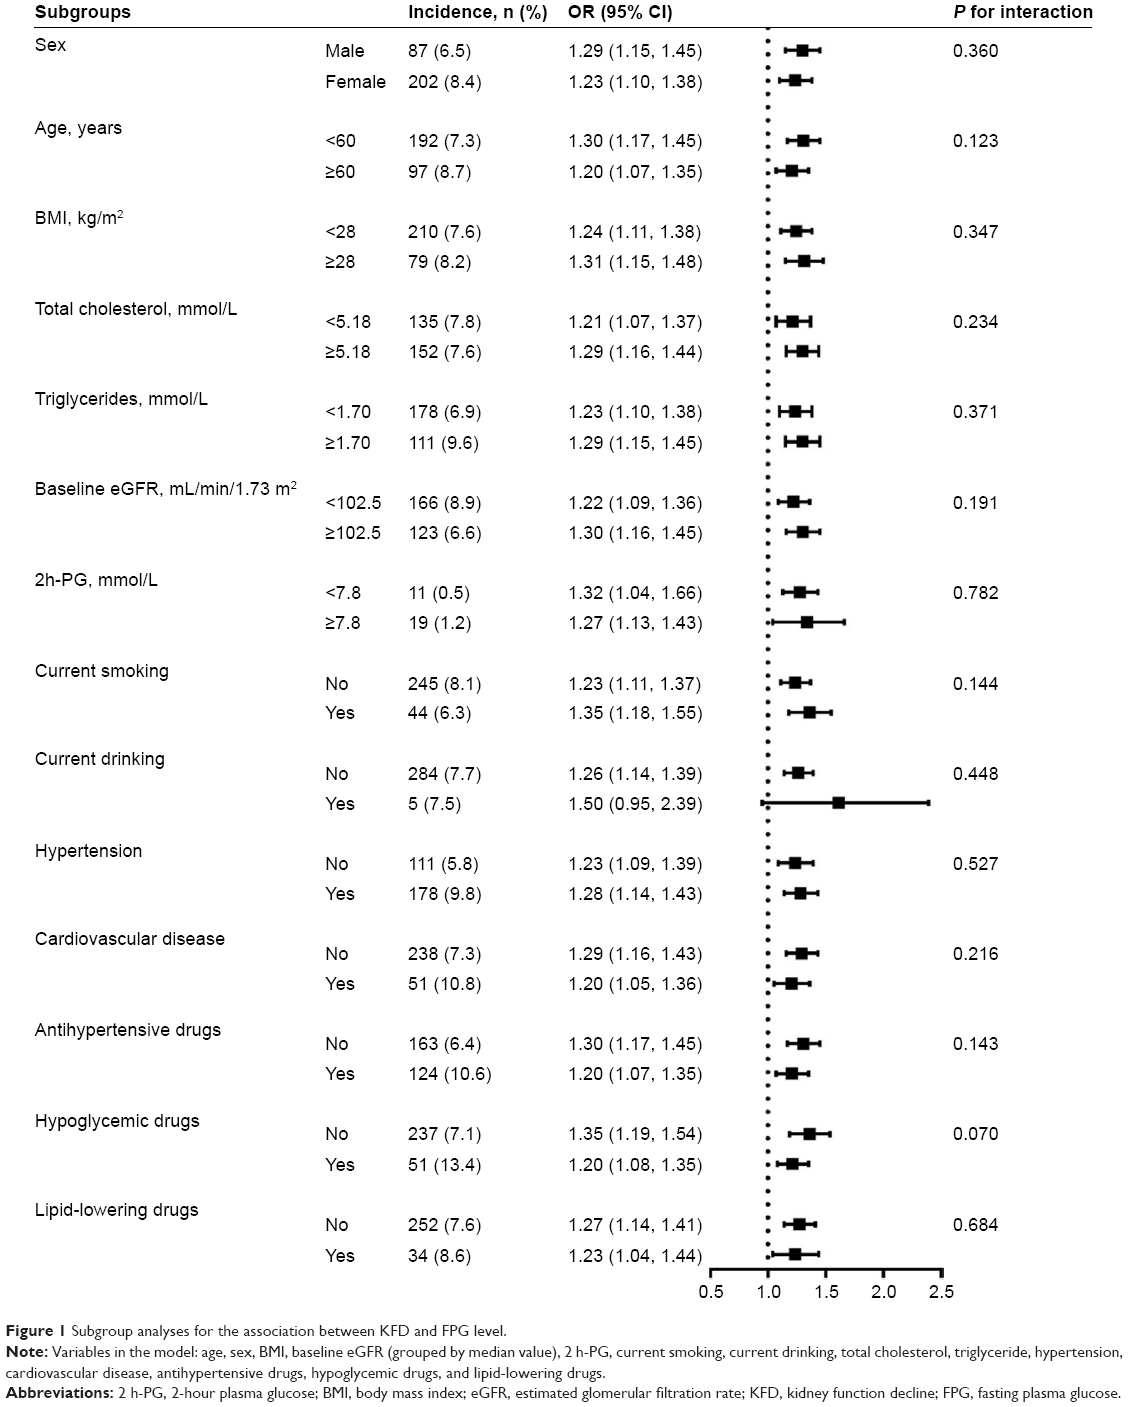 | Figure 1 Subgroup analyses for the association between KFD and FPG level. |
Discussion
The main findings of this cohort study are that FPG, independent of 2 h-PG, predicts the risk of KFD in a Chinese community-based population without CKD at baseline after 2.3-year follow-up. It is noteworthy that the risk of KFD has already significantly increased when baseline FPG ≥6.1 mmol/L.
CKD is becoming a global health burden for the general population, due to its epidemic size and constantly increasing prevalence and its potentially severe, life-threatening complications. Global deaths from kidney disease have risen by 83% since 1990.12 Hyperglycemia is known as a very important factor in the deterioration of kidney function. Zhang et al5 found CKD was more commonly related to diabetes than to glomerulonephritis in both the general population and a hospitalized urban population in China. Furthermore, both FPG and postprandial plasma glucose are commonly used parameters for evaluating glycemic status and were proven to be associated with CKD risk in previous studies.13
FPG was considered a risk factor for microvascular complications. The relationship between FPG and CKD, considered as one of the microvascular complications, had been reported in many cross-sectional designed studies.14–16 It was also suggested that increasing FPG level could be a major predictor for CKD progression. Iseki et al17 examined the relationship between FPG and end-stage renal disease (ESRD) in 78,529 screeners based on the results of community-based mass screening in Okinawa, Japan. During a 7.75-year follow-up period, a total of 133 subjects developed ESRD. The risk of ESRD development in the high-FPG group (defined as 126 mg/dL or more) was 3.098 times (95% CI, 1.738–5.525; P<0.0001). Consistently, our study showed that high FPG levels independently increased the risk of KFD, which is used to evaluate CKD progression, in this community-based Chinese population without CKD at baseline.
On the other hand, postprandial plasma glucose was generally considered as an important risk factor for macrovascular complications. Postprandial plasma glucose was proven to be associated with CVD events not only in cross-sectional studies8,18 but also in cohort studies.19 Meanwhile, postprandial plasma glucose was found to be related to CKD in an earlier study.20 In our study, we also found that 2 h-PG was associated with KFD, one indicator for CKD progression, without adjusting FBG, which supported the speculation that postprandial plasma glucose may also play an important role in CKD.
In summary, FPG and postprandial plasma glucose were both shown to be risk factors for CKD when considered separately. However, to the best of our knowledge, few studies have investigated whether FPG could predict the risk of CKD better than 2 h-PG and vice versa. In the study, we put FPG and 2 h-PG into one multiple regression model simultaneously, and found that only the association of FPG and KFD (OR =1.26, 95% CI: 1.14–1.39) remained statistically significant after adjusting 2 h-PG. Furthermore, due to the strong correlation between FPG and 2 h-PG, we also compared the full regression model including both FPG and 2 h-PG with nested models, with each of FPG and 2 h-PG, as repeated verification. For the first time, we reported that FPG was superior to 2 h-PG in predicting the risk of KFD.
However, the precise mechanisms for the different roles of these two glucose traits in the progression of renal pathological changes are still unclear. Despite many studies concentrating on the structural changes seen in the glomerulus, abnormalities are also found in the tubulointerstitium. One explanation may be that FPG and postprandial plasma glucose may have different effects on interstitial fibrosis. Ikee et al21 quantitatively evaluated pathological changes in the glomerulus, tubulointerstitium, and vessels in renal biopsy specimens from 23 patients with non-diabetic CKD. They demonstrated that FPG was significantly correlated with interstitial fibrosis (r=0.532, P=0.009). Meanwhile, no statistically significant correlation was found between 2 h PG and interstitial fibrosis (r=0.081, P=0.71). In fact, tubulointerstitial changes have been reported to be quite significantly correlated with renal dysfunction and prognosis.22,23 This finding may partially explain why FPG is better in predicting KFD risk in our study.
Furthermore, our data revealed that the risk of KFD has already significantly increased when FPG ≥6.1 mmol/L. Consistently, Nang et al11 have also found that the prevalence of CKD gradually increased in relation to higher FPG level, even beginning at level below the existing diagnostic threshold for DM of 7.0 mmol/L. This association persisted after adjustment for age, gender, ethnic group, and hypertension. They also pointed out that lowering the cutoff point for the diagnosis of diabetes from 7.0 to 6.0 mmol/L may increase the sensitivity for detecting kidney complications such as albuminuria and/or eGFR <60 mL/min/1.73 m2. In our study, the risk of KFD was also graded relative to FPG levels. Increasing KFD risk reached statistical significance from FPG level of 6.1 mmol/L, which supports the idea of lowering the FPG threshold from 7.0 to 6.1 mmol/L may be appropriate for CKD primary prevention.
Our study had several limitations. First, there was no data of proteinuria at baseline in this cohort. According to KDIGO guidelines, some of the patients may have CKD if they have albuminuria, in this case especially those with DM. However, albuminuria index including albumin-creatinine ratio and urine protein measurement was not examined at baseline, so we could not exclude the possible influence of albuminuria in our analysis. Nevertheless, we mainly focused on the change of kidney function evaluated by eGFR in this study. Also, no significant heterogeneity was found in subgroup analysis according to diabetes, and the main result did not significantly change in the analysis of patients without DM and those with DM but not on hypoglycemic treatment. Second, only two time-points were examined. The slope of eGFR based on more time-point data would enhance the accuracy of kidney end point. However, similar methods using two time-points of creatinine measurements to determine the kidney end point can be found in previous studies.24,25 Third, it may bring questions when we put FPG and 2 h-PG into one model, as FPG and 2 h-PG are closely correlated. Nonetheless, we used likelihood ratio test to analysis the effects of different models, which consistently indicated FPG was a better predictor of KFD.
Conclusion
Our study demonstrates that FPG is independent and superior to 2 h-PG in predicting the risk of KFD in a Chinese community-based population without CKD. FPG screening monitored conveniently and continuously, could be an important and convenient measurement for CKD primary prevention even in subjects with impaired fasting glucose.
Acknowledgments
The authors thank all the study team members for their participation. We especially thank the staff of Gucheng and Pingguoyuan Community Health Center for their support. This study was supported by a grant from the UM-PUHSC joint institute for translational and clinical research (grant no BMU20160530 and BMU20110177).
Disclosure
The authors report no conflicts of interest in this work.
References
Zhang L, Wang F, Wang L, et al. Prevalence of chronic kidney disease in China: a cross-sectional survey. Lancet. 2012;379(9818):815–822. | ||
National Kidney Foundation. K/DOQI clinical practice guidelines for chronic kidney disease: evaluation, classification, and stratification. Am J Kidney Dis. 2002;39(2 Suppl 1):S1–S266. | ||
Jha V, Garcia-Garcia G, Iseki K, et al. Chronic kidney disease: global dimension and perspectives. Lancet. 2013;382(9888):260–272. | ||
Pyram R, Kansara A, Banerji MA, Loney-Hutchinson L. Chronic kidney disease and diabetes. Maturitas. 2012;71(2):94–103. | ||
Zhang L, Long J, Jiang W, et al. Trends in chronic kidney disease in China. N Engl J Med. 2016;375(9):905–906. | ||
Nazimek-Siewniak B, Moczulski D, Grzeszczak W. Risk of macrovascular and microvascular complications in type 2 diabetes: results of longitudinal study design. J Diabetes Complications. 2002;16(4):271–276. | ||
Cavalot F, Petrelli A, Traversa M, et al. Postprandial blood glucose is a stronger predictor of cardiovascular events than fasting blood glucose in type 2 diabetes mellitus, particularly in women: lessons from the San Luigi Gonzaga Diabetes Study. J Clin Endocrinol Metab. 2006;91(3):813–819. | ||
Hanefeld M, Fischer S, Julius U, et al. Risk factors for myocardial infarction and death in newly detected NIDDM: the Diabetes Intervention Study, 11-year follow-up. Diabetologia. 1996;39(12):1577–1583. | ||
Fan F, Qi L, Jia J, et al. Noninvasive Central Systolic Blood Pressure Is More Strongly Related to Kidney Function Decline Than Peripheral Systolic Blood Pressure in a Chinese Community-Based Population. Hypertension. 2016;67(6):1166–1172. | ||
Levey AS, Stevens LA, Schmid CH, et al. A new equation to estimate glomerular filtration rate. Ann Intern Med. 2009;150(9):604–612. | ||
Nang EE, Khoo CM, Tai ES, et al. Is there a clear threshold for fasting plasma glucose that differentiates between those with and without neuropathy and chronic kidney disease? The Singapore Prospective Study Program. Am J Epidemiol. 2009;169(12):1454–1462. | ||
Lozano R, Naghavi M, Foreman K, et al. Global and regional mortality from 235 causes of death for 20 age groups in 1990 and 2010: a systematic analysis for the Global Burden of Disease Study 2010. Lancet. 2012;380(9859):2095–2128. | ||
Gabir MM, Hanson RL, Dabelea D, et al. Plasma glucose and prediction of microvascular disease and mortality: evaluation of 1997 American Diabetes Association and 1999 World Health Organization criteria for diagnosis of diabetes. Diabetes Care. 2000;23(8):1113–1118. | ||
Ohno M, Deguchi F, Izumi K, et al. Correlation between renal function and common risk factors for chronic kidney disease in a healthy middle-aged population: a prospective observational 2-year study. PLoS One. 2014;9(11):e113263. | ||
Jessani S, Bux R, Jafar TH. Prevalence, determinants, and management of chronic kidney disease in Karachi, Pakistan – a community based cross-sectional study. BMC Nephrol. 2014;15:90. | ||
Sun Y, Wang C, Yang W, et al. Fasting blood glucose, but not 2-h postload blood glucose or HbA1c, is associated with mild decline in estimated glomerular filtration rate in healthy Chinese. Int Urol Nephrol. 2015;47(1):147–152. | ||
Iseki K, Ikemiya Y, Kinjo K, Iseki C, Takishita S. Prevalence of high fasting plasma glucose and risk of developing end-stage renal disease in screened subjects in Okinawa, Japan. Clin Exp Nephrol. 2004;8(3):250–256. | ||
Yamasa T, Ikeda S, Koga S, et al. Evaluation of glucose tolerance, post-prandial hyperglycemia and hyperinsulinemia influencing the incidence of coronary heart disease. Intern Med. 2007;46(9):543–546. | ||
Cavalot F, Pagliarino A, Valle M, et al. Postprandial blood glucose predicts cardiovascular events and all-cause mortality in type 2 diabetes in a 14-year follow-up: lessons from the San Luigi Gonzaga Diabetes Study. Diabetes Care. 2011;34(10):2237–2243. | ||
Chandra S, Singh AK, Singh M, et al. Prolonged elevated postprandial sugar augments severity in kidney disease: a north Indian hospital-based study. Ren Fail. 2014;36(1):50–54. | ||
Ikee R, Hamasaki Y, Oka M, et al. Glucose metabolism, insulin resistance, and renal pathology in non-diabetic chronic kidney disease. Nephron Clin Pract. 2008;108(2):C163–C168. | ||
Nangaku M. Mechanisms of tubulointerstitial injury in the kidney: final common pathways to end-stage renal failure. Intern Med. 2004;43(1):9–17. | ||
Kang DH, Kanellis J, Hugo C, et al. Role of the microvascular endothelium in progressive renal disease. J Am Soc Nephrol. 2002;13(3):806–816. | ||
Madero M, Peralta C, Katz R, et al. Association of arterial rigidity with incident kidney disease and kidney function decline: the Health ABC study. Clin J Am Soc Nephrol. 2013;8(3):424–433. | ||
Li Y, Xie D, Qin X, et al. Metabolic syndrome, but not insulin resistance, is associated with an increased risk of renal function decline. Clin Nutr. 2015;34(2):269–275. |
Supplementary materials
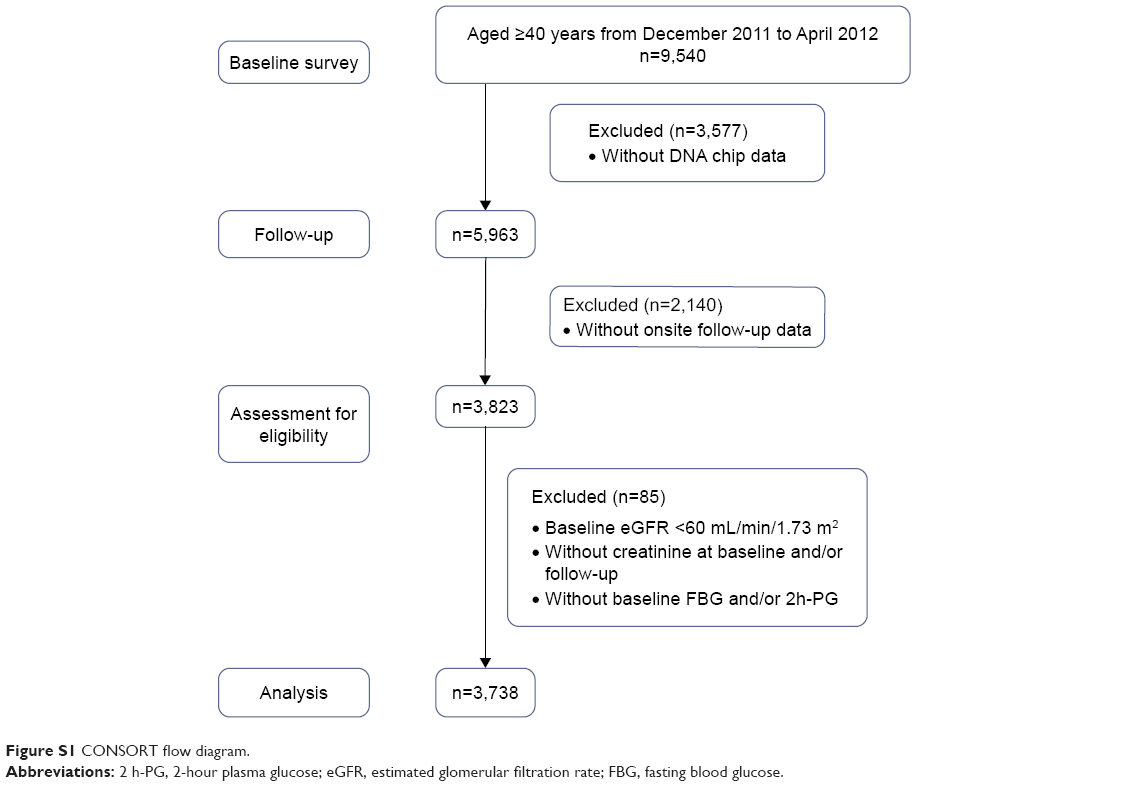 | Figure S1 CONSORT flow diagram. |
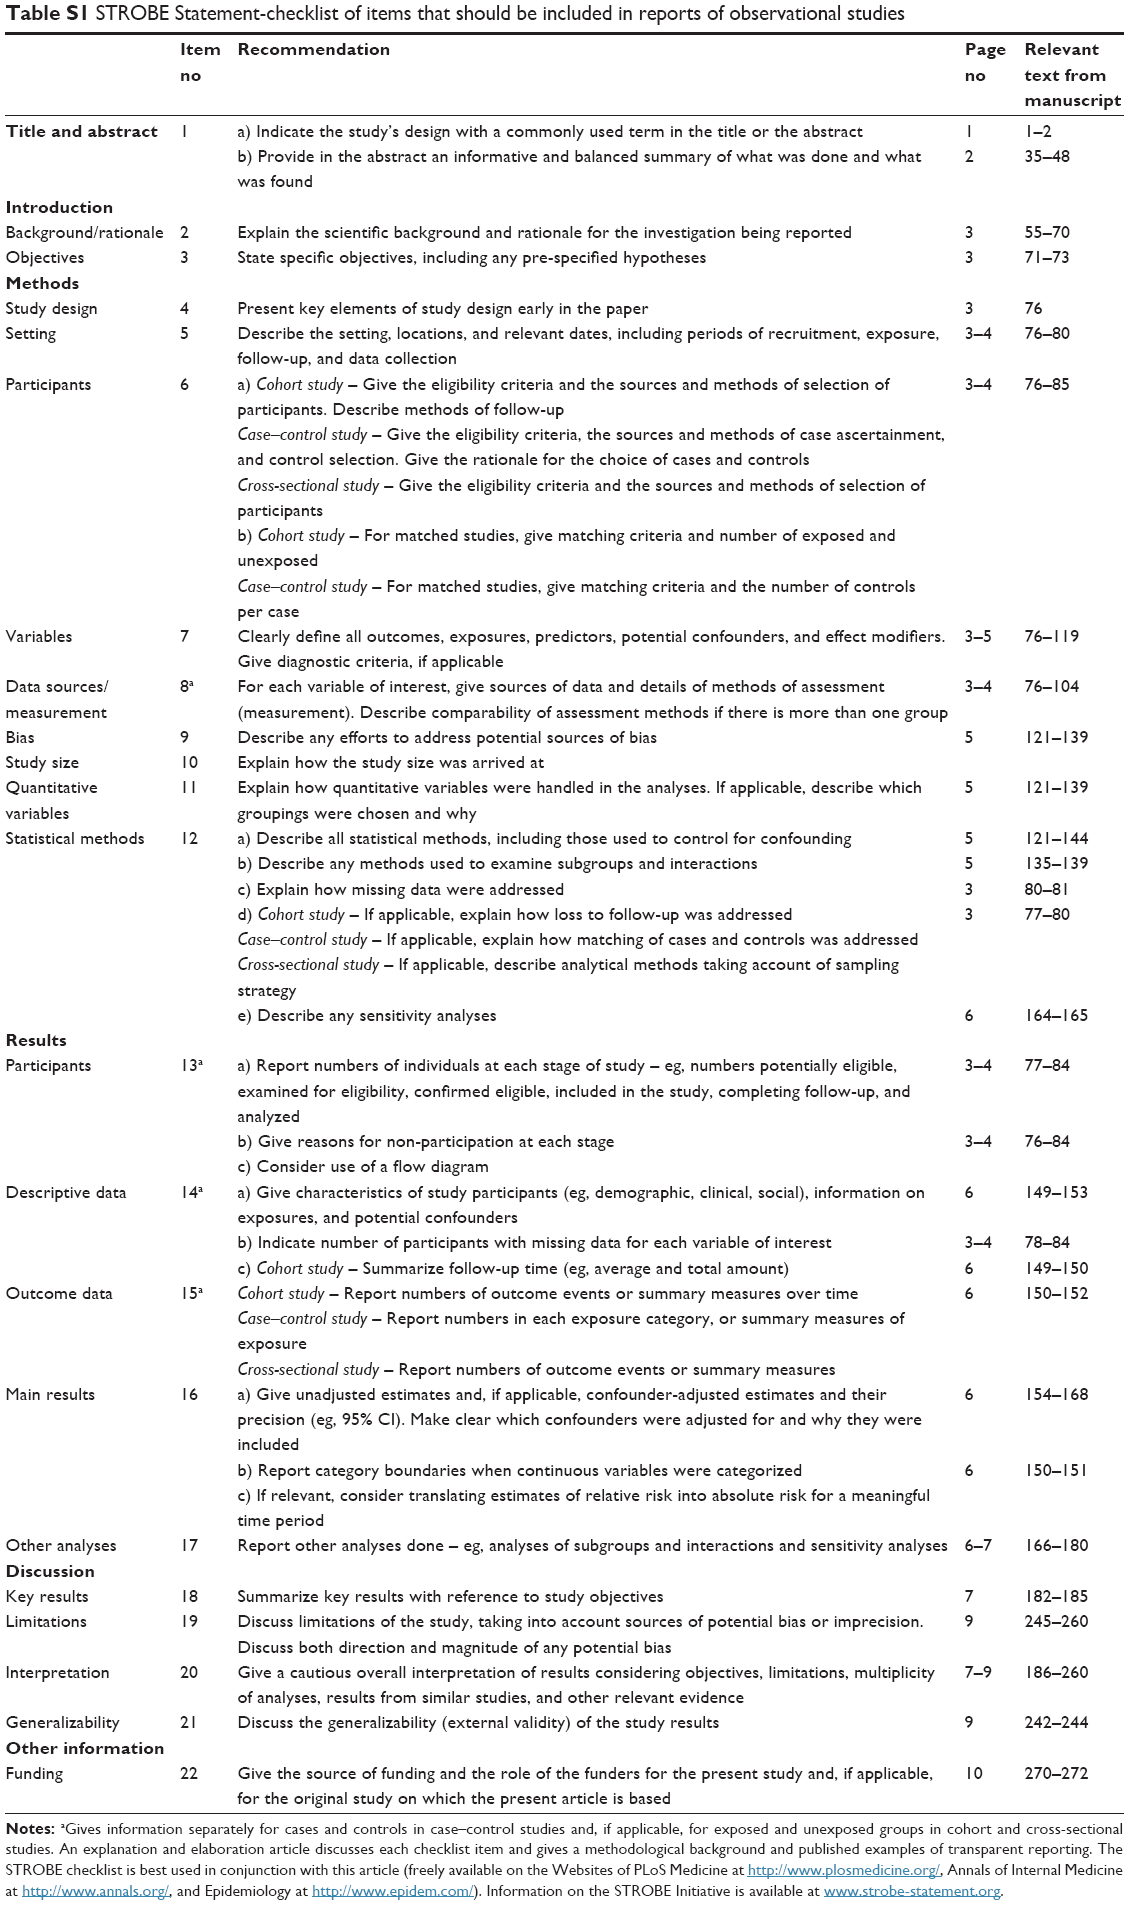 | Table S1 STROBE Statement-checklist of items that should be included in reports of observational studies |
 © 2018 The Author(s). This work is published and licensed by Dove Medical Press Limited. The
full terms of this license are available at https://www.dovepress.com/terms
and incorporate the Creative Commons Attribution
- Non Commercial (unported, 3.0) License.
By accessing the work you hereby accept the Terms. Non-commercial uses of the work are permitted
without any further permission from Dove Medical Press Limited, provided the work is properly
attributed. For permission for commercial use of this work, please see paragraphs 4.2 and 5 of our Terms.
© 2018 The Author(s). This work is published and licensed by Dove Medical Press Limited. The
full terms of this license are available at https://www.dovepress.com/terms
and incorporate the Creative Commons Attribution
- Non Commercial (unported, 3.0) License.
By accessing the work you hereby accept the Terms. Non-commercial uses of the work are permitted
without any further permission from Dove Medical Press Limited, provided the work is properly
attributed. For permission for commercial use of this work, please see paragraphs 4.2 and 5 of our Terms.