Back to Journals » Vascular Health and Risk Management » Volume 16
Association Metabolic Obesity Phenotypes with Cardiometabolic Index, Atherogenic Index of Plasma and Novel Anthropometric Indices: A Link of FTO-rs9939609 Polymorphism
Authors Abolnezhadian F, Hosseini SA, Alipour M, Zakerkish M, Cheraghian B, Ghandil P, Cheraghpour M ![]()
Received 29 February 2020
Accepted for publication 26 May 2020
Published 24 June 2020 Volume 2020:16 Pages 249—256
DOI https://doi.org/10.2147/VHRM.S251927
Checked for plagiarism Yes
Review by Single anonymous peer review
Peer reviewer comments 2
Editor who approved publication: Dr Takashi Kajiya
Farhad Abolnezhadian,1 Seyed Ahmad Hosseini,2,3 Meysam Alipour,3 Mehrnoosh Zakerkish,4 Bahman Cheraghian,5 Pegah Ghandil,6 Makan Cheraghpour3
1Division of Immunology and Allergy, Department of Pediatrics, School of Medicine, Ahvaz Jundishapur University of Medical Sciences, Ahvaz, Iran; 2Hyperlipidemia Research Center, Ahvaz Jundishapur University of Medical Sciences, Ahvaz, Iran; 3Nutrition and Metabolic Diseases Research Center, Ahvaz Jundishapur University of Medical Sciences, Ahvaz, Iran; 4Department of Endocrinology and Metabolism, Diabetes Research Center, Health Research Institute, Ahvaz Jundishapur University of Medical Sciences, Ahvaz, Iran; 5Department of Statistics and Epidemiology, Faculty of Public Health, Ahvaz Jundishapur University of Medical Sciences, Ahvaz, Iran; 6Department of Medical Genetics, Faculty of Medicine, Ahvaz Jundishapur University of Medical Sciences, Ahvaz, Iran
Correspondence: Seyed Ahmad Hosseini
Hyperlipidemia Research Center, Ahvaz Jundishapur University of Medical Sciences, Ahvaz, Iran
Email [email protected]
Background: The role of metabolic states in cardiovascular risks among individuals with varying degrees of obesity is unknown. The study aimed to compare cardiometabolic index (CMI), atherogenic index of plasma (AIP), lipid accumulation product (LAP) and novel anthropometric indices in metabolic and non-metabolically obese individual with regard to the role of FTO gene in Iranian adults.
Methods: In total, 165 individuals were recruited into this cross-sectional study. Individuals grouped into four groups: metabolic healthy normal-weight (MHNW) individuals, metabolically unhealthy normal-weight (MUNW) individuals, metabolically healthy obese (MHO) individuals and metabolic unhealthy obese (MUO) individuals. The dietary intake was evaluated by food frequency questionnaire (FFQ). The cardiovascular indices (CMI, AIP and LAP) were calculated. A variety of anthropometric indices were calculated, including body adiposity Index (BAI), weight-adjusted-waist index (WWI), A body shape index (ABSI) and waist-height ratio (WHR). The genotypes of FTO-rs9939609 subjects were detected by the polymerase chain reaction-restriction fragment length polymorphism (PCR-RFLP).
Results: The individuals with metabolically unhealthy phenotypes (MUO, MUNW) have higher levels of triglyceride and cardiovascular indices (AIP, LAP and CMI) than the individuals with metabolic healthy phenotypes (MHO, MHNW). With a similar degree of obesity, the anthropometric indices (BAI, WWI and WHR) levels were higher in metabolic unhealthy groups than metabolically healthy groups. The highest frequency of obesity-risk allele AA of FTO gene was observed in MUO, MHO, MUNW and MHNW, respectively.
Conclusion: Normal-weight individuals with metabolic unhealthy status are at higher risk for cardiovascular diseases than obese individuals with metabolically healthy status. The genotype frequencies of obesity-risk allele AA of FTO gene were higher in obesity phenotypes than metabolic phenotypes.
Keywords: cardiovascular, atherogenic index, obesity, FTO
Background
The rising trends in obesity, as a public health concern have increased in childhood and adolescent.1 Obesity can induce insulin resistance by increase circulation free fatty acids, which prevent glucose transport activity and reducing glucose uptake in the muscles.2 The studies reported the relationship between obesity with components of metabolic syndrome (abdominal obesity, low HDL-C, high triglycerides, hyperglycemia and hypertension).3,4 In obese individuals, the extra fat tissue causes low-grade chronic inflammation.5 The adipocytes produce adipocytokines such as TNFα and IL-6.6 During low-grade systemic inflammation, the insulin-dependent tissues are exposed to infiltration of inflammatory macrophages which effect on tissues performance in response to insulin.7
However, it seems that a subset of obese individuals referred as “metabolic healthy obesity” (MHO) is not at risk for metabolic complications from obesity.8 A systematic review reported a various prevalence of MHO ranged from 0.13% to 0.86%.9 MHO individuals were characterized by the absence of unfavorable metabolic state such as insulin resistance, dyslipidemia, hypertension, and an inflammatory profile.10,11 A meta-analysis reported that compared to metabolically healthy normal-weight (MHNW) individuals, people with MHO are not at an increased risk of cardiovascular diseases.12 A study suggested that women with MHO have better inflammation state than women with insulin resistance.13 However, MHO individuals are susceptible to metabolic syndrome. A 10-year Follow-up indicated nearly half of the MHO individuals would develop one or more metabolic abnormalities.9 The studies suggested that MHO individuals were intermediate phenotype between MHNW subjects and metabolic unhealthy obese (MUO) individuals.14,15
In contrast to MHO individuals, a subset of normal-weight individuals with metabolically unhealthy state called as “metabolically unhealthy normal-weight” (MUNW) has also been suggested. About twenty percent of the normal-weight adult population is MUNW individuals.16 A study reported that MUNW individuals have a more than 3-fold higher risk of cardiovascular diseases.16 Thus, given that a range of metabolically obese and lean phenotypes exists, the influence of obesity on the cardiovascular risk should be determined on the basis of the metabolic state in individuals.
Moreover, it is necessary to identify the origin and etiology of obesity. It has been demonstrated that genetic factors play a key role in the risk of becoming obese.17 The genome-wide association studies (GWAS) for obesity detected strong association between the fat mass- and obesity-associated gene (FTO) with higher body mass index (BMI) and metabolically unhealthy state in individuals.18,19 At FTO-rs9939609 SNP, carriers of risk genotype (AA) have a 2.02-fold higher risk for obesity and 1.17-fold higher risk for metabolic syndrome compared with non-risk genotype carriers.20,21 However, in several studies, the association FTO with metabolic traits was entirely explained by the association with obesity.22,23 Investigation of the association between FTO variants and metabolically obesity phenotypes may provide interesting insight in these relationships.
Thus, the aim of our study was to compare cardiometabolic index (CMI), atherogenic index of plasma (AIP), lipid accumulation product (LAP) and novel anthropometric indices between metabolically obesity phenotypes with regard to the role of the FTO-rs9939609 gene polymorphism.
Methods
Research Design and Participants
This cross-sectional study was conducted on 165 individuals (men and female) in the endocrine clinic of Golestan Hospital of Ahvaz Jundishapur University of Medical science in Ahvaz, Iran. Prior to the sampling patients, permission was obtained from the hospital head. Simple random sampling without replacement technique was used to collect samples. Inclusion criteria were as follows: 20 to 65 years of age and BMI between 18.5–35 kg/m2. Exclusion criteria were as follows: pregnant or lactating women, inflammatory disease, liver dysfunction, adrenal or thyroid dysfunction, cancer.
Obesity was defined based on BMI˃ 30 kg/m2. Metabolic syndrome was considered based on ATPIII criteria. Individuals grouped into four groups: 1) MHNW; metabolically healthy normal weight 2) MUNW; metabolic unhealthy normal weight 3) MHO; metabolically healthy obese 4) MUO; metabolic unhealthy obese. According to the metabolic conditions, MHO individuals are better than MUO individuals, and worse than MHNW individuals.
Ethical Approval
The study was conducted in accordance with the Declaration of Helsinki. All procedures involving patients were approved by Ethics committee of Ahvaz University of Medical Sciences (Ethical code: IR.AJUMS.REC.1396.346), Ahvaz, Iran. After describing the study for participants through an interview, all participants signed a written informed consent form.
Anthropometric and Blood Pressure Measurement
Weight and height of participants were determined in an overnight fasting status using a standard scale (Seca). BMI was calculated using the formula: (weight (kg)/(height2 (M)). The waist circumference (WC) and hip circumference (HC) were measured by the standard method.24 The Waist-to-hip ratio was calculated. Anthropometric indices were calculated by the following formula:24,25
Weight-adjusted-waist index (WWI): WC (cm) divided by the square root of weight (kg) (cm/√kg)
A body shape index (ABSI) = WC/BMI2/3 × heigh1/2
Body adiposity index (BAI): [hip circumference (cm) ÷ height (m) 1.5] −18
The SBP (systolic blood pressure), DBP (diastolic blood pressure), and the HR (heart rate) were measured. To evaluate the patient’s blood pressure, the participants sit on a chair and have no physical activity 1 hour. The mean arterial pressure (MAP) was calculated: (2DBP + SBP)/3).
Biochemical Measurements and Dietary Intake
The blood samples (5mL) were collected in the 12-h fasting status. The blood samples were centrifuged (3000r.p.m. for 10 minutes). The lipid profile evaluated and the remnants of sera were stored at −80°C for later assessment. The concentrations of serum TC (total cholesterol), TG (triglyceride), HDL-C and LDL-C were measured by auto-analyser. The atherogenic index of plasma (AIP) was calculated as the logarithm of the molar ratio of TG/HDL-C. The serum hs-CRP (high sensitivity C-reactive protein), IL-6 (interleukin-6) and TAC (total antioxidant capacity) concentrations were assessed by ELISA kits. Cardiovascular indices were calculated by the following formula:
Lipid accumulation product (LAP): Male LAP = [waist (cm)−65] × TG concentration (mmol/l) and female LAP= [waist (cm)−58] × TG concentration (mmol/l)
Cardiometabolic index (CMI): TG/HDL-C × (Waist-to-height)
Atherogenic index of plasma (AIP): Log (TG/HDL-C)
The usual dietary intake of individuals in the previous year was collected using a food frequency questionnaire (FFQ).
Genotyping of the FTO-rs9939609
The genomic DNA extraction from whole blood was done by the DNA purification Kit according to the instructions of the manufacturer (Sinaclon, Iran). We used PCR-RFLP (Polymerase chain’s reaction-restriction fragment length polymorphism) of FTO‐rs9939609 gene for genotyping the SNPs (single‐nucleotide polymorphisms). The primers were used for amplifying a DNA fragment (containing rs9939609 polymorphism). The PCR product of the FTO‐rs9939609 was digested by restriction enzyme (ScaI).
Statistical Analysis
The software SPSS 20.0 (SPSS Inc, Chicago, IL, USA) was used to analyze data. The data normality was checked by Kolmogorov–Smirnov test. The chi-squared test, Student’s t-test and ANOVA were used to evaluate differences within groups. P-value <0.05 was considered significant. Comparisons CRP level between obesity and FTO phenotypes were performed using logistic regression using low-risk groups as the reference.
Results
Prior to the analysis, individuals with missing data on the demographic, dietary, and biochemical characteristics (n=6) were excluded from the database. Consequently, data from 159 people (mean age: 52.97±10.01 years) were included for analysis. According to the analysis of data related to obesity and metabolic state, subjects were divided into four groups: 42 MHNW (26.4%), 51 MUNW (32.1%), 24 MHO (15.1%) and 42 MUO (26.4%).
Table 1 shows anthropometric and biochemical characteristics between four groups according to the metabolic state. The inter group-group analysis did not show significant difference age between groups. Waist circumference, waist-height ratio, BMI, body adiposity index (Figure 1) and weight-adjusted-waist index (Figure 3) were lower in normal-weight groups (MUNW and MHNW) than obese groups (MHO and MUO). The ABSI highest was observed in the MUNW group and ABSI lowest was observed in the MHNW group (Figure 2). The individuals with metabolic unhealthy state (MUNW and MUO) have significantly higher levels in systolic blood pressure, diastolic blood pressure, mean arterial pressure and TG levels than individuals with metabolically healthy state (MHNW and MHO). In addition, atherogenic index of plasma (Figure 4), lipid accumulation product (Figure 5) and cardiometabolic index (Figure 6) levels were more in MUNW and MUO than MHNW and MHO. Table 2 shows that there were no significant differences in dietary intake and between groups.
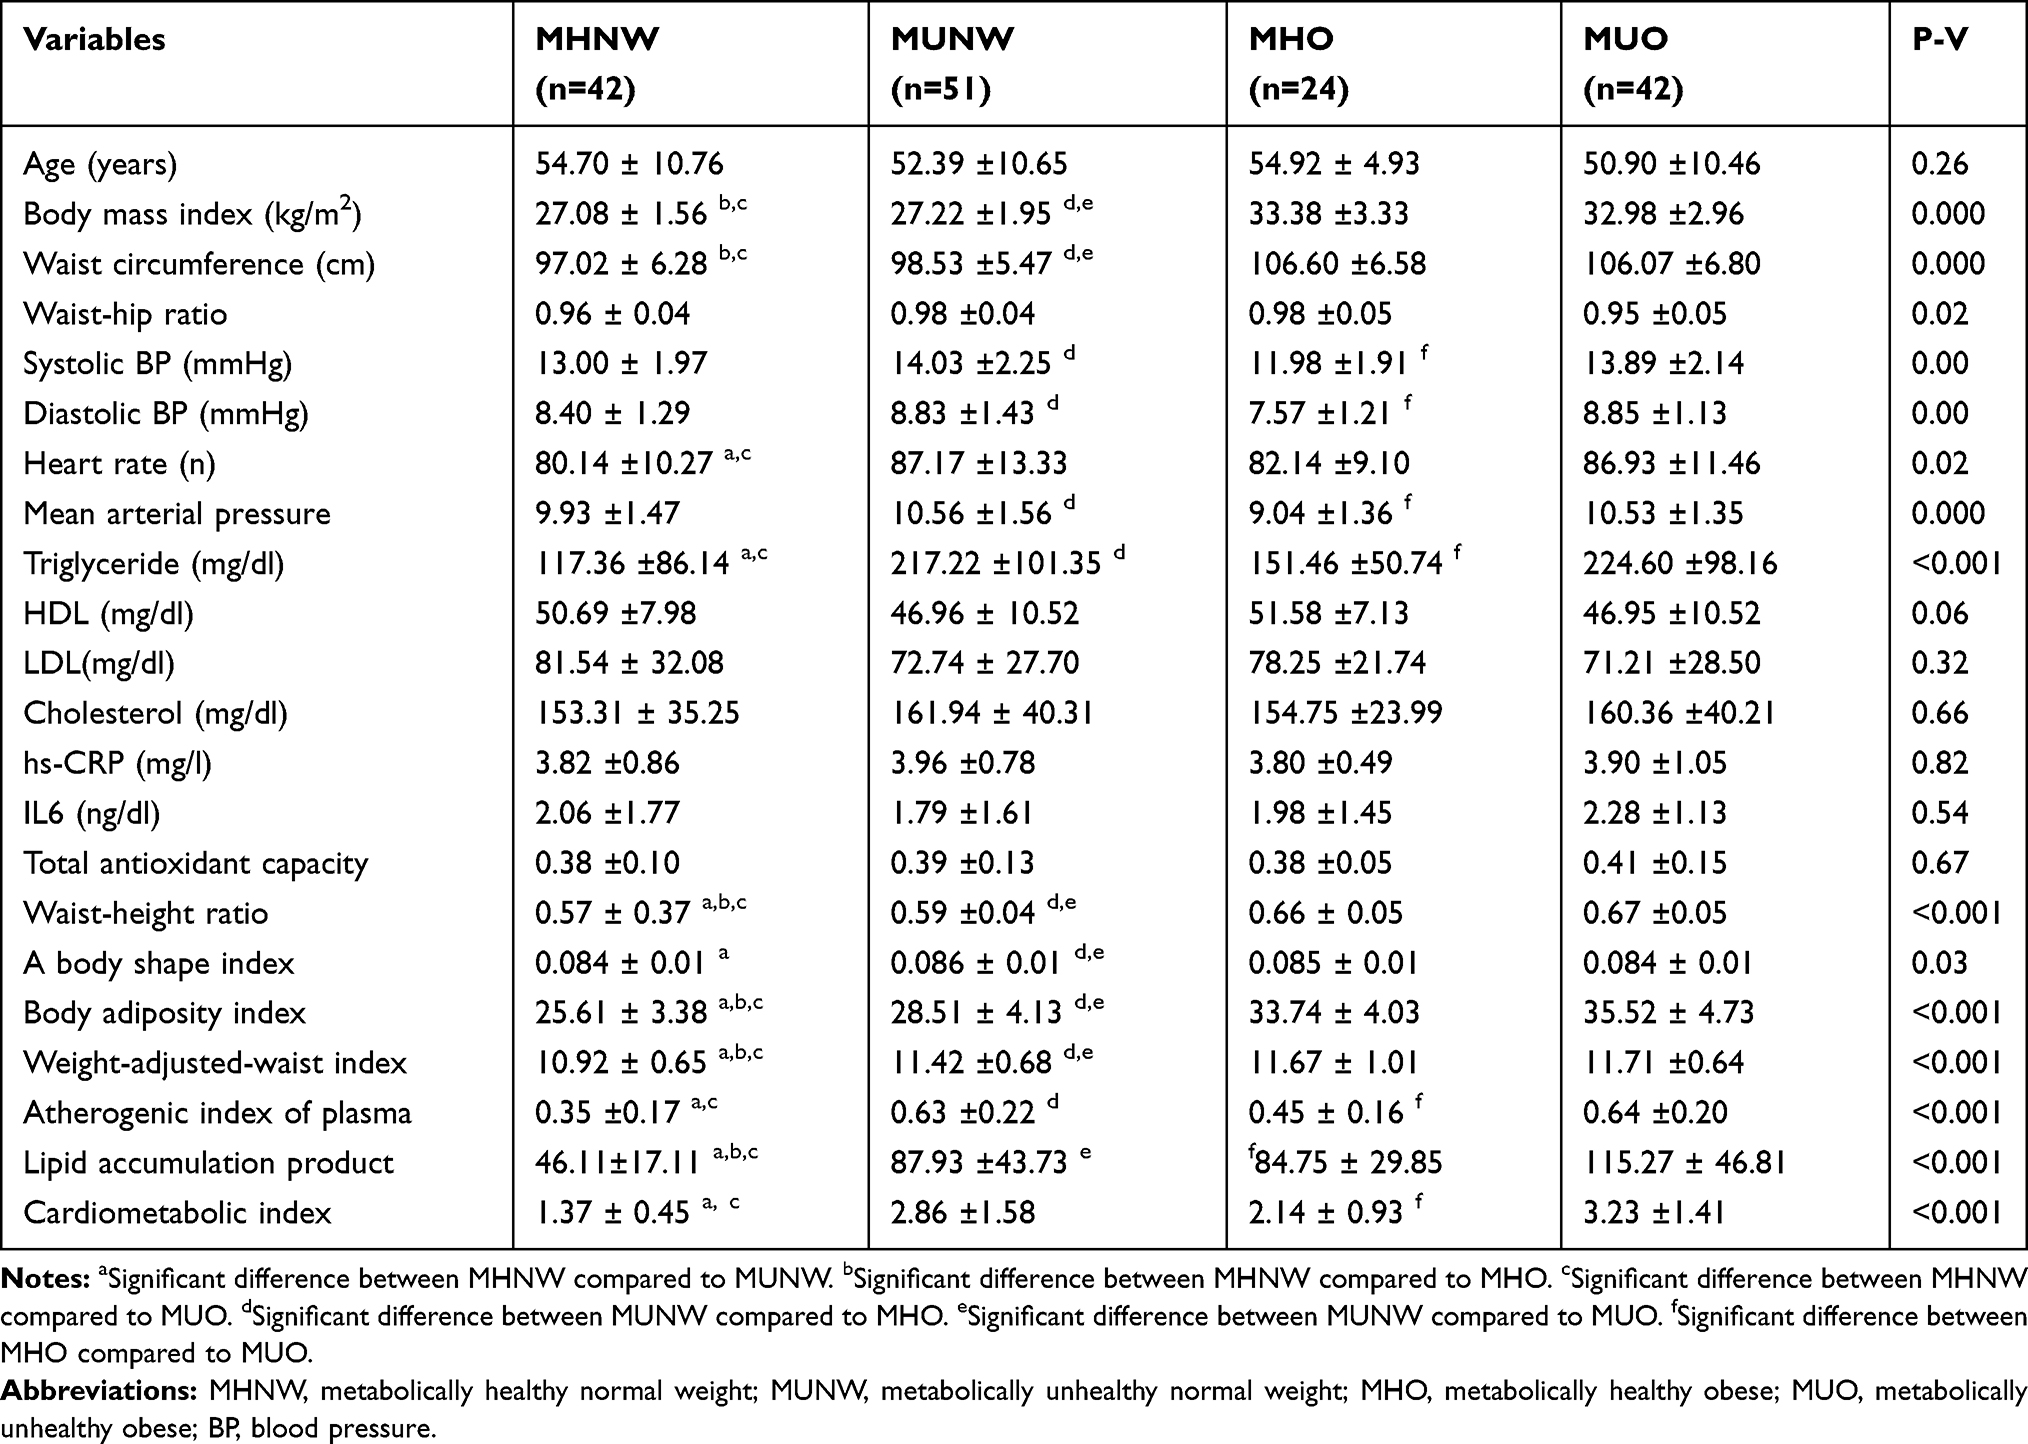 |
Table 1 Anthropometric and Biochemical Characteristics According to the Metabolic Condition |
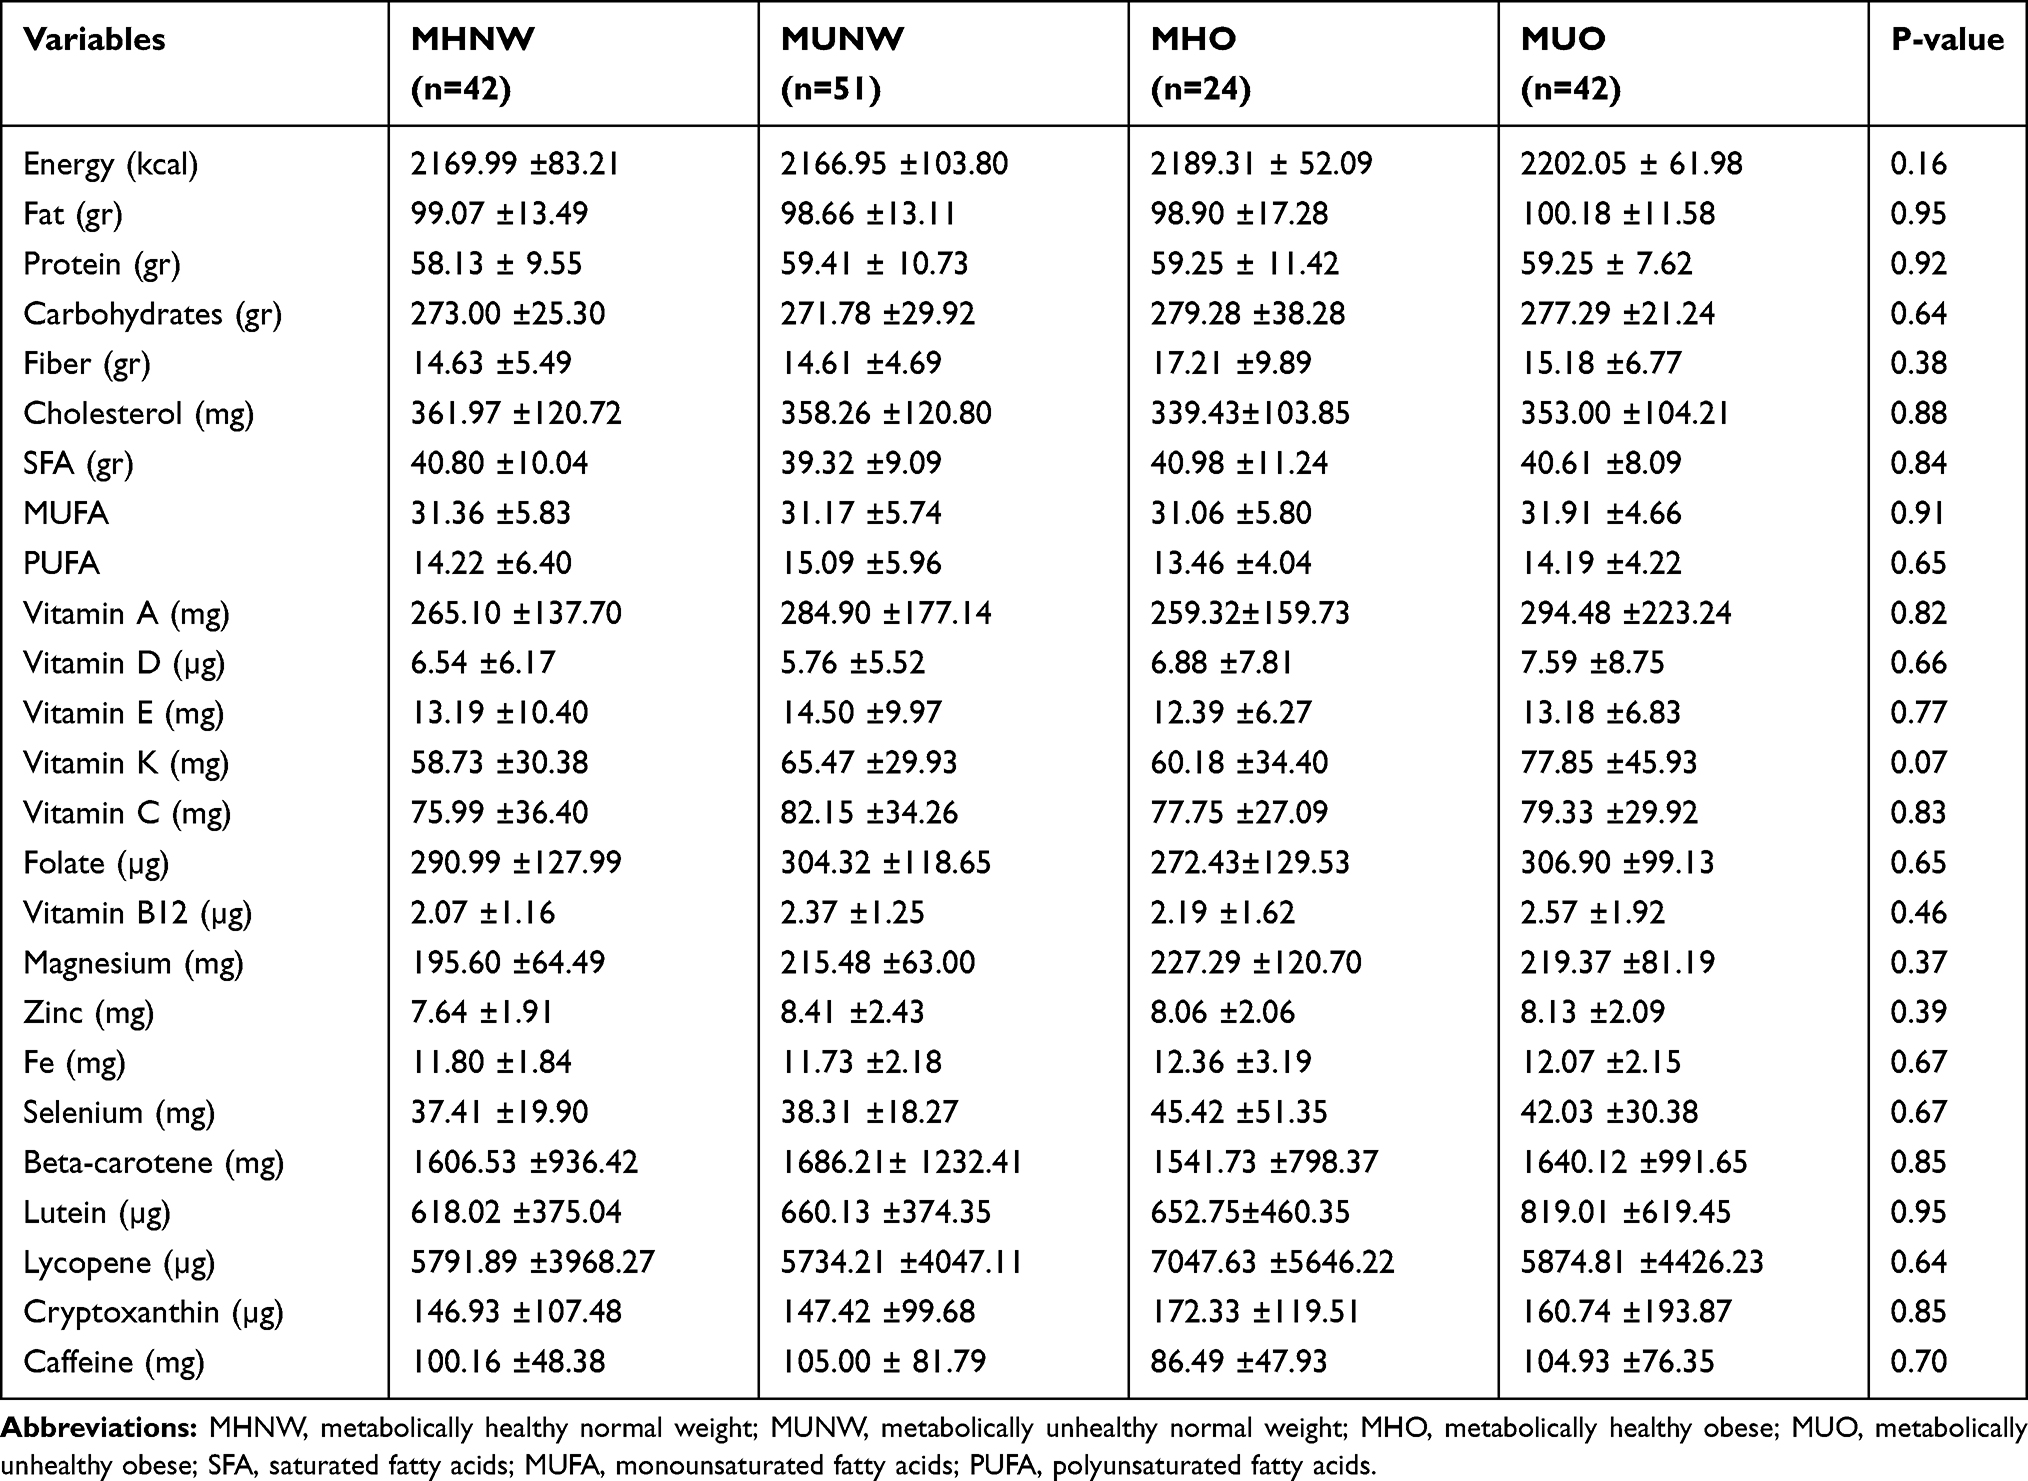 |
Table 2 Dietary Intake to the Metabolic Obesity Phenotypes |
 |
Figure 1 Compare body adiposity index between metabolical obesity phenotype. The asterisk (*) indicates a significant difference between two groups. |
 |
Figure 2 Compare a body shape index between metabolical obesity phenotype. The asterisk (*) indicates a significant difference between two groups. |
 |
Figure 3 Compare weight-adjusted-weight index between metabolical obesity phenotype. The asterisk (*) indicates a significant difference between two groups. |
 |
Figure 4 Compare atherogenetic index of placema between metabolical obesity phenotype. The asterisk (*) indicates a significant difference between two groups. |
 |
Figure 5 Compare lipid accumulation product between metabolical obesity phenotype. The asterisk (*) indicates a significant difference between two groups. |
 |
Figure 6 Compare cardiometabolic index between metabolical obesity phenotype. The asterisk (*) indicates a significant difference between two groups. |
The genotype frequencies for FTO-rs9939609 were 27.6%, 56% and 16.4%, for AA, AT and TT genotype, respectively. Pearson’s Chi-Square test showed that there was a significant difference between groups in the frequency of FTO rs9939609 genotype (AA, AT and TT, p=0.02). The genotype frequencies of obesity-risk allele AA were higher in MUO, MHO, MUNW and MHNW, respectively (Table 3).
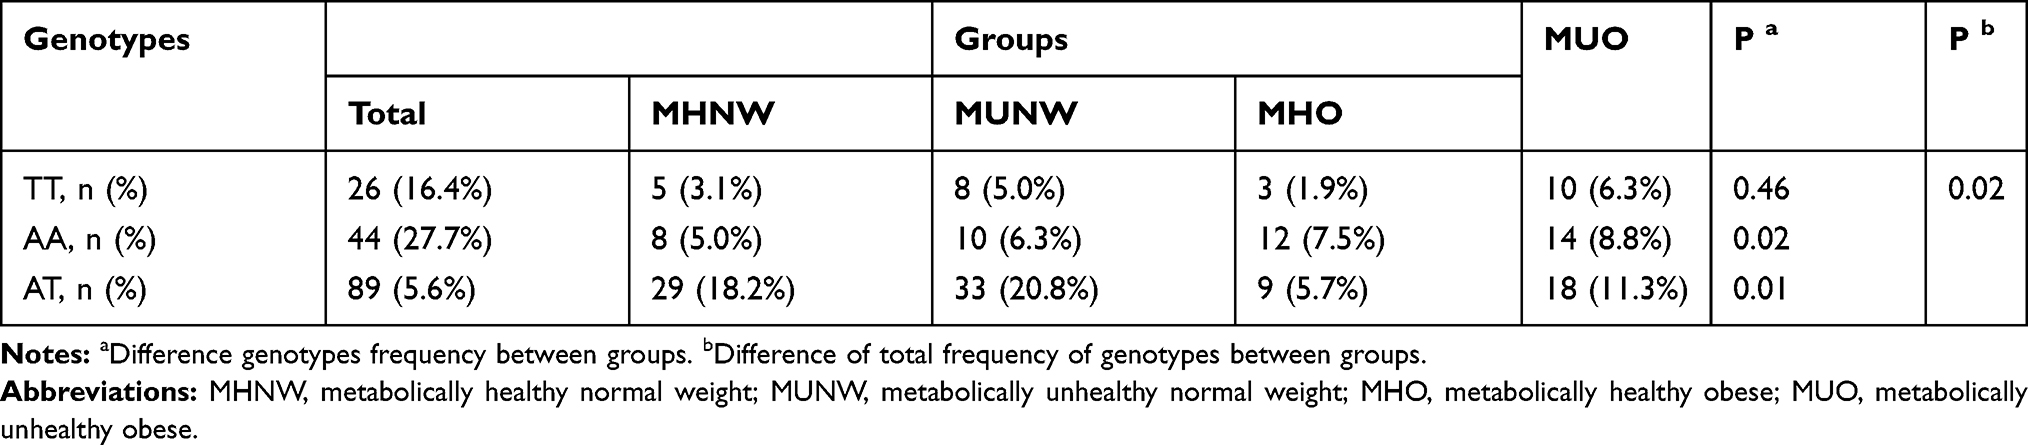 |
Table 3 FTO (Rs9939609) Genotypes Frequency in Groups |
Odd’s ratios for body adiposity index, weight-adjusted-waist index, lipid accumulation product and cardiometabolic-index-based metabolic obesity phenotypes are summarized in Table 4. The highest Odds ratios for cardiovascular and anthropometric indices were observed in MUO group.
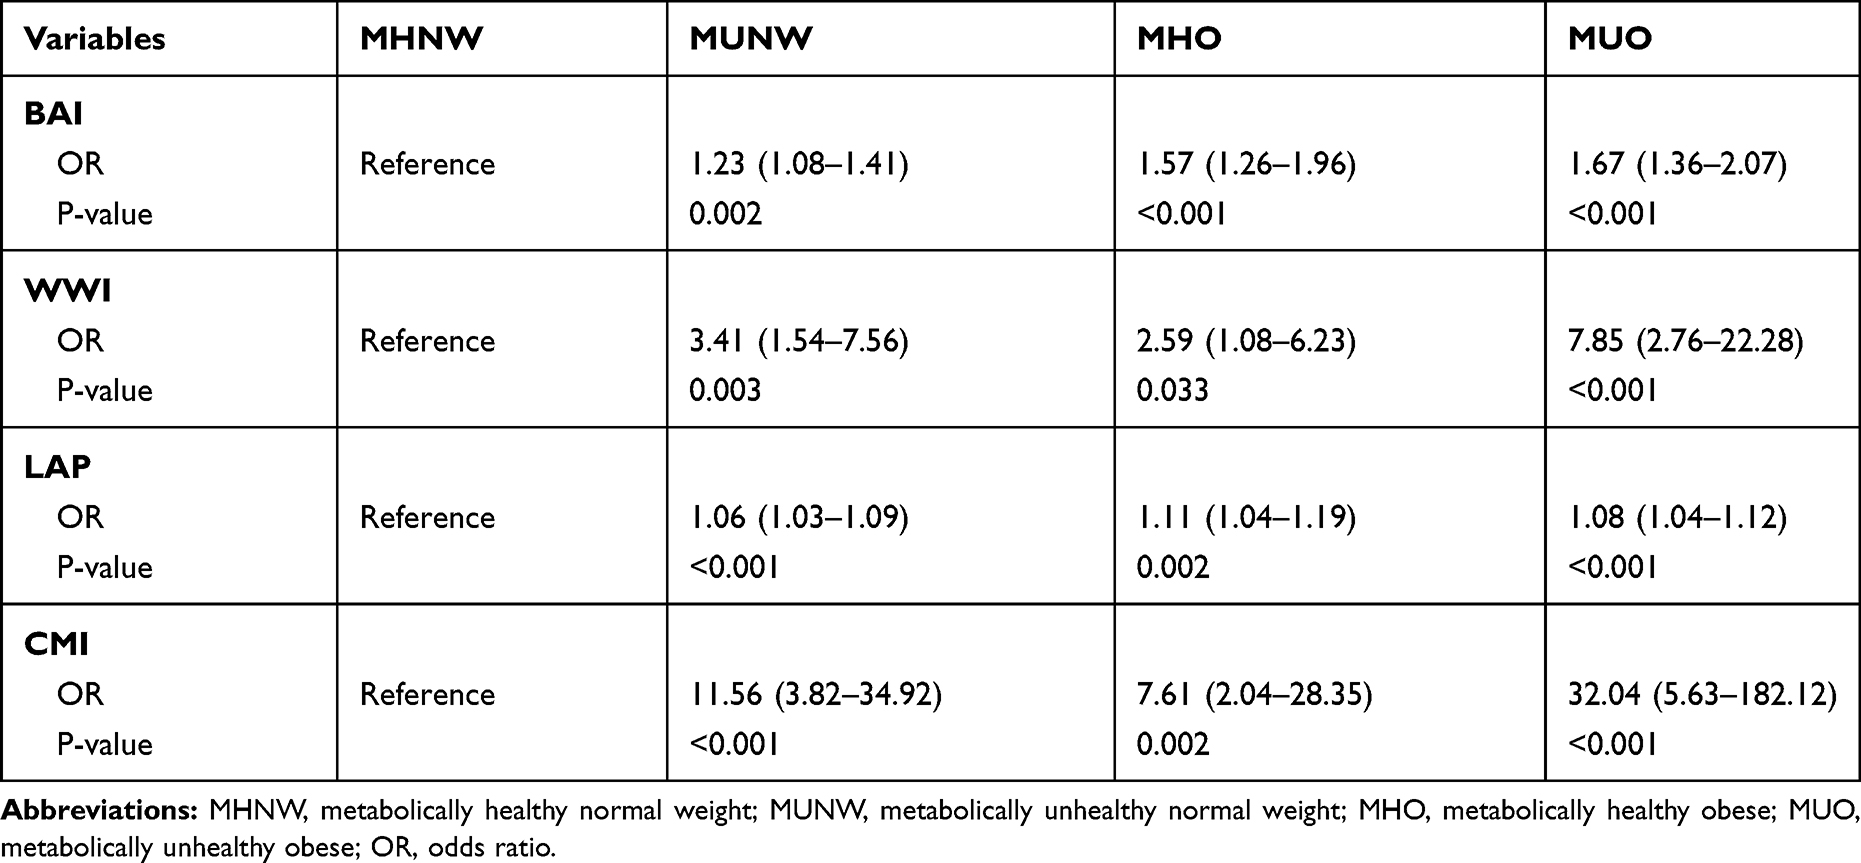 |
Table 4 Odds Ratios for Cardiometabolic Index, Atherogenic Index of Plasma and Novel Anthropometric Indices Based Metabolic Obesity Phenotypes |
Discussion
Our study indicated individuals with metabolic unhealthy phenotypes have increased risk for cardiovascular disease than individuals with metabolic healthy phenotypes. In addition, our findings suggest that metabolic health is more closely associated with cardiovascular diseases risk than obesity. Based on our results, lean individuals with unhealthy metabolic state can be considered a high-risk group for cardiovascular disease.
Similar to our findings, Karelis et al indicated the level of lipid and inflammation profile is favorable to obese women with metabolically healthy.13 Yoo et al suggested that MHO middle-aged men had a significant decrease in waist circumference, weight, BMI, body fat percentage, glycemic profile, TG, and TG/HDL-C ratio than the at-risk individuals.26 Furthermore, Cherqaoui et al study showed that waist circumference, Waist-hip ratio, TG and LDL levels were significantly lower in MHO than non-MHO subjects.27 The metabolic status is more associated with atherosclerosis compared to obesity. Rhee et al reported that the odd’s ratio for coronary artery calcium scores is more for metabolically unhealthy obese, metabolically unhealthy non-obese, and metabolically healthy obese, respectively.28 The lower concentrations hepatic enzymes, fat content, insulin resistance and fewer amount of visceral adipose tissue in metabolically healthy obese may play a protective role against metabolic diseases.29 One of the reasons for the better metabolic status of metabolically healthy obese than metabolically unhealthy lean can be due to lower body fat in them. The body fat in individuals is a better predictor of cardiovascular risks compared to BMI.30 Individuals with normal BMI and high body fat have more association with metabolic syndrome.31
Iglesias Molli et al showed that metabolically healthy obese present higher chronic inflammation (hs-CRP) level than metabolically healthy non-obese individuals.32 One of the reasons for these results is due to the use of different criteria for definition of obesity in various studies.33 However, the higher incidence of components of metabolic syndrome reported among metabolically healthy obese than metabolically healthy lean during follow-up shows the need to change lifestyle in the individuals for prevention of the conversion of metabolically healthy obese to an unhealthy phenotype.34
On the other, the previous studies evaluated the association of FTO gene polymorphisms with obesity, syndrome metabolic and diabetes. The present research is among the first study to evaluate association obesity phenotypes and FTO-rs9939609 gene variant. Our results showed significant difference of FTO-rs9939609 variant in obesity phenotypes. The genotype frequencies of high-risk genotype (AA) were more in MUO, MHO, MUNW and MHNW, respectively. Thus, FTO gene polymorphism is more closely associated with obesity than metabolical health. Recently, Sedaghati-Khayat et al suggested a significant association between unhealthy metabolic obese phenotype and some FTO markers (rs1421085, rs1121980, rs1558902 and rs8050136) after lipid profile adjustment, but their results did not show association between FTO gene variations and healthy metabolic obese phenotype.35
Conclusion
Normal-weight individuals with metabolic unhealthy status are at higher risk for cardiovascular diseases than obese individuals with metabolically healthy state. Thus, MHO group would be defined as a subgroup of obese individuals with an intermediate phenotype between MHNW and MUNW. The prevalence of carrying the high-risk genotype (AA) of FTO gene was more in obese and metabolic unhealthy phenotypes.
Disclosure
The authors report no conflicts of interest in this work.
References
1. Mazidi M, Banach M, Kengne AP, et al. Prevalence of childhood and adolescent overweight and obesity in Asian countries: a systematic review and meta-analysis. Arch Med Sci. 2018;14(6):1185–1203. doi:10.5114/aoms.2018.79001
2. Oh YS, Bae GD, Baek DJ, Park EY, Jun HS. Fatty acid-induced lipotoxicity in pancreatic beta-cells during development of type 2 diabetes. Front Endocrinol (Lausanne). 2018;9:384. doi:10.3389/fendo.2018.00384
3. Evia-Viscarra ML, Rodea-Montero ER, Apolinar-Jiménez E, Quintana-Vargas S. Metabolic syndrome and its components among obese (BMI ≥95th) Mexican adolescents. Endocr Connect. 2013;2(4):208–215. doi:10.1530/EC-13-0057
4. Bazyar H, Adibmanesh A, Javid AZ, et al. The relationship between metabolic factors and anthropometric indices with periodontal status in type 2 diabetes mellitus patients with chronic periodontitis. Obes Med. 2019;16:100138. doi:10.1016/j.obmed.2019.100138
5. Bawadi H, Katkhouda R, Tayyem R, Kerkadi A, Raad SB, Subih H. Abdominal fat is directly associated with inflammation in persons with type-2 diabetes regardless of glycemic control – a Jordanian study. Diabetes Metab Syndr Obes. 2019;12:2411–2417. doi:10.2147/DMSO.S214426
6. Ellulu MS, Patimah I, Khaza’ai H, Rahmat A, Abed Y. Obesity and inflammation: the linking mechanism and the complications. Arch Med Sci. 2017;13(4):851–863. doi:10.5114/aoms.2016.58928
7. Papaetis GS, Papakyriakou P, Panagioto TN. Central obesity, type 2 diabetes and insulin: exploring a pathway full of thorns. Arch Med Sci. 2015;11(3):463–482. doi:10.5114/aoms.2015.52350
8. Phillips CM. Metabolically healthy obesity: definitions, determinants and clinical implications. Rev Endocr Metab Disord. 2013;14(3):219–227. doi:10.1007/s11154-013-9252-x
9. Lin H, Zhang L, Zheng R, Zheng Y. The prevalence, metabolic risk and effects of lifestyle intervention for metabolically healthy obesity: a systematic review and meta-analysis: a PRISMA-compliant article. Medicine (Baltimore). 2017;96(47):e8838. doi:10.1097/MD.0000000000008838
10. Bluher M. Are metabolically healthy obese individuals really healthy? Eur J Endocrinol. 2014;171(6):R209–R219. doi:10.1530/EJE-14-0540
11. Samocha-Bonet D, Dixit VD, Kahn CR, et al. Metabolically healthy and unhealthy obese: the 2013 stock conference report. Obes Rev. 2014;15(9):697–708. doi:10.1111/obr.12199
12. Kramer CK, Zinman B, Retnakaran R. Are metabolically healthy overweight and obesity benign conditions? A systematic review and meta-analysis. Ann Intern Med. 2013;159(11):758–769. doi:10.7326/0003-4819-159-11-201312030-00008
13. Karelis AD, Faraj M, Bastard JP, et al. The metabolically healthy but obese individual presents a favorable inflammation profile. J Clin Endocrinol Metab. 2005;90(7):4145–4150. doi:10.1210/jc.2005-0482
14. Zheng R, Zhou D, Zhu Y. The long-term prognosis of cardiovascular disease and all-cause mortality for metabolically healthy obesity: a systematic review and meta-analysis. J Epidemiol Community Health. 2016;70(10):1024–1031. doi:10.1136/jech-2015-206948
15. Bell JA, Kivimaki M, Hamer M. Metabolically healthy obesity and risk of incident type 2 diabetes: a meta-analysis of prospective cohort studies. Obes Rev. 2014;15(6):504–515. doi:10.1111/obr.12157
16. Stefan N, Schick F, Häring HU. Causes, characteristics, and consequences of metabolically unhealthy normal weight in humans. Cell Metab. 2017;26(2):292–300. doi:10.1016/j.cmet.2017.07.008
17. Mǎrginean CO, Mǎrginean C, Meliţ LE. New insights regarding genetic aspects of childhood obesity: a minireview. Front Pediatr. 2018;6:271. doi:10.3389/fped.2018.00271
18. Wang K, Li WD, Zhang CK, et al. A genome-wide association study on obesity and obesity-related traits. PLoS One. 2011;6(4):e18939. doi:10.1371/journal.pone.0018939
19. Witka BZ, Oktaviani DJ, Marcellino M, Barliana MI, Abdulah R. Type 2 diabetes-associated genetic polymorphisms as potential disease predictors. Diabetes Metab Syndr Obes. 2019;12:2689–2706. doi:10.2147/DMSO.S230061
20. Duicu C, Mărginean CO, Voidăzan S, Tripon F, Bănescu C. FTO rs 9939609 SNP is associated with adiponectin and leptin levels and the risk of obesity in a cohort of romanian children population. Medicine (Baltimore). 2016;95(20):e3709. doi:10.1097/MD.0000000000003709
21. Freathy RM, Timpson NJ, Lawlor DA, et al. Common variation in the FTO gene alters diabetes-related metabolic traits to the extent expected given its effect on BMI. Diabetes. 2008;57(5):1419–1426. doi:10.2337/db07-1466
22. Kring SI, Holst C, Zimmermann E, et al. FTO gene associated fatness in relation to body fat distribution and metabolic traits throughout a broad range of fatness. PLoS One. 2008;3(8):e2958. doi:10.1371/journal.pone.0002958
23. Barber TM, Bennett AJ, Groves CJ, et al. Association of variants in the fat mass and obesity associated (FTO) gene with polycystic ovary syndrome. Diabetologia. 2008;51(7):1153–1158. doi:10.1007/s00125-008-1028-6
24. Ashtary-Larky D, Daneghian S, Alipour M, et al. Waist circumference to height ratio: better correlation with fat mass than other anthropometric indices during dietary weight loss in different rates. Int J Endocrinol Metab. 2018;16(4):e55023. doi:10.5812/ijem.55023
25. Park Y, Kim NH, Kwon TY, Kim SG. A novel adiposity index as an integrated predictor of cardiometabolic disease morbidity and mortality. Sci Rep. 2018;8(1):16753. doi:10.1038/s41598-018-35073-4
26. Yoo HK, Choi EY, Park EW, Cheong YS, Bae RA. Comparison of metabolic characteristics of metabolically healthy but obese (MHO) middle-aged men according to different criteria. Korean J Fam Med. 2013;34(1):19–26. doi:10.4082/kjfm.2013.34.1.19
27. Cherqaoui R, Kassim TA, Kwagyan J, et al. The metabolically healthy but obese phenotype in African Americans. J Clin Hypertens (Greenwich). 2012;14(2):92–96. doi:10.1111/j.1751-7176.2011.00565.x
28. Rhee EJ, Seo MH, Kim JD, et al. Metabolic health is more closely associated with coronary artery calcification than obesity. PLoS One. 2013;8(9):e74564. doi:10.1371/journal.pone.0074564
29. Messier V, Karelis AD, Robillard ME, et al. Metabolically healthy but obese individuals: relationship with hepatic enzymes. Metabolism. 2010;59(1):20–24. doi:10.1016/j.metabol.2009.06.020
30. Zeng Q, Dong SY, Sun XN, Xie J, Cui Y. Percent body fat is a better predictor of cardiovascular risk factors than body mass index. Braz J Med Biol Res. 2012;45(7):591–600. doi:10.1590/S0100-879X2012007500059
31. Madeira FB, Silva AA, Veloso HF, et al. Normal weight obesity is associated with metabolic syndrome and insulin resistance in young adults from a middle-income country. PLoS One. 2013;8(3):e60673. doi:10.1371/journal.pone.0060673
32. Iglesias Molli AE, Penas Steinhardt A, López AP, et al. Metabolically healthy obese individuals present similar chronic inflammation level but less insulin-resistance than obese individuals with metabolic syndrome. PLoS One. 2017;12(12):e0190528. doi:10.1371/journal.pone.0190528
33. Velho S, Paccaud F, Waeber G, Vollenweider P, Marques-Vidal P. Metabolically healthy obesity: different prevalences using different criteria. Eur J Clin Nutr. 2010;64(10):1043–1051. doi:10.1038/ejcn.2010.114
34. Bradshaw PT, Reynolds KR, Wagenknecht LE, Ndumele CE, Stevens J. Incidence of components of metabolic syndrome in the metabolically healthy obese over 9 years follow-up: the atherosclerosis risk in communities study. Int J Obes (Lond). 2018;42(3):295–301. doi:10.1038/ijo.2017.249
35. Sedaghati-Khayat B, Barzin M, Akbarzadeh M, et al. Lack of association between FTO gene variations and metabolic healthy obese (MHO) phenotype: Tehran cardio-metabolic genetic study (TCGS). Eat Weight Disord. 2020;25(1):25–35. doi:10.1007/s40519-018-0493-2
 © 2020 The Author(s). This work is published and licensed by Dove Medical Press Limited. The
full terms of this license are available at https://www.dovepress.com/terms
and incorporate the Creative Commons Attribution
- Non Commercial (unported, 3.0) License.
By accessing the work you hereby accept the Terms. Non-commercial uses of the work are permitted
without any further permission from Dove Medical Press Limited, provided the work is properly
attributed. For permission for commercial use of this work, please see paragraphs 4.2 and 5 of our Terms.
© 2020 The Author(s). This work is published and licensed by Dove Medical Press Limited. The
full terms of this license are available at https://www.dovepress.com/terms
and incorporate the Creative Commons Attribution
- Non Commercial (unported, 3.0) License.
By accessing the work you hereby accept the Terms. Non-commercial uses of the work are permitted
without any further permission from Dove Medical Press Limited, provided the work is properly
attributed. For permission for commercial use of this work, please see paragraphs 4.2 and 5 of our Terms.